VFVA: A High-Volatility Value ETF

Summary
- Vanguard U.S. Value Factor ETF holds 500+ stocks with value characteristics.
- The VFVA ETF is actively managed, so the strategy rules are not fully disclosed.
- It is overweight in financials and has a high turnover.
- VFVA is much more volatile than other value ETFs.
- Quantitative Risk & Value members get exclusive access to our real-world portfolio. See all our investments here »
Dilok Klaisataporn
This article series aims at evaluating ETFs (exchange-traded funds) regarding past performance and portfolio metrics. Reviews with updated data are posted when necessary.
VFVA strategy and portfolio
Vanguard U.S. Value Factor ETF (BATS:VFVA) has 594 holdings, a trailing 12-month distribution yield of 2.43%, and a total expense ratio of 0.13%. Distributions are paid quarterly. It started investing operations on 02/13/2018, and it is actively managed (it doesn’t track an index). As explained in the prospectus by Vanguard, a quantitative model is used to
“generate higher returns relative to the broad U.S. equity market by investing in stocks with relatively lower share prices relative to fundamental values as determined by the advisor.”
Such a description gives a lot of flexibility to fund managers. On the downside, the investing process is a black box. It is impossible for us to duplicate and backtest it. The portfolio turnover is high: 64% of average asset value in the last fiscal year.
VFVA invests almost exclusively in U.S. companies (98.7% of asset value). It is quite balanced across all size segments, from large companies to micro-cap. The iShares Russell 3000 ETF (IWV) is used as a benchmark.
Size segments (chart: author; data: Fidelity)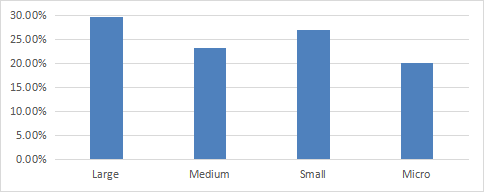
The top sectors are financials (26.3%), energy (16%), industrials (13.5%) and consumer discretionary (13.3%). Other sectors are below 8%. Compared to the Russell 3000 index, the fund overweights these top 4 sectors, and also materials. It underweights technology, healthcare, communication, real estate and it ignores utilities.
VFVA sector breakdown (chart: author; data: Vanguard, iShares)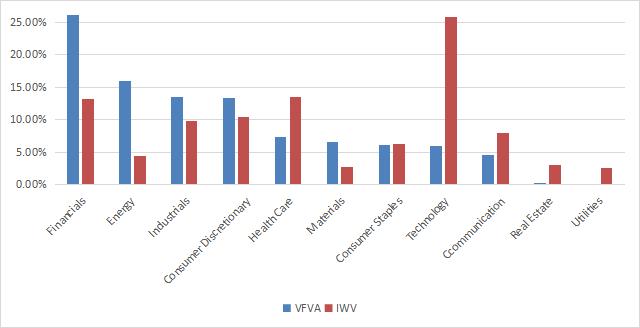
VFVA is much cheaper than its benchmark regarding the usual valuation ratios, as reported in the next table.
VFVA | IWV | |
Price / Earnings TTM | 7.7 | 19.99 |
Price / Book | 1.24 | 3.42 |
Price / Sales | 0.62 | 2.14 |
Price / Cash Flow | 5.01 | 14.27 |
Source: Fidelity.
It currently holds almost 600 stocks. The top 10 holdings (listed below with valuation ratios) represent 10.5% of asset value, and the heaviest one weighs about 1.3%. Therefore, risks related to individual companies are very low.
Ticker | Name | Weight (%) | P/E TTM | P/E fwd | P/Sales TTM | P/Book | P/Net Free CashFlow | Yield% |
Bank of America Corp. | 1.34% | 8.80 | 8.56 | 1.79 | 0.95 | 4.79 | 3.01 | |
Citigroup, Inc. | 1.12% | 6.71 | 7.75 | 0.78 | 0.50 | 4.11 | 4.24 | |
Wells Fargo & Co. | 1.12% | 12.10 | 8.81 | 1.49 | 1.00 | 13.41 | 2.83 | |
Ford Motor Co. | 1.08% | 19.03 | 7.57 | 0.33 | 1.29 | N/A | 4.42 | |
Chevron Corp. | 1.04% | 8.61 | 11.41 | 1.30 | 1.90 | 11.69 | 3.79 | |
U.S. Bancorp | 1.00% | 8.82 | 7.51 | 1.62 | 1.10 | 5.67 | 5.81 | |
AT&T, Inc. | 0.99% | N/A | 6.67 | 0.99 | 1.21 | 21.33 | 6.91 | |
General Motors Co. | 0.94% | 5.54 | 5.34 | 0.31 | 0.72 | N/A | 1.00 | |
Pioneer Natural Resources Co. | 0.94% | 7.34 | 9.79 | 2.21 | 2.31 | 201.26 | 11.42 | |
Verizon Communications, Inc. | 0.89% | 6.90 | 7.57 | 1.10 | 1.61 | 71.83 | 7.37 |
Ratios: Portfolio123.
The next chart plots total returns since 02/19/2018 of VFVA, IWV and four value-style ETFs investing mostly in large and mid-cap companies:
- Vanguard Value Index Fund (VTV)
- Russell 1000 Value Index (IWD)
- iShares MSCI USA Value Factor ETF (VLUE)
- iShares S&P 500 Value ETF (IVE).
VFVA lags its benchmark IWV and is in the middle of the pack of value funds.
VFVA vs benchmark and competitors since inception (Seeking Alpha)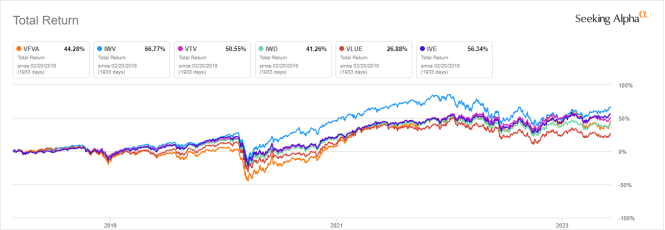
In the last 12 months, VFVA is second to last:
VFVA vs benchmark and competitors, last 12 months (Seeking Alpha)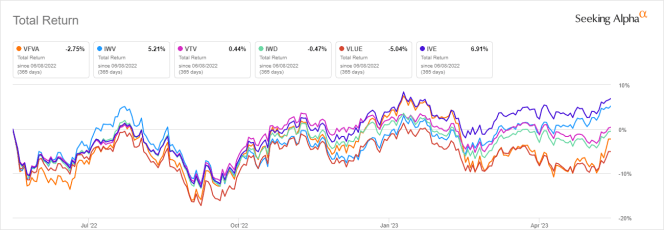
The next table reports the beta of the value ETFs listed above relative to a benchmark (here the Russel 3000), calculated on the last 5 years. "Beta" is a measure of the volatility, or systematic risk, of a security in comparison to the market as a whole. VFA is by far the most volatile, and it has the highest risk in price variation.
Fund | Beta |
VFVA | 1.27 |
VLUE | 1.09 |
IWD | 0.98 |
IVE | 0.95 |
VTV | 0.91 |
Calculation with Portfolio123.
The two weaknesses of most value ETFs
The fund is actively managed, and the quantitative model is not disclosed. VFVA has a sector breakdown and a return since 2018 similar to competitors, so it is likely to have the same weaknesses. The first one is to classify all stocks on the same criteria. However, my monthly dashboard here shows how valuation and quality metrics may vary across sectors. A consequence is to overweight sectors where valuation ratios are naturally cheaper. It explains why financials have such a heavyweight in VFVA, and why technology is so underweight. Technology is a sector with large intangible assets (especially massive R&D and large user databases), which are not correctly reflected by valuation ratios.
The second weakness comes from the price/book ratio (P/B), which adds some risk in most value indexes. Historical data show that a large group of companies with low P/B has a higher probability to hold value traps than a same-size group with low price/earnings, price/sales or price/free cash flow. Statistically, such a group shows a higher volatility and deeper drawdowns. The next table shows the return and risk metrics of the cheapest quarter of the S&P 500 (i.e., 125 stocks) measured in price/book, price/earnings, price/sales and price/free cash flow. The sets are reconstituted annually between 1/1/2000 and 1/1/2023 with elements in equal weight.
Annual.Return | Drawdown | Sharpe ratio | Volatility | |
Cheapest quarter in P/B | 8.54% | -81.55% | 0.35 | 37.06% |
Cheapest quarter in P/E | 10.71% | -73.62% | 0.48 | 25.01% |
Cheapest quarter in P/S | 12.82% | -76.16% | 0.47 | 34.83% |
Cheapest quarter in P/FCF | 15.32% | -74.77% | 0.61 | 27.03% |
Data calculated with Portfolio123.
This explains my choice of not using P/B in my Dashboard List model (more info at the end of this post).
Takeaway
Vanguard U.S. Value Factor ETF is an actively managed fund holding 594 stocks with value characteristics. It is overweight in financials and has a high turnover. It has been lagging its benchmark, the Russell 3000 index, since inception in 2018. Price history is too short to assess the strategy relative to a broad index, but it is long enough to compare it to other value-style ETFs. In this regard, VFVA is in the middle of its popular competitors as for total return, but it is much more volatile. Therefore, I classify Vanguard U.S. Value Factor ETF as a high-risk ETF.
Quantitative Risk & Value (QRV) features data-driven strategies in stocks and closed-end funds outperforming their benchmarks since inception. Get started with a two-week free trial now.

This article was written by

Step up your investing experience: try Quantitative Risk & Value for free now (limited offer).
I am an individual investor and an IT professional, not a finance professional. My writings are data analysis and opinions, not investment advice. They may contain inaccurate information, despite all the effort I put in them. Readers are responsible for all consequences of using information included in my work, and are encouraged to do their own research from various sources.
Analyst’s Disclosure: I/we have a beneficial long position in the shares of PXD either through stock ownership, options, or other derivatives. I wrote this article myself, and it expresses my own opinions. I am not receiving compensation for it (other than from Seeking Alpha). I have no business relationship with any company whose stock is mentioned in this article.
Seeking Alpha's Disclosure: Past performance is no guarantee of future results. No recommendation or advice is being given as to whether any investment is suitable for a particular investor. Any views or opinions expressed above may not reflect those of Seeking Alpha as a whole. Seeking Alpha is not a licensed securities dealer, broker or US investment adviser or investment bank. Our analysts are third party authors that include both professional investors and individual investors who may not be licensed or certified by any institute or regulatory body.