Adding number of stocks with Long and Long Unwinding reading can give us positively impacting stocks.
Shubham Agarwal
Before we go ahead deeper into Built-Up Breadth, let us break it down and understand each of them one by one.
Built-up is known as a combination of trade data of any derivative contract. Popularly known to judge activity in futures contracts, built-up compares Futures price change and open interest change. Just a refresher, for both price and open interest going up and down there can be 4 combinations with following interpretations.
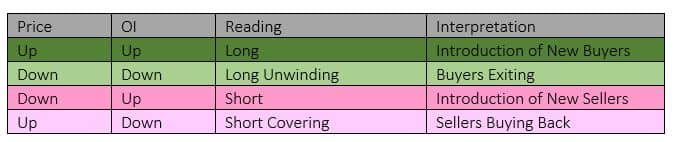
As one can see both Long and Long Unwinding readings are in green colour while the Short and Short Covering are in red shade. This is considering the activity of both OI (open Interest) and Price depicting dominance of Buyers (buying or exiting) is generally associated with a rising market. Similarly, Seller dominated Futures activity of Short and Short Covering is generally associated with a falling market.
Market breadth is not a new concept for anyone of us. The breadth is a simple comparison of the number of rising stocks and the number of falling stocks. Traditionally, it has been a good indicator of strength in the market move.
Now just like the market breadth or advance decline data we can use Built-Up data as well in identifying the shift in market mood. Instead of just the rise with Built Up data, we can now compare positive Price + OI activities and negative Price + OI activities.
The simple math of adding the number of stocks with Long and Long Unwinding reading can give us positively impacting stocks. Similarly, adding stocks with Short and Short Covering readings can give us the number of negatively impacting stocks.
All we need to do is keep a tally of this every time we are looking at the market. A greater number of negatively impacting stocks means Built-Up breadth is negative. Generally, we would have built-up breadth in sync with the market direction. Meaning, a positive market would have a larger number of stocks with Long + Long Unwinding. The same goes for a negative market and larger number of stocks with short +short covering.
This reading creates its value when in a rising market number of negative impacting stocks (short + short covering) turns greater than positive impacting stocks. Something similar happened this Thursday (8th June 2023) around 11 am in a rising market, the number of short + short covering was about 60 percent.
What followed was witnessed by all of us. Nifty saw a drop of around 100 points from those levels. This can be the opposite as well. We could have Long + Long Unwinding stocks overshooting in a falling market and the indices could turn around.
Built-up breadth may not be used as a single indicator to trade, it should definitely be looked at while taking a view of the market before taking stock-specific trades. The data of the number of Long, Long Unwinding, Short, Short Covering is freely available nowadays in many Options analytics app.
Disclaimer: The views and investment tips expressed by experts on Moneycontrol.com are their own and not those of the website or its management. Moneycontrol.com advises users to check with certified experts before taking any investment decisions.