3 Fat Yields To Evict

Summary
- 14% to 21% dividend yields. Inflated earnings provide the appearance of coverage.
- You should see the bigger picture.
- Hedges don't last forever. The benefits are already in book value.
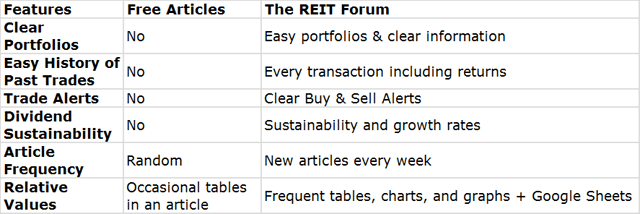
- Looking for a helping hand in the market? Members of The REIT Forum get exclusive ideas and guidance to navigate any climate. Learn More »
Recycle your capital into better opportunities.. gerenme/iStock via Getty Images
Get ready for charts, images, and tables because they are better than words. The ratings and outlooks we highlight here come after Scott Kennedy's weekly updates in the REIT Forum. Your continued feedback is greatly appreciated, so please leave a comment with suggestions.
REITs to Ditch
First up is Cherry Hill Mortgage (CHMI). Frequent readers may proclaim that I pick on Cherry Hill frequently. That's fair. However, I do it for a reason.
Seeking Alpha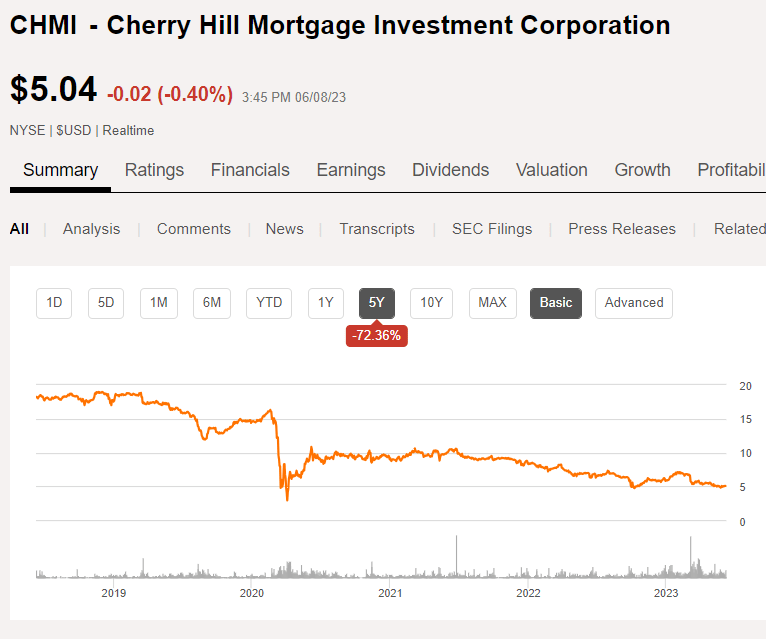
Don't tell me I was wrong to warn investors away from that stock. CHMI's payout ratio is getting worse. Now it is up to 125%. It was "only" 106% not so long. However, forward earnings keep going down:
TIKR.com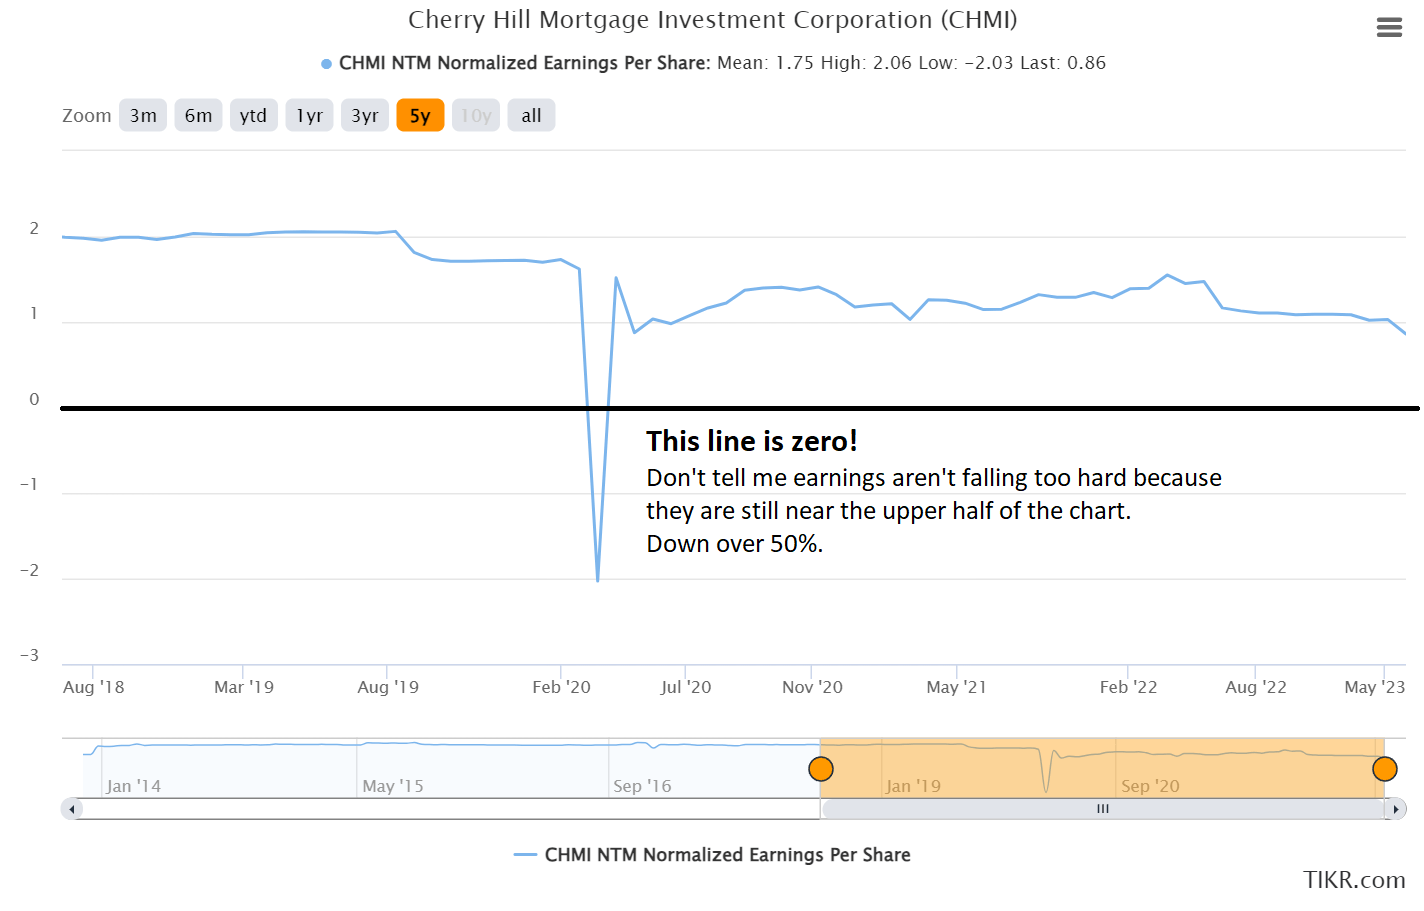
How could you possibly see this coming? Well, the dividend yield represents just over 20% of our projection for book value per share (as of early June 2023).
If a REIT is going to pay out 20% of book value, there's not going to be as much for reinvesting. Now some readers may think "Well, not if the REIT earns that much, Bozo!"
Allow me to simplify: Companies that use the fair market value of assets for book value will not generate a consistent 20% return. There may well be years where it happens, but it isn't the "normal" situation. The fact that a company has a high dividend doesn't prove that they are the exception.
How could you possibly see this coming?
Here's a slide from the Q4 2022 presentation:
CHMI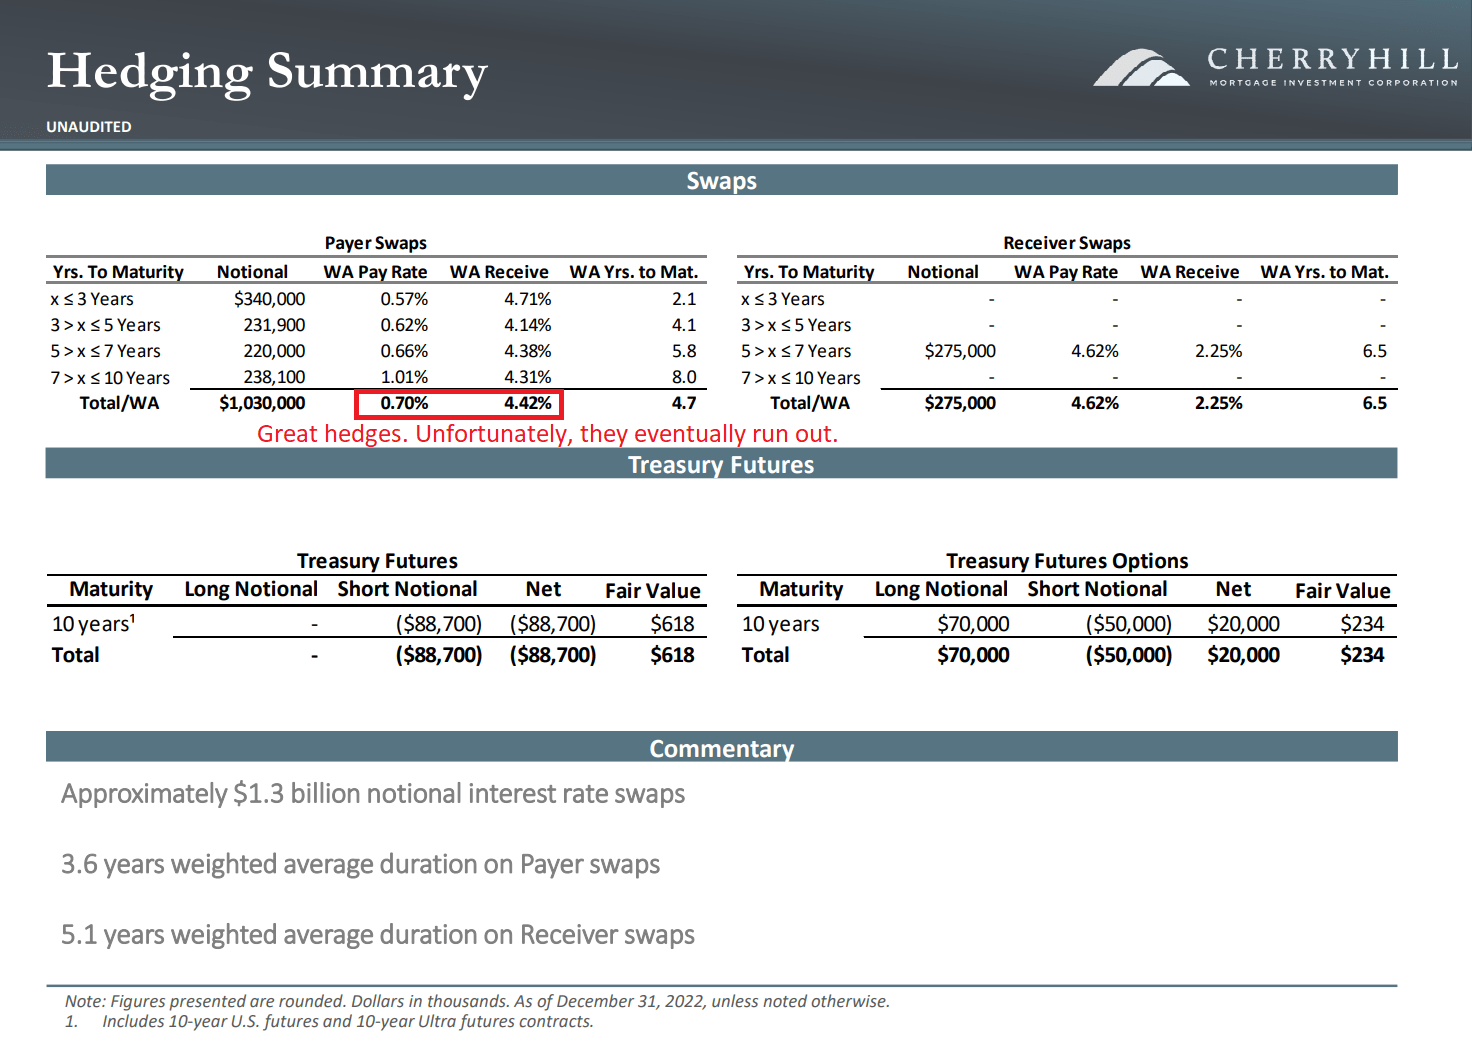
See how they had $1.03 billion in payer swaps? That was partially offset by the $275 million of receiver swaps. Overall, the net balance of those payer swaps was about $728 million.
To simplify this concept, effectively CHMI was fixing about $728 million of debt to a very low fixed rate. That's great for the years it lasts, but eventually, those swaps expire. Not so great. The present value of those swaps is already recorded in the unrealized gains on swaps. In other words, book value already factors this in.
I hate to say it, but it shows up in the comments if I don't. Someone is thinking:
"Hey, they have cash flow now! Pay me my dividend and some other sucker can hold this thing in a few years for the same price I paid."
That's not an investment plan. That's hoping someone else will severely overpay. Sometimes it happens, but it's a bonus, not the backbone of a strategy.
CHMI still trades pretty close to our estimate for book value per share (about 95%). Better REITs trade at much cheaper price-to-book ratios. So, CHMI is a bad choice, despite that sucker 21.4% yield. Time for the next REIT.
Second Bad Choice for Yield
ARMOUR Residential (ARR) gets a coveted spot on the list. Well, maybe it isn't coveted. It is still a spot. Good enough.
ARR trades at 98% of our estimated book value. Should ARR trade at 98% of book value? Probably not. What does ARR's book value do? It goes down. Not every single quarter, but generally that's the case. What does ARR's dividend do? It goes down. I'm pretty sure everyone reading can already guess what happens to ARR's stock price over long periods. Say it with me: It goes down.
Seeking Alpha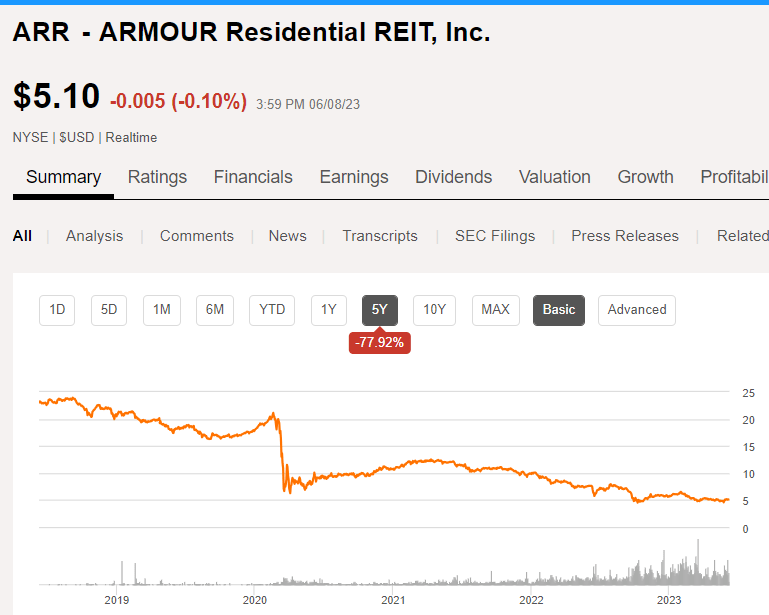
Not great.
While most mortgage REITs saw a large decline in share prices over the last year, in many cases the drop in share price was not matched by a drop in book value. However, when we tell you ARR trades at 98% of our recent estimate, you can infer that book value is also going down. ARR is currently paying out 18.3% on our estimate for book value.
Third Bad Choice for Yield
Now we're moving to the third REIT. This one is better than the other two, but I still don't like the valuation. I don't like it at all. AGNC Investment Corp. (AGNC) trades about 9% to 10% above our estimate for tangible book value per share. That is too high!
Among the mortgage REITs we track, AGNC is the only one trading above the estimated tangible book value per share. For comparison, Annaly Capital Management (NLY) trades at a slight discount. It wasn't all that long ago that NLY had a premium. However, NLY announced a dividend cut. It was earlier than we expected the announcement, but it was clear that a cut would occur.
AGNC has far less pressure to cut the dividend than CHMI or ARR. They could do it, but they're paying out 16.1% on estimated tangible book value. A year or two ago, that would've been much too high. However, it's not out-of-this-world insanity today. So what is the problem? First and foremost, the issue is that you absolutely should not pay about 109% of tangible book value for a mortgage REIT. The second issue is that earnings should come down significantly over the next few years. Consensus estimates for forward core earnings are coming in at $2.48. That would be about 25% of book value. You don't even have to go into the presentation to say that won't last indefinitely.
You can buy MBS at a 5.5% yield today. The 30-year fixed-rate agency MBS with a 5.5% coupon is selling at $100.03 per $100.00 of par value. That's a rounding error. So the mREITs can get a good yield going on their assets. You can use hedges to lock in a lower rate today (rather than waiting for the Federal Reserve to cut rates). However, you're still taking on some risk of interest rates changing. So you can leverage up to earn a respectable net interest spread (while using hedges to limit current interest expense). You could hedge and hit that 16% or so. But you won't hit 25%. That's not a realistic scenario. You can only get to 25% by having some interest rate swaps left over from when rates were under 1%.
Think AGNC might have those?
AGNC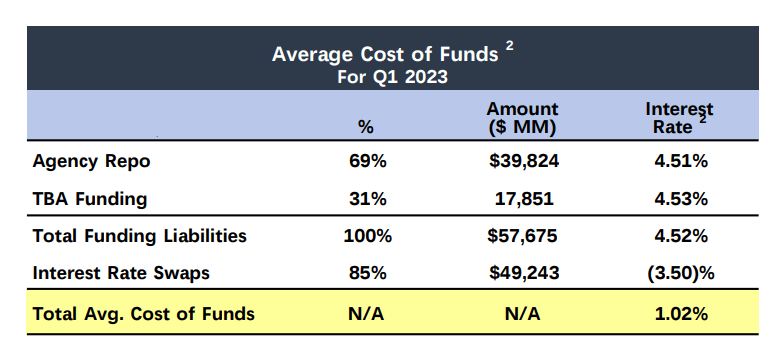
There you go. There's your nice low cost of funds. That's how you get the big net interest income. The gains are already factored into book value, but the market loves to see "earnings". That's why AGNC is trading about 9% over tangible book value and Dynex Capital (DX) is trading about 8% below book value. The hedging strategy DX used doesn't flow through net interest income, so it doesn't get into the core earnings calculation. Consequently, AGNC reports huge core earnings and DX reports very low core earnings. They are not that different. But the market is paying a significant difference because the investors get to see the hedging value flow through the line item where they want to see it. DX is a cheaper alternative to AGNC. The dividend yield is 13% instead of 14.8%, but DX is a better alternative to AGNC. Not necessarily cheap, but .92 is much better than 1.09.
Benefits in Book Value
This is an important concept. The value of those hedges is already factored into book value. Each dollar the REIT will save based on current forward rates is already factored into book value.
As the REIT saves $1 million on net interest expense through their swaps, the unrealized gain is projected to fall by $1 million. The actual shift in values will also include the change in interest rates over the period. However, the base scenario is that $1 million of unrealized gains turns into realized gains through net interest expense (a reduction in the expense). If the REIT paid out that $1 million in dividends, book value is down by $1 million.
The cash savings are real, but they are already factored in. Many investors make the mistake of counting them as if they were a perpetual source of savings. That leads to bad decisions.
There is nothing wrong with the way the REITs are presenting information. They are not committing any crimes. The numbers are there for anyone to read. Challenge is that most people just can't read them.
Before getting into the charts, I want to mention that the earnings yield for EFC came back as 0% because the consensus estimate for Core EPS isn't showing up. It's not actually 0%. NYMT and PMT don't report core earnings, so they have 0 there. DX shows a negative earnings yield because the calculations don't adjust for the way DX hedges.
Stock Table
We will close out the rest of the article with the tables and charts we provide for readers to help them track the sector for both common shares and preferred shares.
We're including a quick table for the common shares that will be shown in our tables:
Type of REIT or BDC | ||||
Residential Agency | Residential Hybrid | Residential Originator and Servicer | Commercial | BDC |
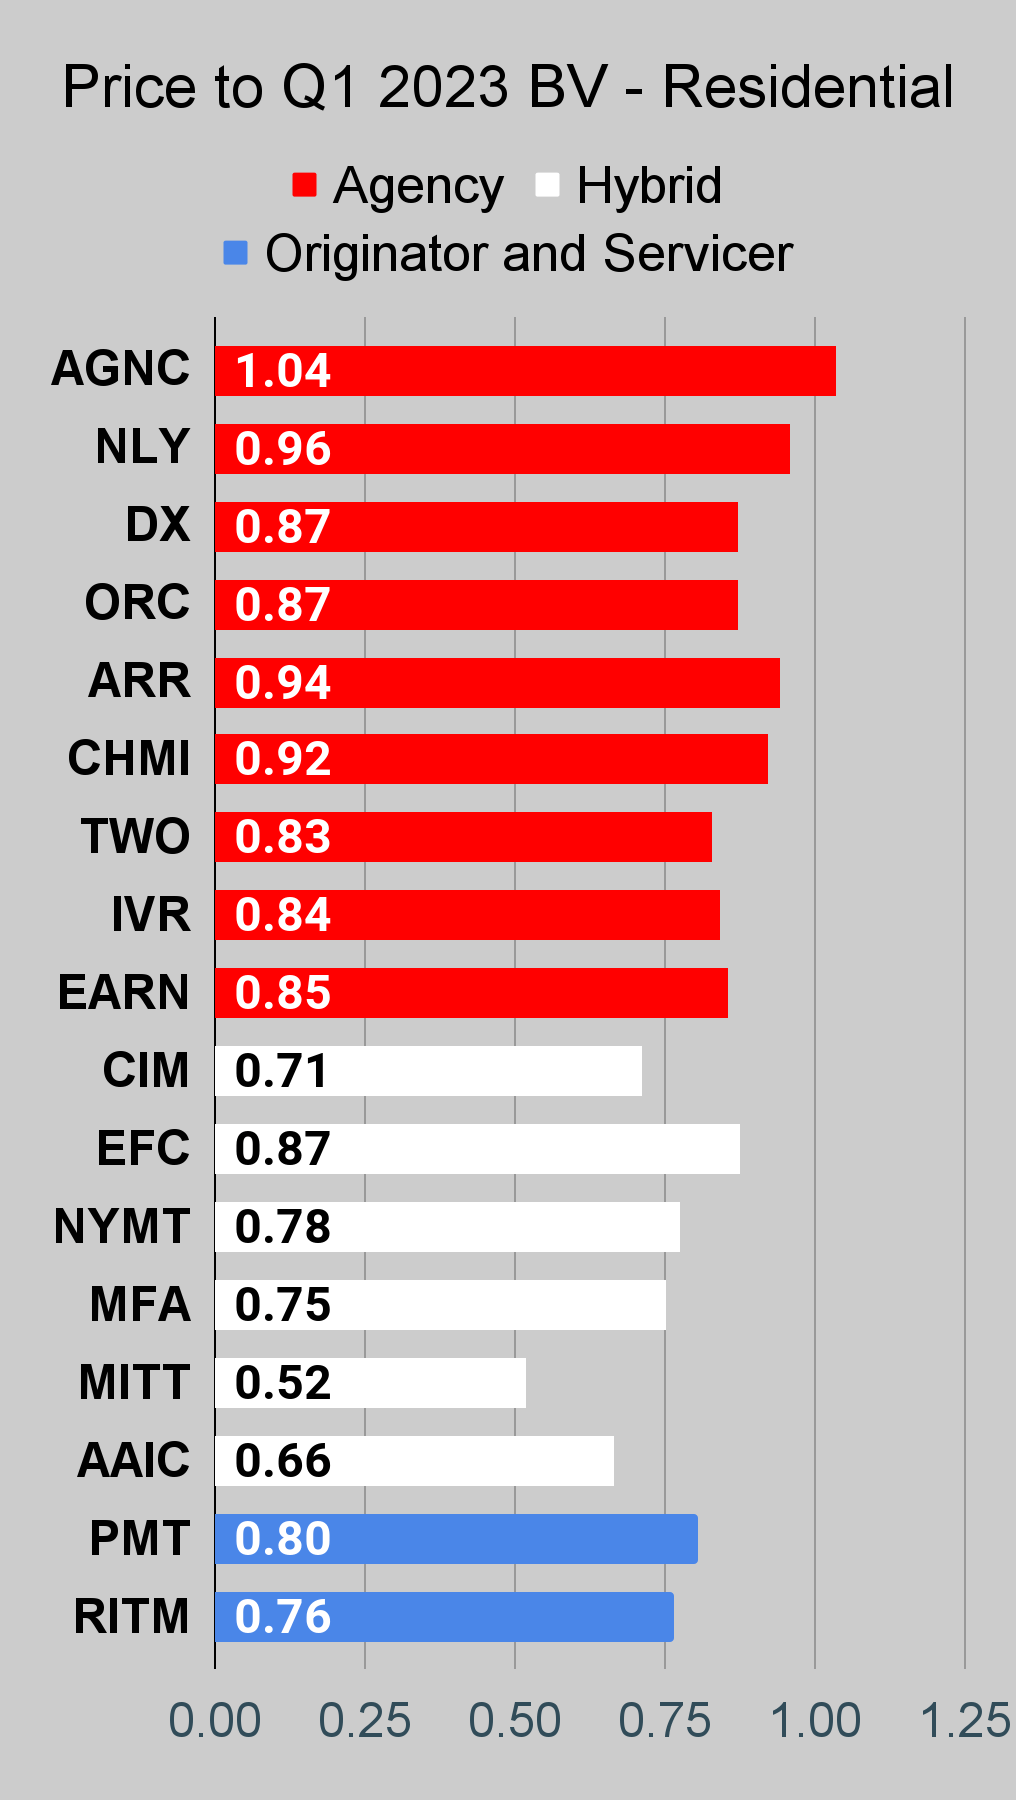
If you're looking for a stock and I haven't mentioned it yet, you'll still find it in the charts below. The charts contain comparisons based on price-to-book value, dividend yields, and earnings yield. You won't find these tables anywhere else.
For mortgage REITs, please look at the charts for AGNC, NLY, DX, ORC, ARR, CHMI, TWO, IVR, EARN, CIM, EFC, NYMT, MFA, MITT, AAIC, PMT, RITM, BXMT, GPMT, WMC, and RC.
For BDCs, please look at the charts for MAIN, CSWC, ARCC, TSLX, TPVG, OCSL, GAIN, GBDC, SLRC, ORCC, PFLT, TCPC, FSK, PSEC, and MFIC.
This series is the easiest place to find charts providing up-to-date comparisons across the sector.
Residential Mortgage REIT Charts
Note: The chart for our public articles uses the book value per share from the latest earnings release. Current estimated book value per share is used in reaching our targets and trading decisions. It is available in our service, but those estimates are not included in the charts below. PMT and NYMT are not showing an earnings yield metric as neither REIT provides a quarterly "Core EPS" metric.
Second Note: Due to the way historical amortized cost and hedging is factored into the earnings metrics, it is possible for two mortgage REITs with similar portfolios to post materially different metrics for earnings. I would be very cautious about putting much emphasis on the consensus analyst estimate (which is used to determine the earnings yield). In particular, throughout late 2022 the earnings metric became less comparable for many REITs.
 The REIT Forum | 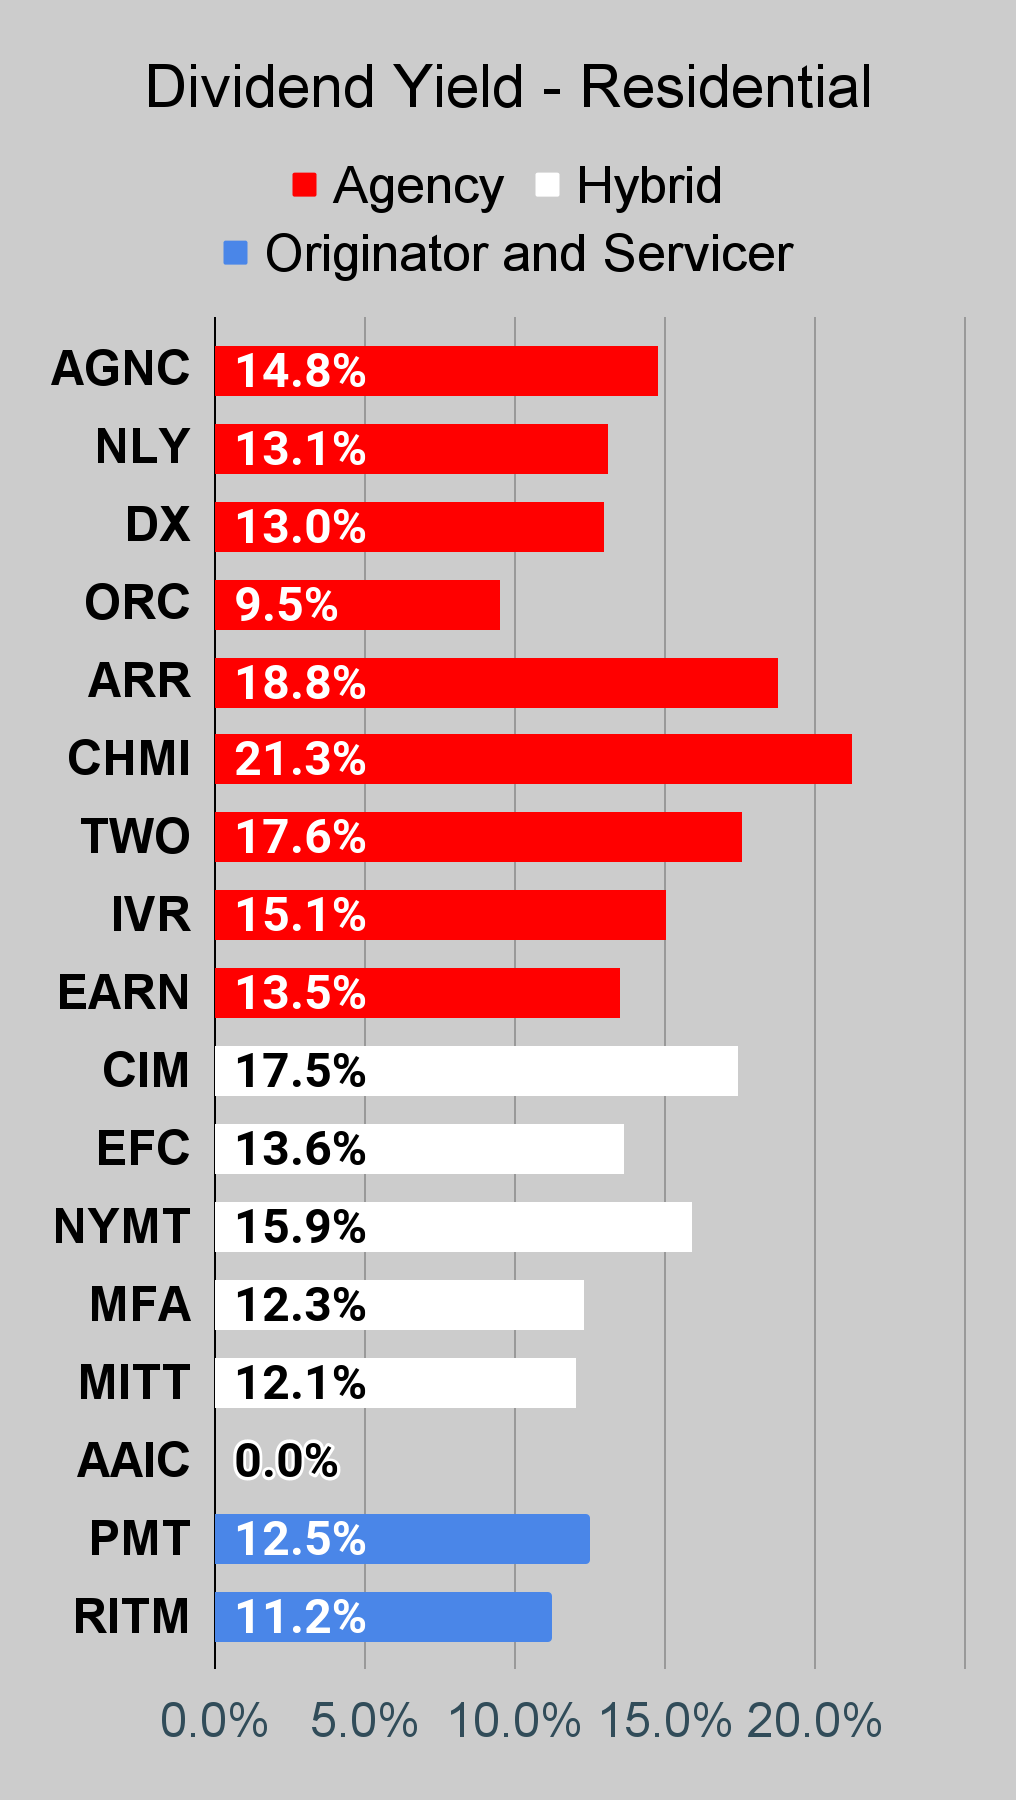 The REIT Forum | 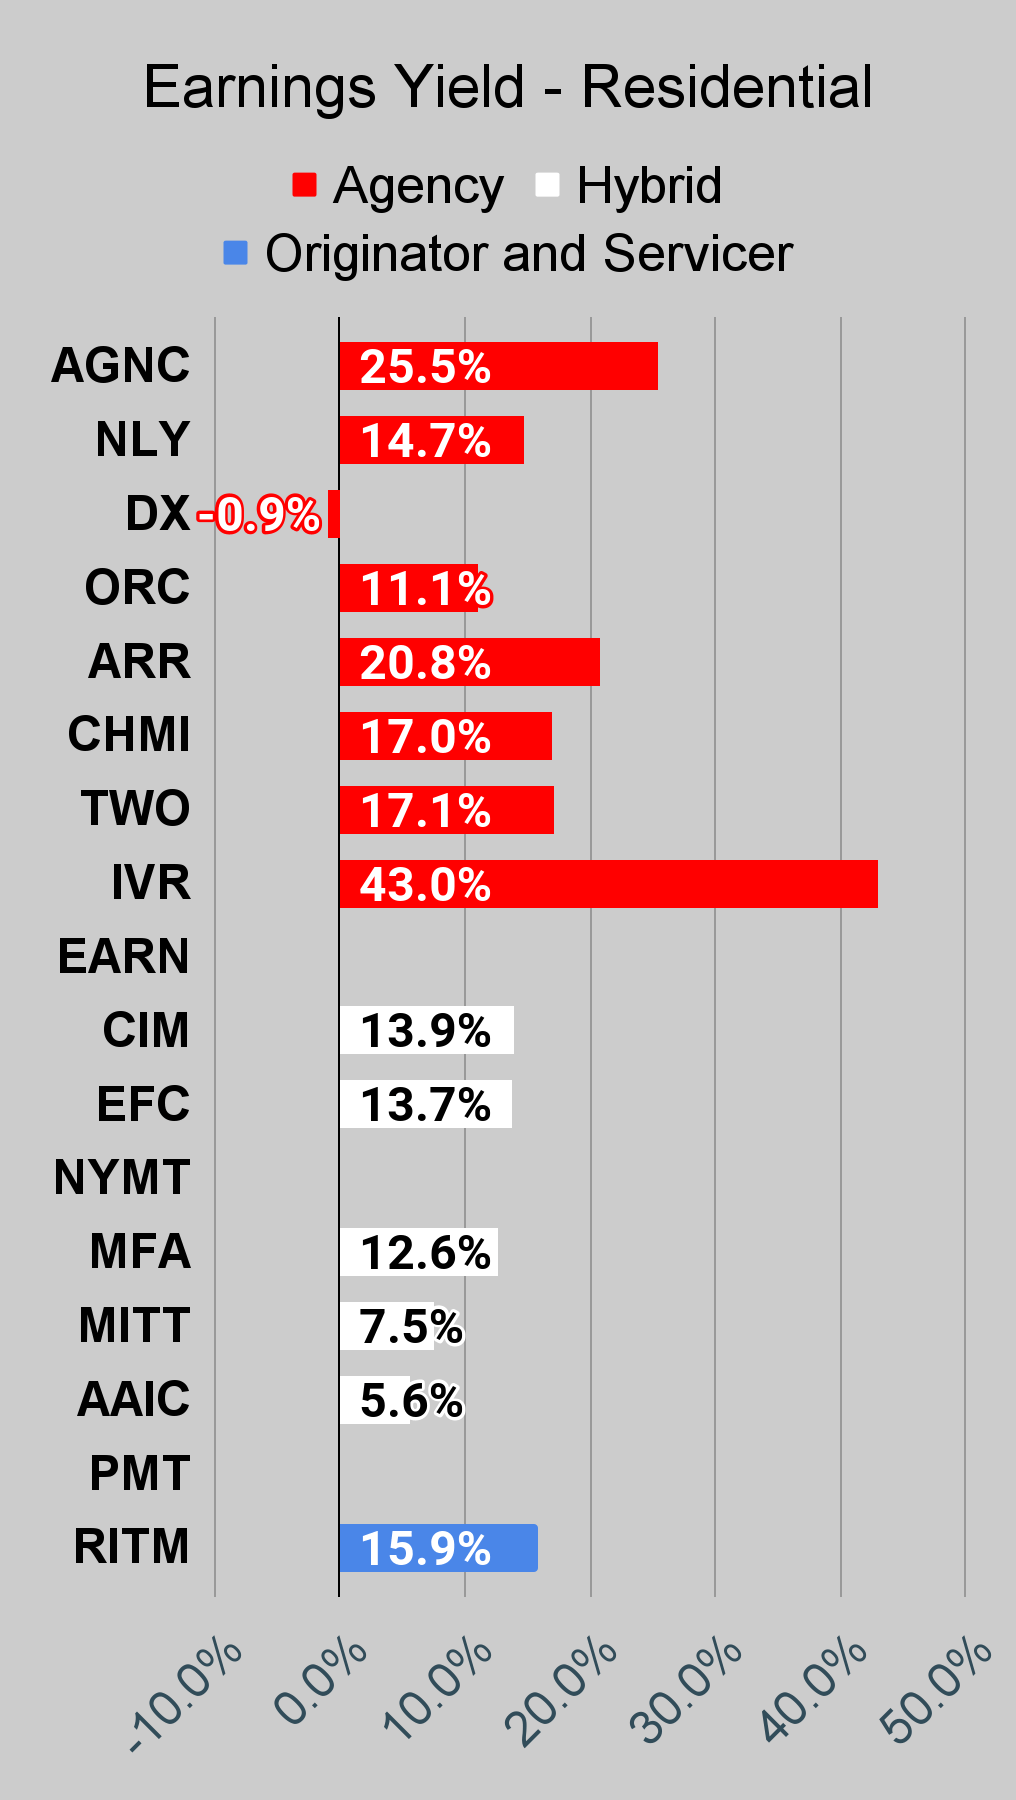 The REIT Forum |
Commercial Mortgage REIT Charts
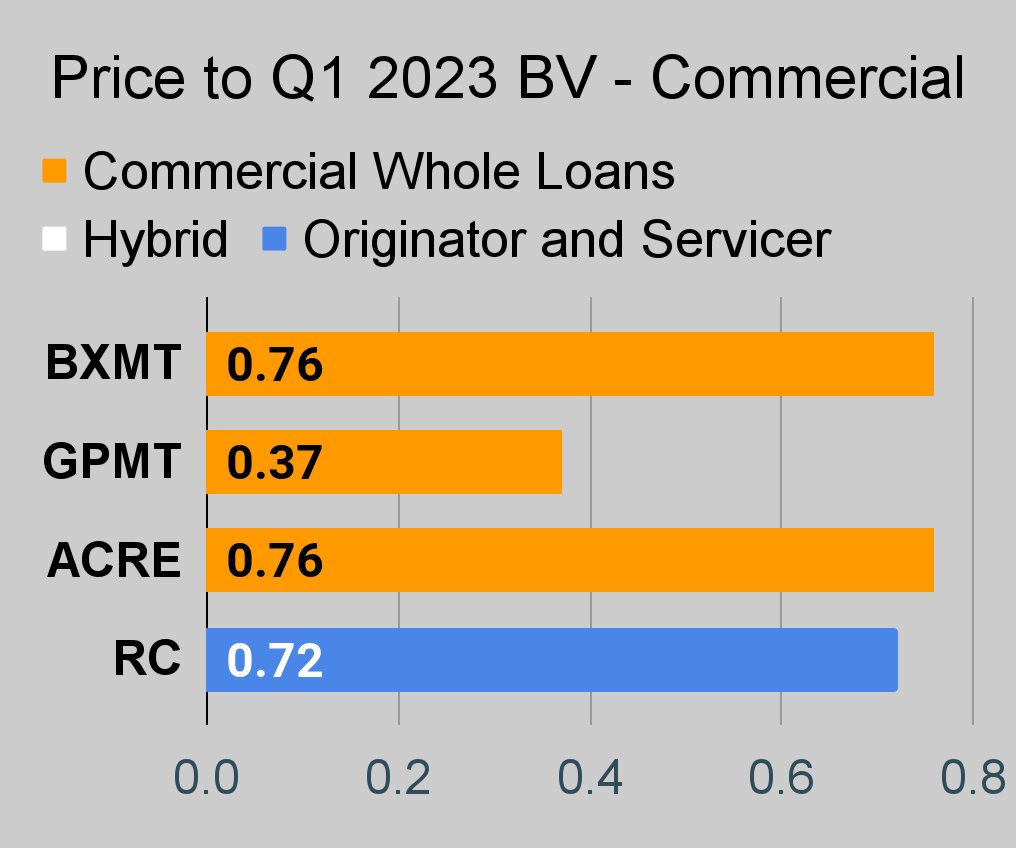 The REIT Forum | 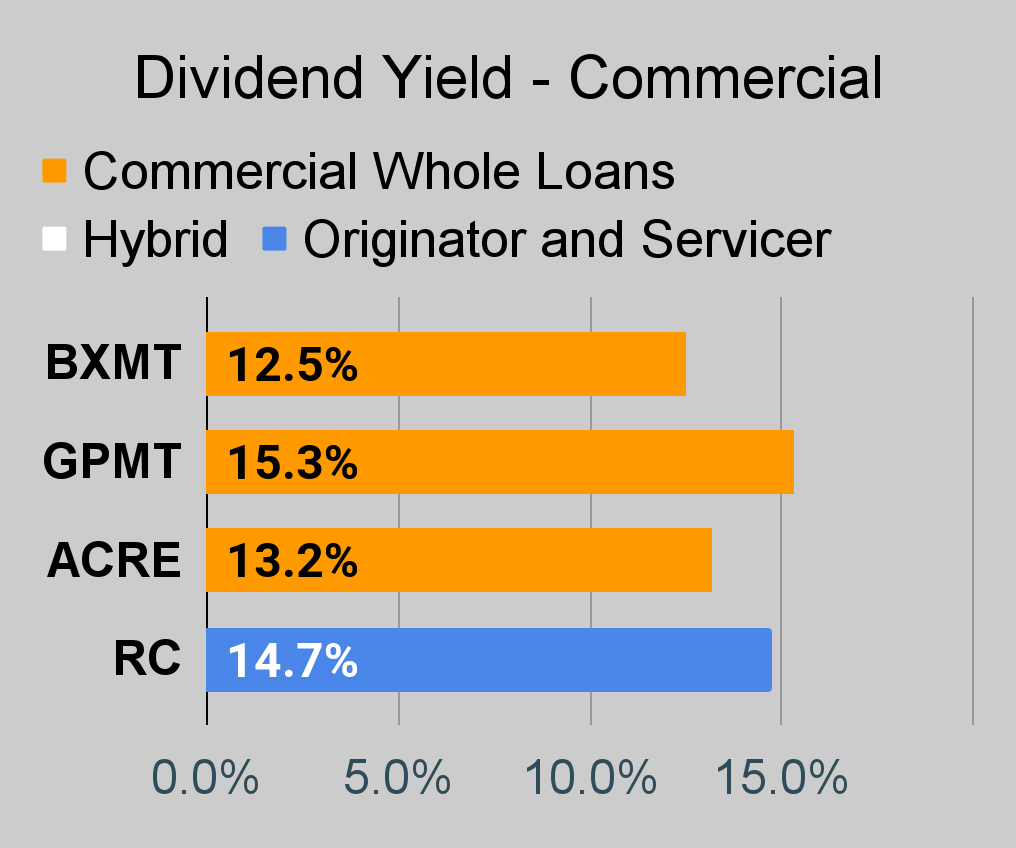 The REIT Forum | 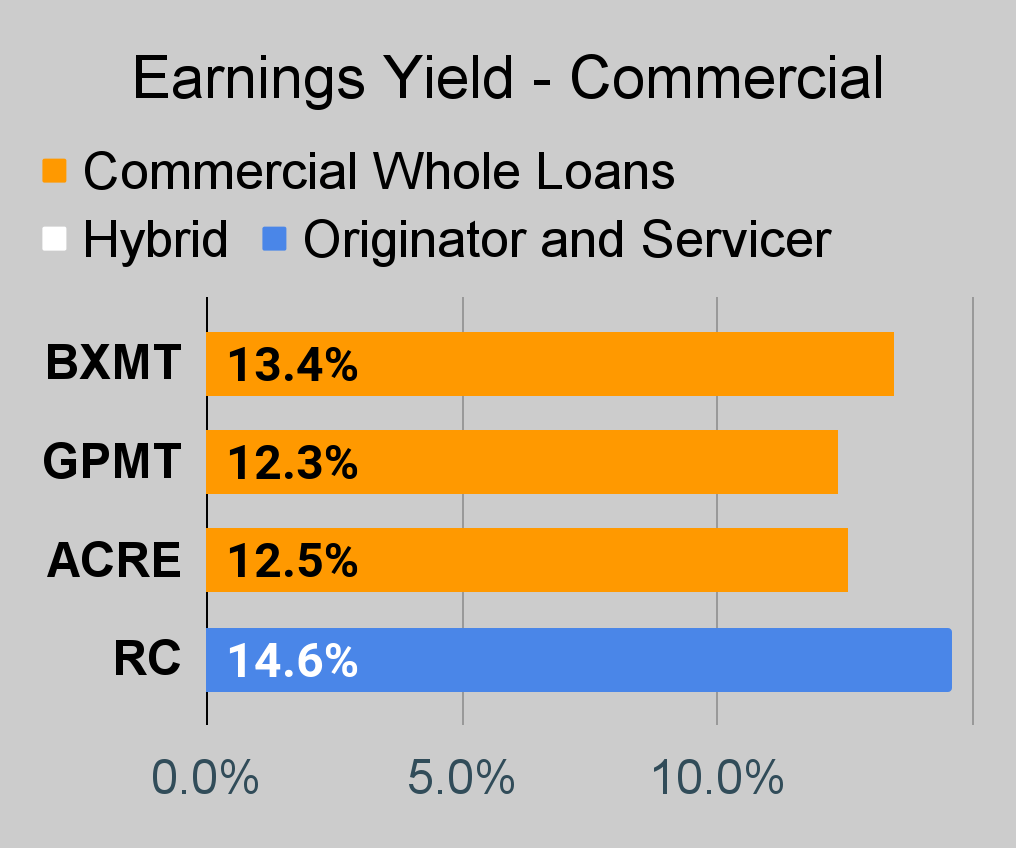 The REIT Forum |
BDC Charts
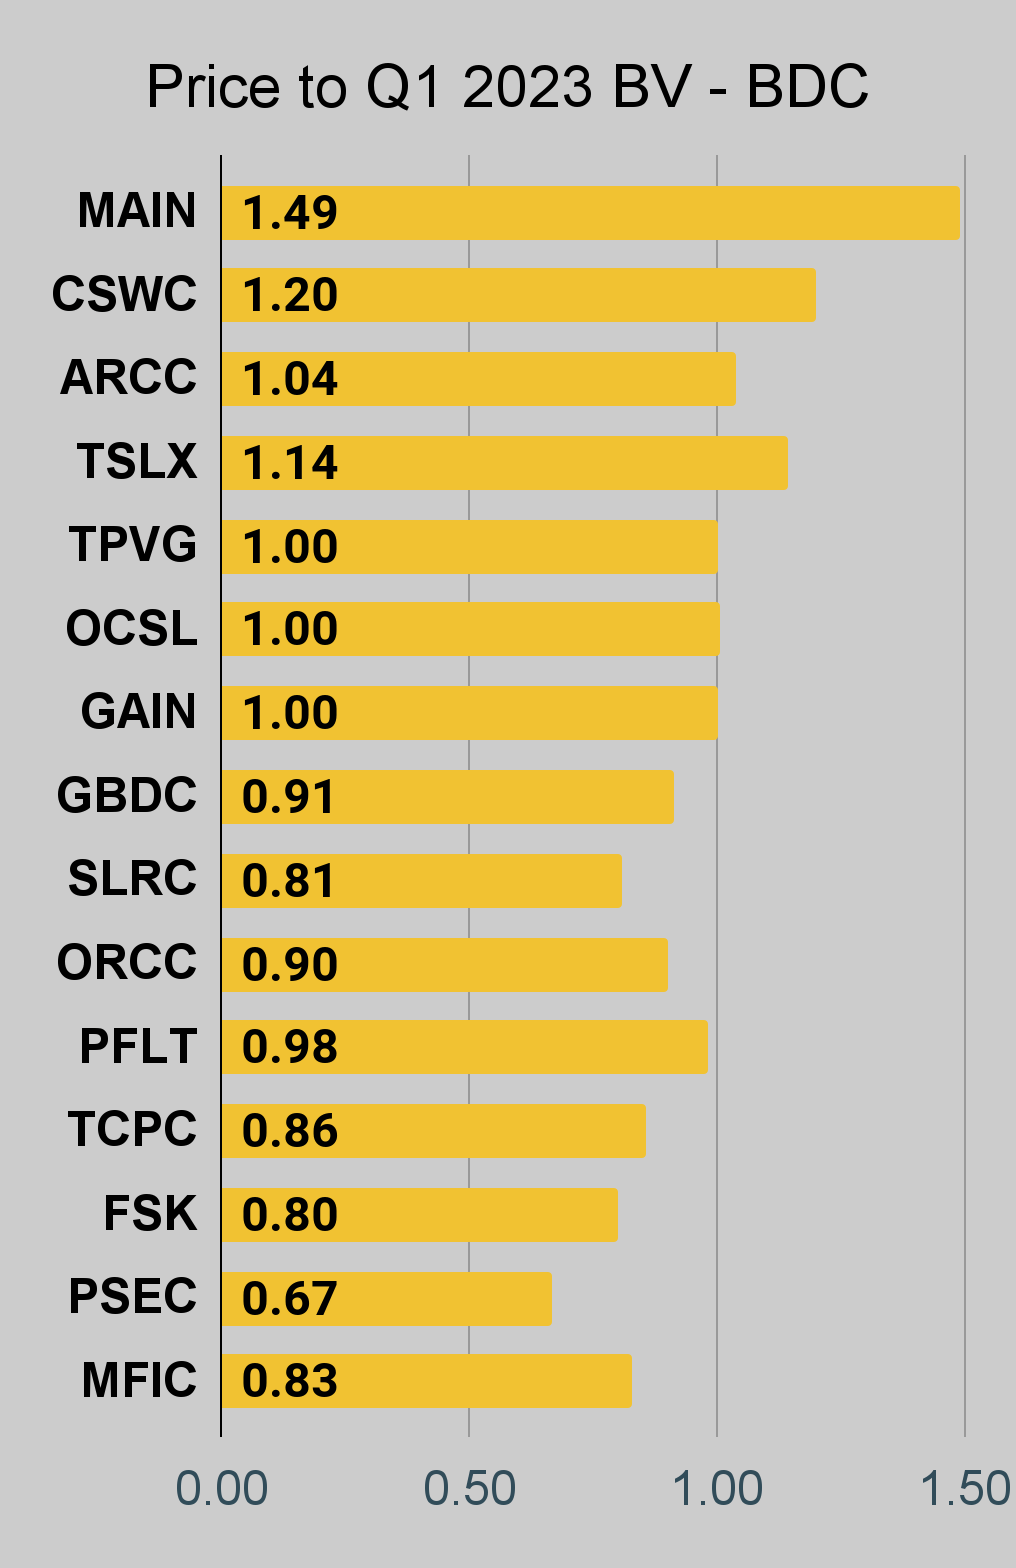 The REIT Forum |  The REIT Forum | 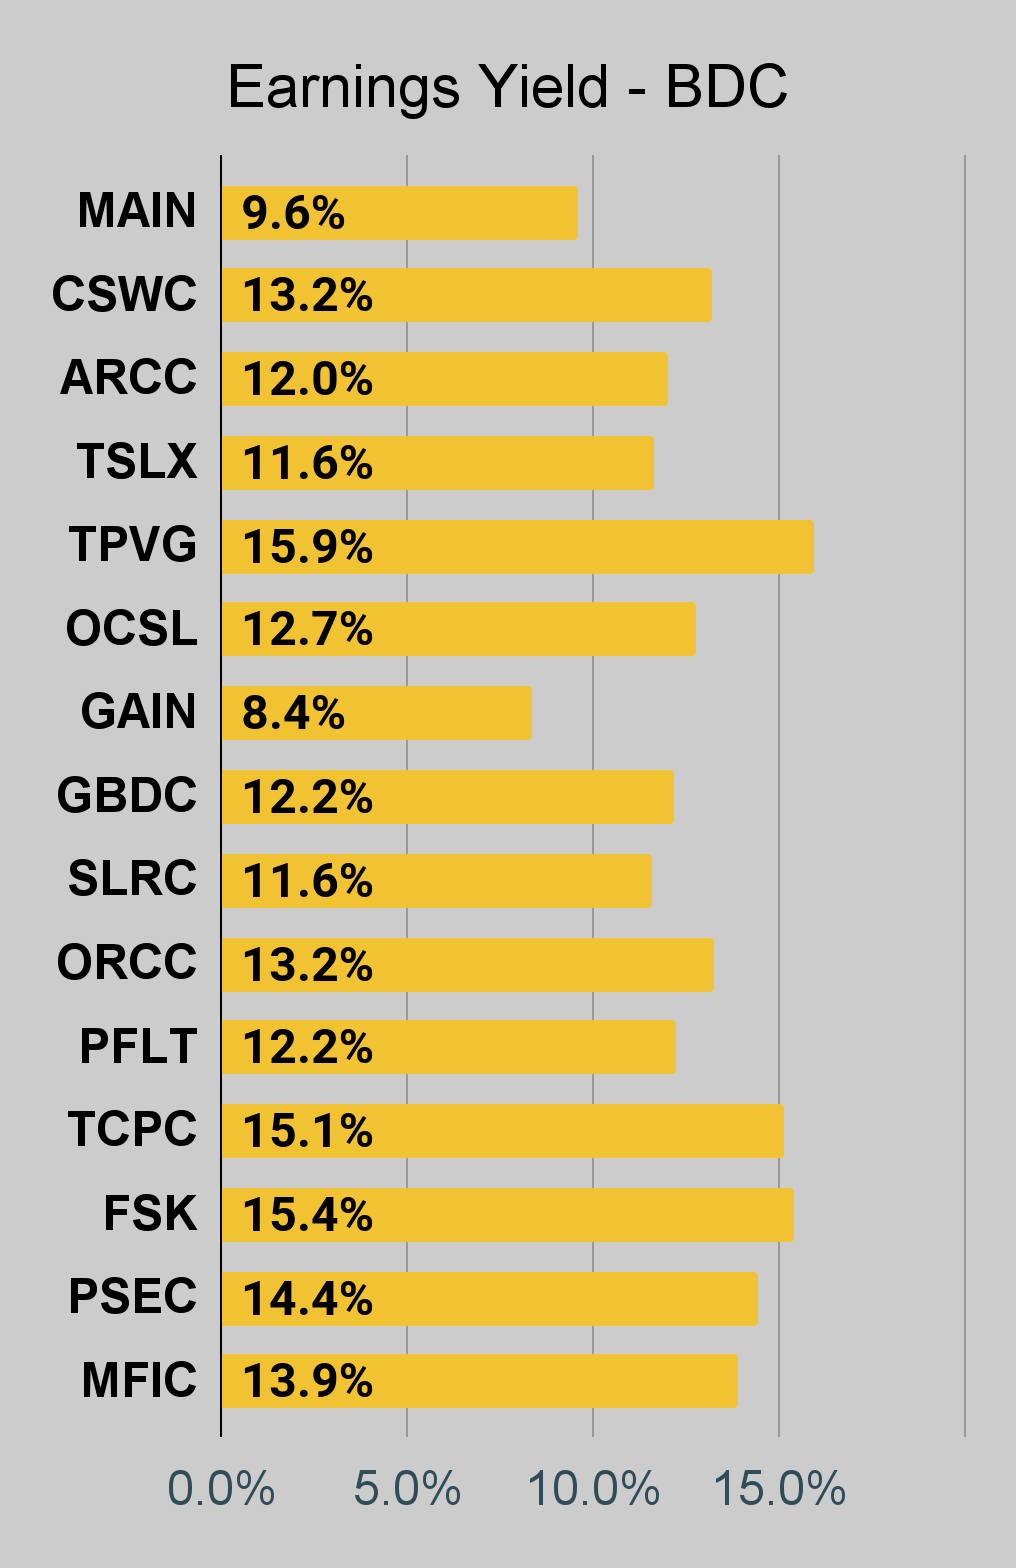 The REIT Forum |
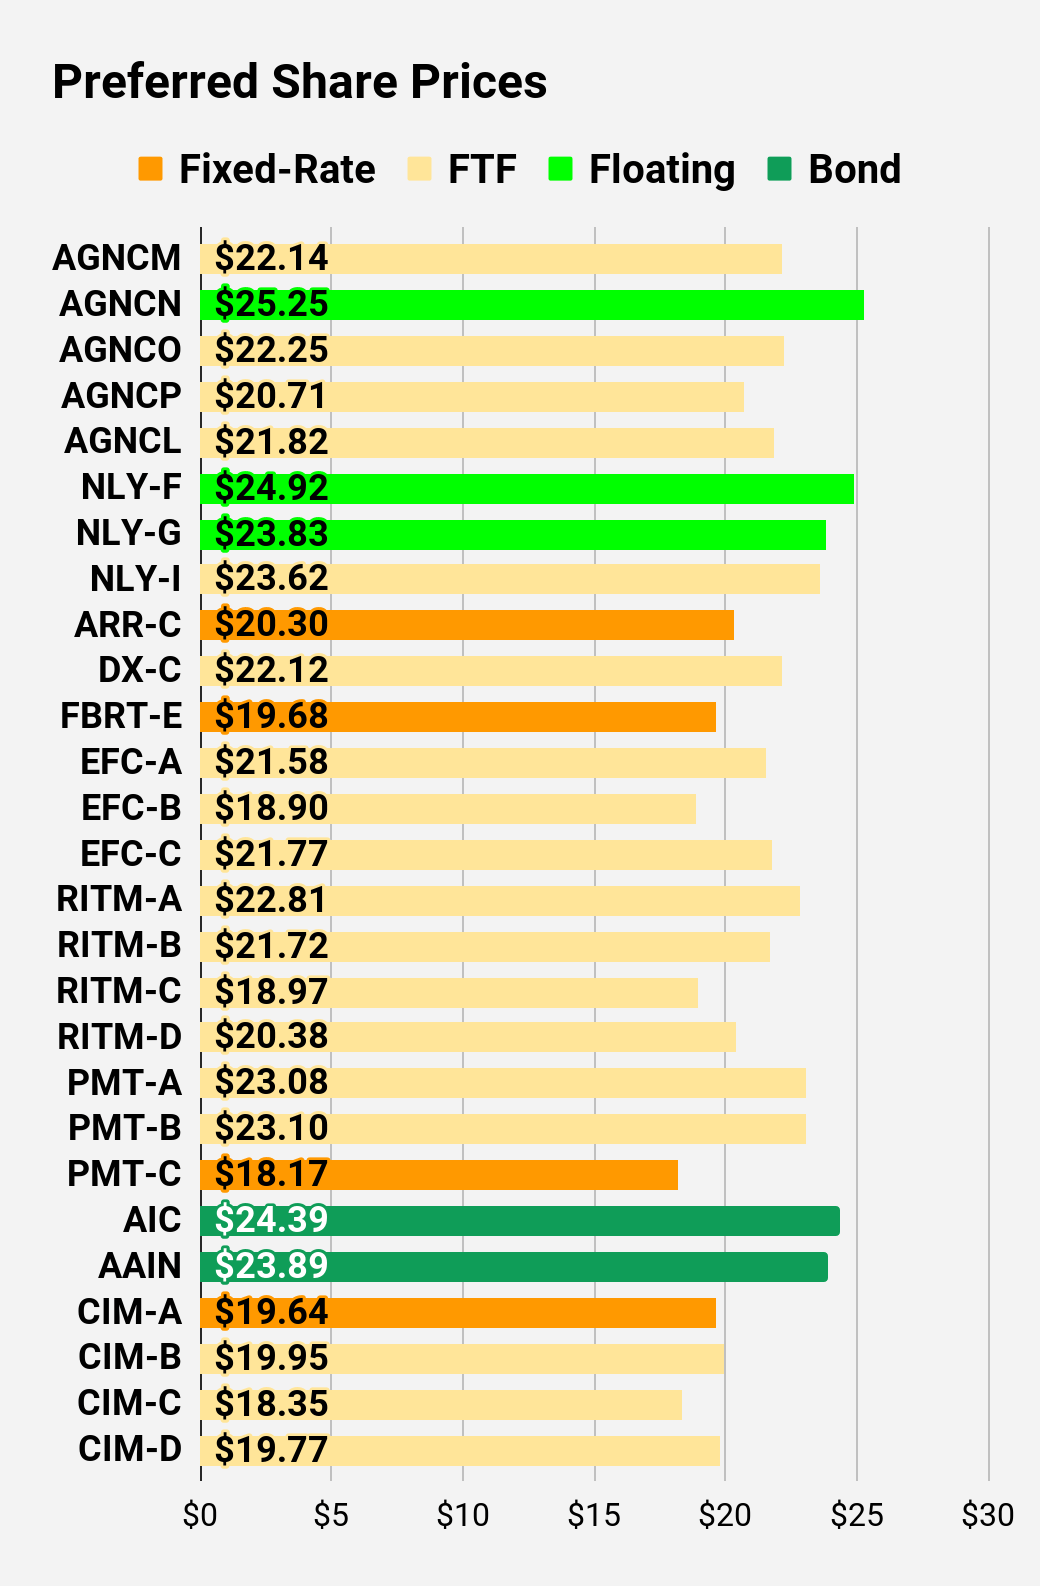
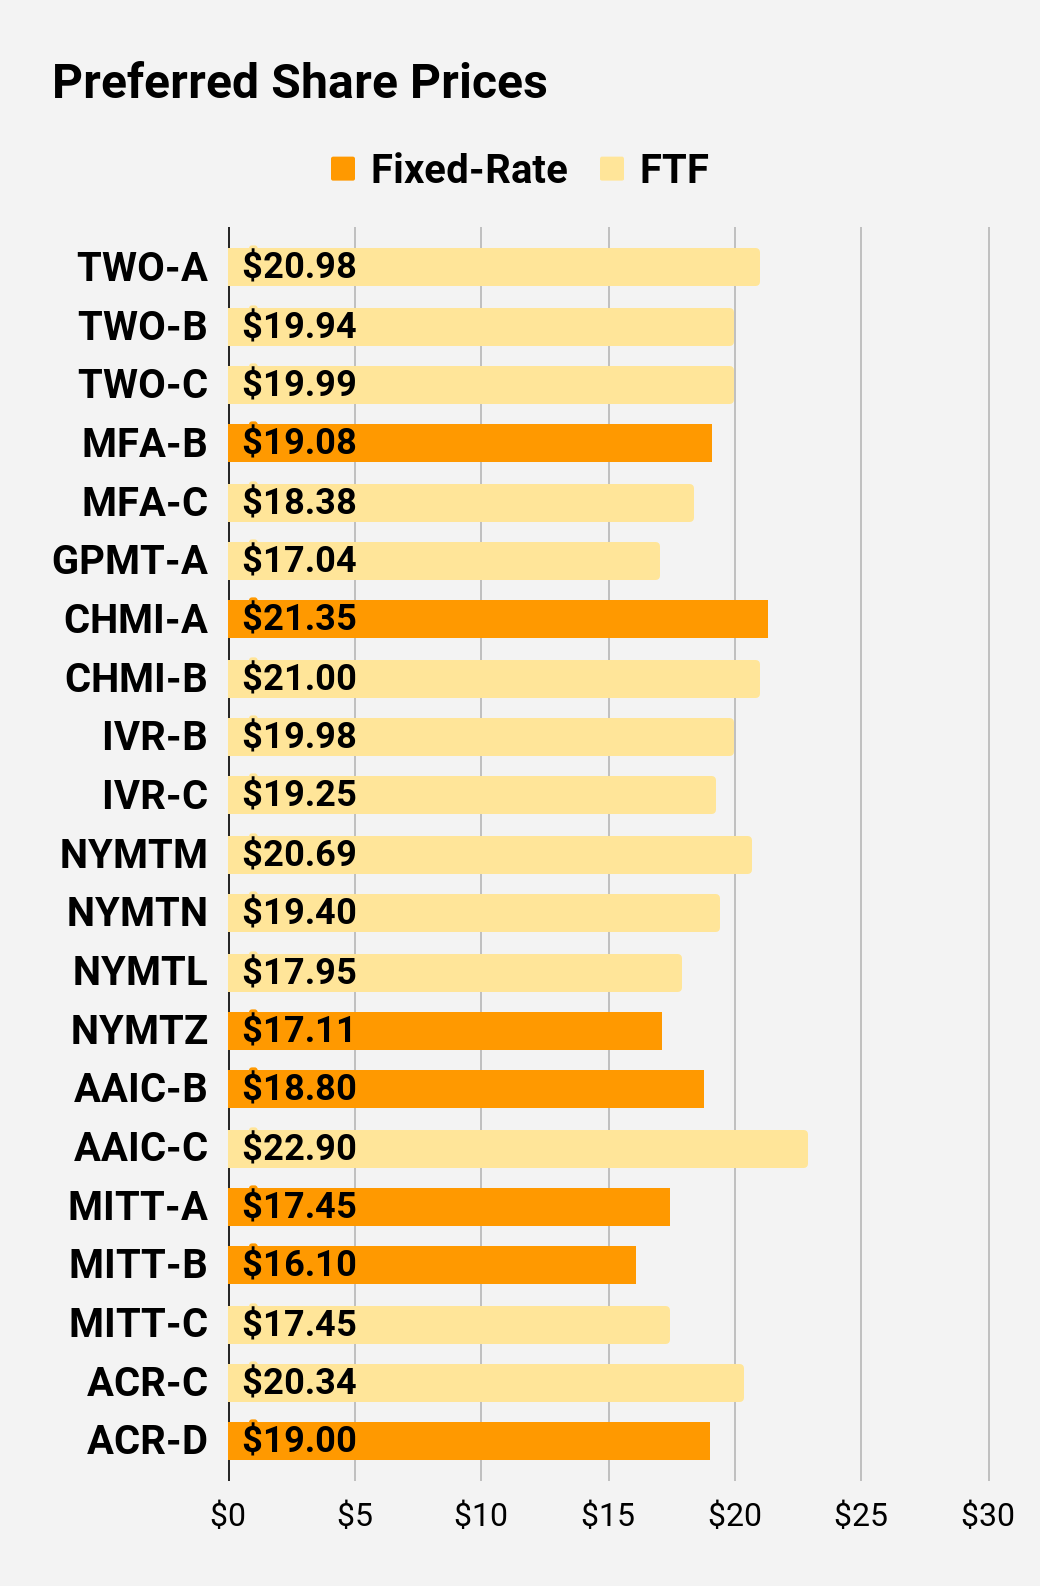
Preferred Share Charts
I changed the coloring a bit. We needed to adjust to include that the first fixed-to-floating shares have transitioned over to floating rates. When a share is already floating, the stripped yield may be different from the "Floating Yield on Price" due to changes in interest rates. For instance, NLY-F already has a floating rate. However, the rate is only reset once per 3 months. The stripped yield is calculated using the upcoming projected dividend payment and the "Floating Yield on Price" is based on where the dividend would be if the rate reset today. In my opinion, for these shares the "Floating Yield on Price" is clearly the more important metric.
 The REIT Forum | 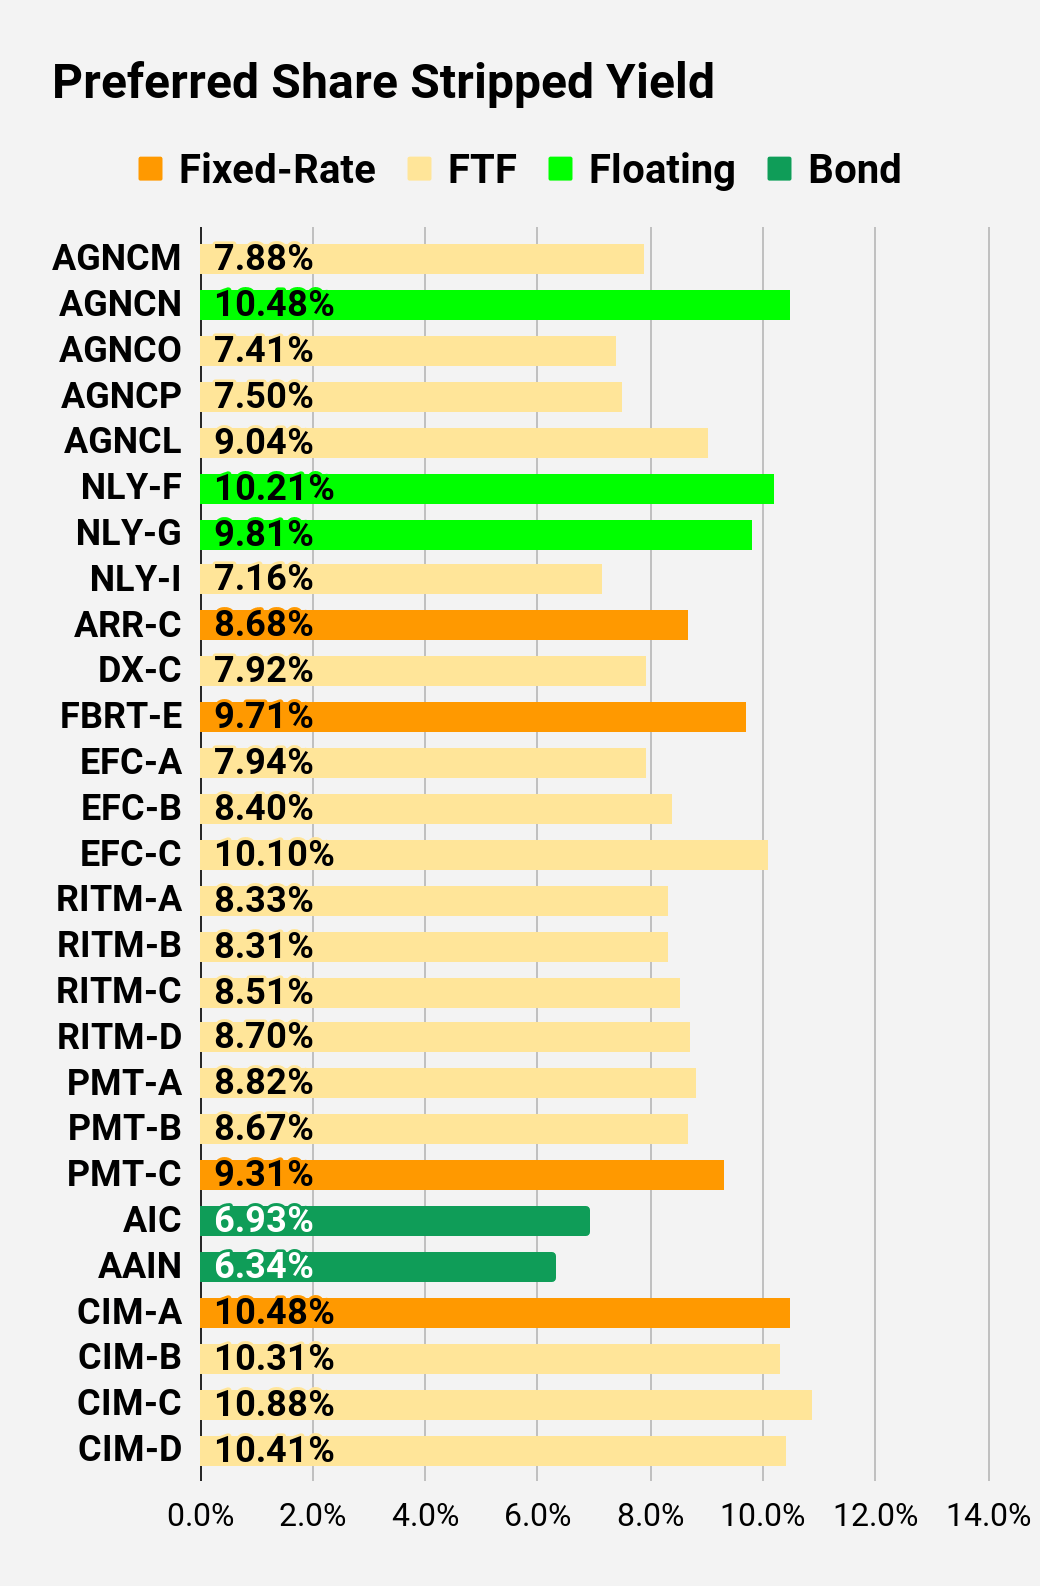 The REIT Forum | 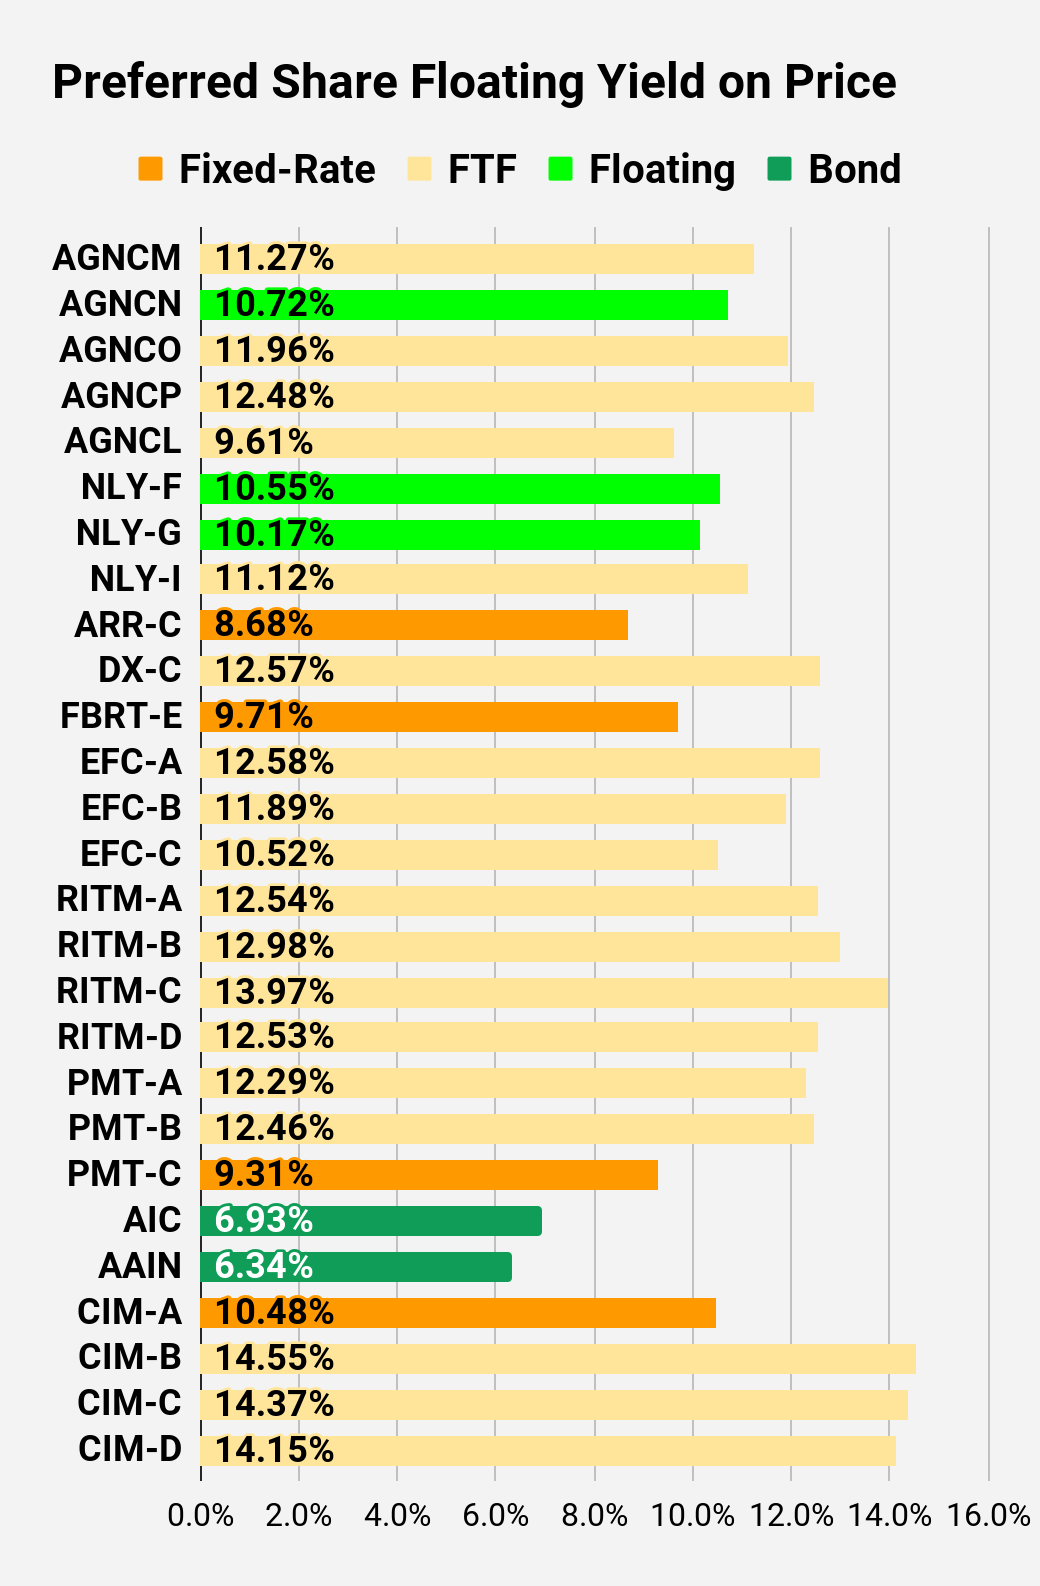 The REIT Forum |
 The REIT Forum | 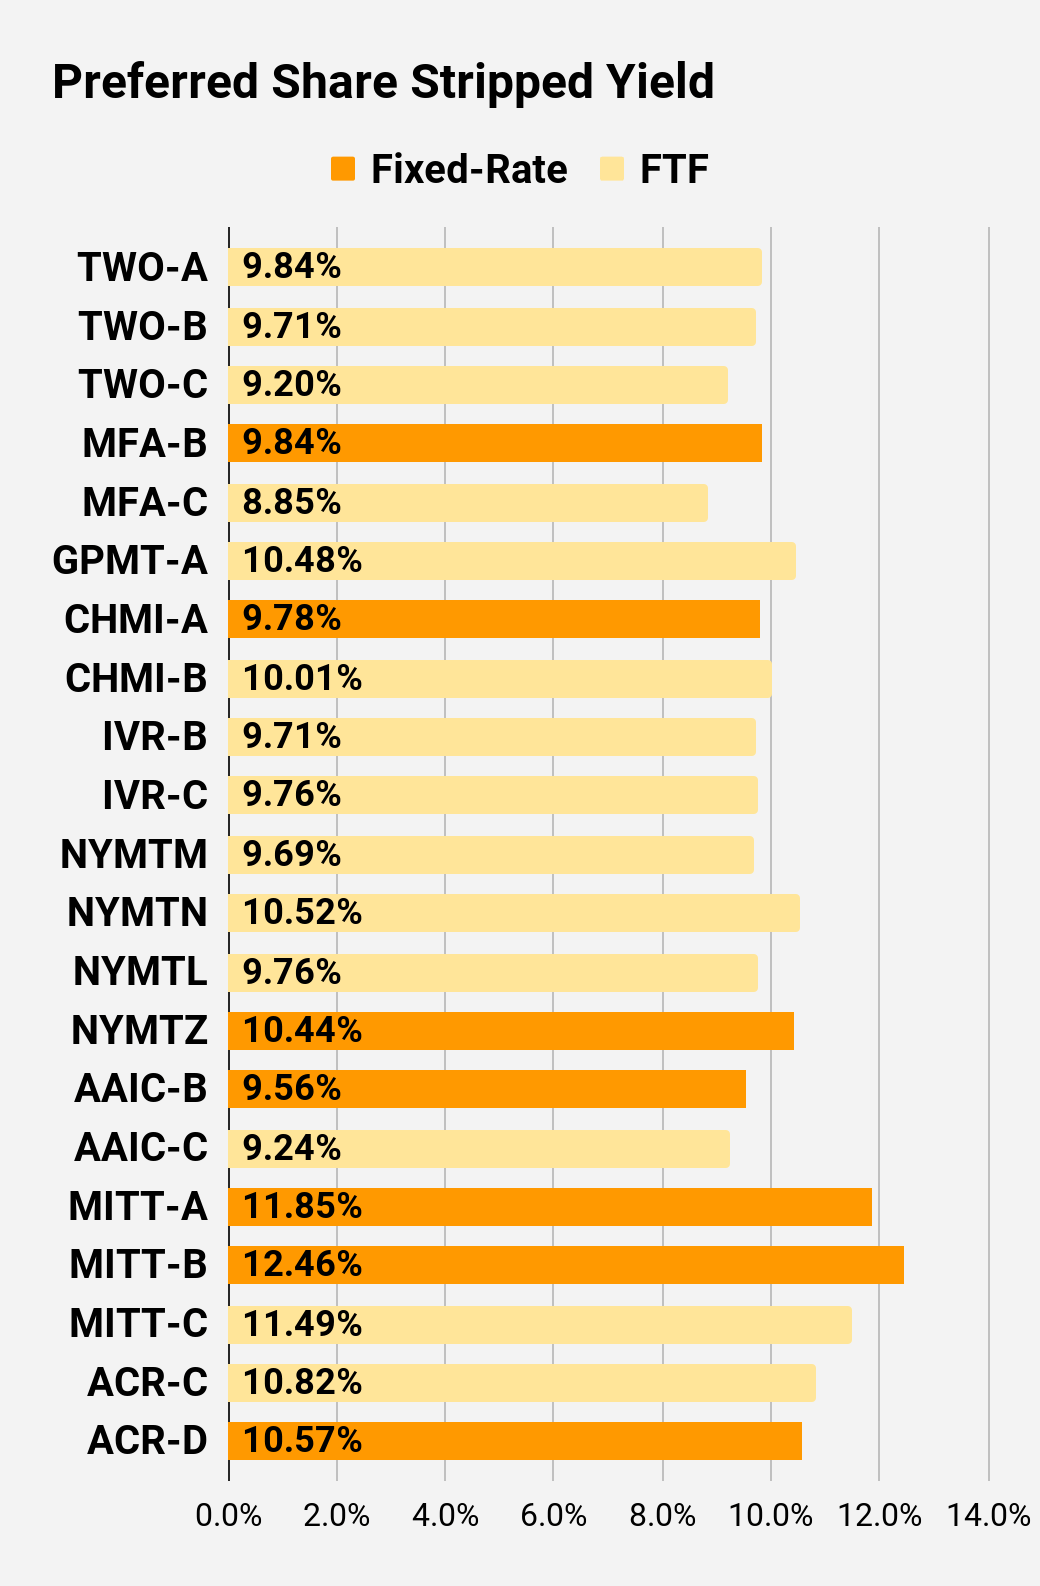 The REIT Forum | 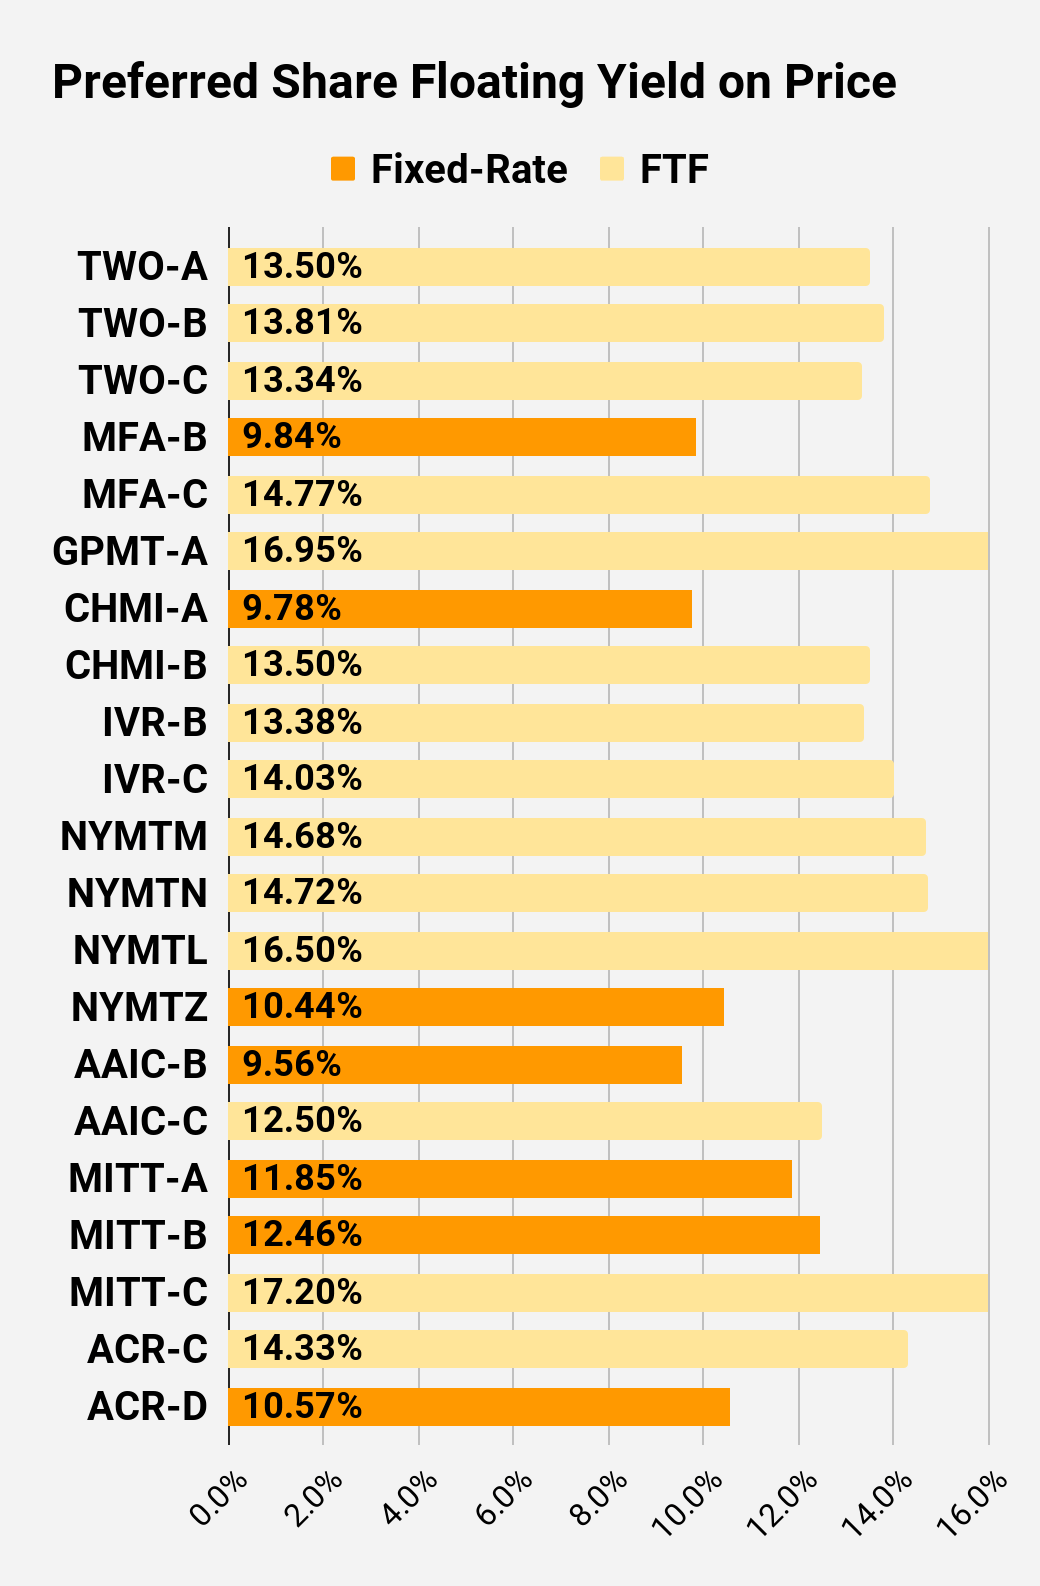 The REIT Forum |
Preferred Share Data
Beyond the charts, we're also providing our readers with access to several other metrics for the preferred shares.
After testing out a series on preferred shares, we decided to try merging it into the series on common shares. After all, we are still talking about positions in mortgage REITs. We don't have any desire to cover preferred shares without cumulative dividends, so any preferred shares you see in our column will have cumulative dividends. You can verify that by using Quantum Online. We've included the links in the table below.
To better organize the table, we needed to abbreviate column names as follows:
- Price = Recent Share Price - Shown in Charts
- BoF = Bond or FTF (Fixed-to-Floating)
- S-Yield = Stripped Yield - Shown in Charts
- Coupon = Initial Fixed-Rate Coupon
- FYoP = Floating Yield on Price - Shown in Charts
- NCD = Next Call Date (the soonest shares could be called)
- Note: For all FTF issues, the floating rate would start on NCD.
- WCC = Worst Cash to Call (lowest net cash return possible from a call)
- QO Link = Link to Quantum Online Page
Ticker | Price | BoF | S-Yield | Coupon | FYoP | NCD | WCC | QO Link | P-Link |
$22.14 | FTF | 7.88% | 6.88% | 11.27% | 4/15/2024 | $4.59 | |||
$25.25 | Floating | 10.48% | 10.37% | 10.72% | 7/8/2023 | $0.36 | |||
$22.25 | FTF | 7.41% | 6.50% | 11.96% | 10/15/2024 | $5.20 | |||
$20.71 | FTF | 7.50% | 6.13% | 12.48% | 4/15/2025 | $7.36 | |||
$21.82 | FTF | 9.04% | 7.75% | 9.61% | 10/15/2027 | $11.92 | |||
$24.92 | Floating | 10.21% | 10.15% | 10.55% | 7/8/2023 | $0.13 | |||
$23.83 | Floating | 9.81% | 9.33% | 10.17% | 7/8/2023 | $1.22 | |||
$23.62 | FTF | 7.16% | 6.75% | 11.12% | 6/30/2024 | $3.07 | |||
$20.30 | 8.68% | 7.00% | 8.68% | 1/28/2025 | $7.64 | ||||
$22.12 | FTF | 7.92% | 6.90% | 12.57% | 4/15/2025 | $6.33 | |||
$19.68 | 9.71% | 7.50% | 9.71% | 7/8/2023 | $5.75 | ||||
$21.58 | FTF | 7.94% | 6.75% | 12.58% | 10/30/2024 | $5.97 | |||
$18.90 | FTF | 8.40% | 6.25% | 11.89% | 1/30/2027 | $11.98 | |||
$21.77 | FTF | 10.10% | 8.63% | 10.52% | 4/30/2028 | $14.03 | |||
$22.81 | FTF | 8.33% | 7.50% | 12.54% | 8/15/2024 | $4.55 | |||
$21.72 | FTF | 8.31% | 7.13% | 12.98% | 8/15/2024 | $5.53 | |||
$18.97 | FTF | 8.51% | 6.38% | 13.97% | 2/15/2025 | $8.84 | |||
$20.38 | FTF | 8.70% | 7.00% | 12.53% | 11/15/2026 | $10.77 | |||
$23.08 | FTF | 8.82% | 8.13% | 12.29% | 3/15/2024 | $3.44 | |||
$23.10 | FTF | 8.67% | 8.00% | 12.46% | 6/15/2024 | $3.90 | |||
$18.17 | 9.31% | 6.75% | 9.31% | 8/24/2026 | $12.22 | ||||
$24.39 | Bond | 6.93% | 6.75% | 6.93% | 7/8/2023 | $0.70 | |||
$23.89 | Bond | 6.34% | 6.00% | 6.34% | 8/1/2023 | $1.49 | |||
$19.64 | 10.48% | 8.00% | 10.48% | 7/8/2023 | $6.00 | ||||
$19.95 | FTF | 10.31% | 8.00% | 14.55% | 3/30/2024 | $7.14 | |||
$18.35 | FTF | 10.88% | 7.75% | 14.37% | 9/30/2025 | $11.59 | |||
$19.77 | FTF | 10.41% | 8.00% | 14.15% | 03/30/2024 | $7.32 |
Second Batch:
Ticker | Price | BoF | S-Yield | Coupon | FYoP | NCD | WCC | QO Link | P-Link |
$20.98 | FTF | 9.84% | 8.13% | 13.50% | 04/27/2027 | $12.15 | |||
$19.94 | FTF | 9.71% | 7.63% | 13.81% | 07/27/2027 | $13.16 | |||
$19.99 | FTF | 9.20% | 7.25% | 13.34% | 1/27/2025 | $8.19 | |||
$19.08 | 9.84% | 7.50% | 9.84% | 7/8/2023 | $5.96 | ||||
$18.38 | FTF | 8.85% | 6.50% | 14.77% | 3/31/2025 | $9.47 | |||
$17.04 | FTF | 10.48% | 7.00% | 16.95% | 11/30/2026 | $14.30 | |||
$21.35 | 9.78% | 8.20% | 9.78% | 7/8/2023 | $4.05 | ||||
$21.00 | FTF | 10.01% | 8.25% | 13.50% | 4/15/2024 | $5.99 | |||
$19.98 | FTF | 9.71% | 7.75% | 13.38% | 12/27/2024 | $7.95 | |||
$19.25 | FTF | 9.76% | 7.50% | 14.03% | 9/27/2027 | $13.74 | |||
$20.69 | FTF | 9.69% | 7.88% | 14.68% | 1/15/2025 | $7.77 | |||
$19.40 | FTF | 10.52% | 8.00% | 14.72% | 10/15/2027 | $14.61 | |||
$17.95 | FTF | 9.76% | 6.88% | 16.50% | 10/15/2026 | $13.07 | |||
$17.11 | 10.44% | 7.00% | 10.44% | 1/15/2027 | $14.46 | ||||
$18.80 | 9.56% | 7.00% | 9.56% | 7/8/2023 | $6.68 | ||||
$22.90 | FTF | 9.24% | 8.25% | 12.50% | 3/30/2024 | $4.17 | |||
$17.45 | 11.85% | 8.25% | 11.85% | 7/8/2023 | $7.63 | ||||
$16.10 | 12.46% | 8.00% | 12.46% | 7/8/2023 | $8.98 | ||||
$17.45 | FTF | 11.49% | 8.00% | 17.20% | 9/17/2024 | $10.02 | |||
$20.34 | FTF | 10.82% | 8.63% | 14.33% | 7/30/2024 | $7.36 | |||
$19.00 | 10.57% | 7.88% | 10.57% | 5/21/2026 | $12.03 |
Strategy
Our goal is to maximize total returns. We achieve those most effectively by including "trading" strategies. We regularly trade positions in the mortgage REIT common shares and BDCs because:
- Prices are inefficient.
- Long-term, share prices generally revolve around book value.
- Short-term, price-to-book ratios can deviate materially.
- Book value isn't the only step in analysis, but it is the cornerstone.
We also allocate to preferred shares and equity REITs. We encourage buy-and-hold investors to consider using more preferred shares and equity REITs.
Performance
We compare our performance against 4 ETFs that investors might use for exposure to our sectors:
The REIT Forum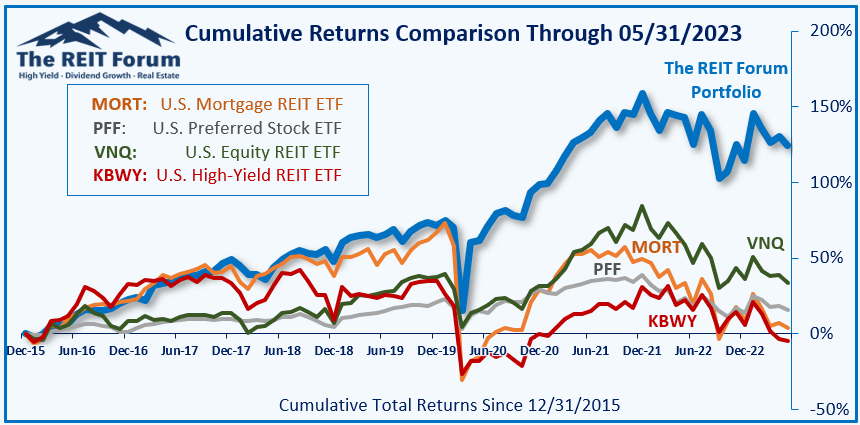
The 4 ETFs we use for comparison are:
Ticker | Exposure |
One of the largest mortgage REIT ETFs | |
One of the largest preferred share ETFs | |
Largest equity REIT ETF | |
The high-yield equity REIT ETF. Yes, it has been dreadful. |
When investors think it isn't possible to earn solid returns in preferred shares or mortgage REITs, we politely disagree. The sector has plenty of opportunities, but investors still need to be wary of the risks. We can't simply reach for yield and hope for the best. When it comes to common shares, we need to be even more vigilant to protect our principal by regularly watching prices and updating estimates for book value and price targets.
Ratings: Bearish on AGNC, ARR, and CHMI
Want the best research? It's time to raise your game. Get access to several features you won't find on the public side.
You can get access to everything we have to offer right now. Try our service and decide for yourself.

This article was written by

You’ll find several reports on The REIT Forum that don’t get posted to the public side of Seeking Alpha. Many of our public reports are dramatically reduced versions of subscriber articles. If you enjoy our public articles, you’ll love the content we keep for subscribers.
Analyst’s Disclosure: I/we have a beneficial long position in the shares of AGNCO, RITM-D, FBRT-E, GPMT-A, RC-E, PMT-C, DX-C, EFC-A, AGNCP, EFC-C, MFA-C, RITM-C, RITM, SLRC, MFA, GPMT, RC, DX either through stock ownership, options, or other derivatives. I wrote this article myself, and it expresses my own opinions. I am not receiving compensation for it (other than from Seeking Alpha). I have no business relationship with any company whose stock is mentioned in this article.
Colorado Wealth Management Fund and Scott Kennedy are supporting contributors for The REIT Forum. Our ratings and outlooks will often overlap. Any recommendation posted in this article is not indefinite. We closely monitor all of our positions. We issue Buy and Sell alerts on our recommendations, which are exclusive to our members. I have an indirect conflict of interest with ABR and STWD. Neither I, nor any contributor for The REIT Forum, will provide investment advice, reply to questions, or engage in discussions regarding these two mREIT stocks.
Seeking Alpha's Disclosure: Past performance is no guarantee of future results. No recommendation or advice is being given as to whether any investment is suitable for a particular investor. Any views or opinions expressed above may not reflect those of Seeking Alpha as a whole. Seeking Alpha is not a licensed securities dealer, broker or US investment adviser or investment bank. Our analysts are third party authors that include both professional investors and individual investors who may not be licensed or certified by any institute or regulatory body.