SDEM: Enough Downsides To Stay Away

Summary
- Global X MSCI SuperDividend® Emerging Markets ETF holds 50 high-yield stocks from emerging markets.
- Exposure to geopolitical and regulatory risks related to China are concerning.
- Past performance is far behind other emerging markets funds.
- Distributions have been unable to keep pace with inflation.
- The SDEM fund’s existence is threatened by the lack of investor interest.
- Quantitative Risk & Value members get exclusive access to our real-world portfolio. See all our investments here »
Ildo Frazao/iStock via Getty Images
This article series aims at evaluating ETFs (exchange-traded funds) regarding past performance and portfolio metrics. Reviews with updated data are posted when necessary.
SDEM strategy and portfolio
Global X MSCI SuperDividend® Emerging Markets ETF (NYSEARCA:SDEM) started investing operations on 03/16/2015 and tracks the MSCI Emerging Markets Top 50 Dividend Index. As of writing, it has 54 holdings, a distribution yield of 7.81%, and a total expense ratio of 0.67%. Distributions are paid monthly.
The net asset value (about $43 million) and the average trading volume (about 6.3k shares/day) are low, and both have been going down since my last review in February and the previous one in August 2022. This is not only a concern for slippage (using limit orders is absolutely necessary), but also for the fund's survival.
As described by MSCI, the underlying index
"includes large and mid-cap stocks across 27 Emerging Markets (EM) countries*. The index aims to reflect the performance of 50 securities from the MSCI EM Index, selected by dividend yield that have increased or maintained their dividend per share compared to the previous year or have increased or maintained their payout ratio (defined as dividend per share/earnings per share) if the dividend per share has dropped by up to 10%."
Constituents are in equal weight at every index reconstitution.
The fund is mostly invested in large cap companies (about 69% of asset value). The heaviest countries in the portfolio are China (20.9%), Taiwan (17.2%) and Brazil (11.3%). Other countries are below 7%. The fund had to drop Russian assets with heavy losses in 2022 because of regulation relative to the war in Ukraine. Exposure to geopolitical risks is still very high: the aggregate weight of China, Taiwan and Hong-Kong is 43.4%. The next chart lists countries with weights above 2%, representing about 85% of the fund's assets.
SDEM top countries in % of asset value (chart: author with GlobalX data.)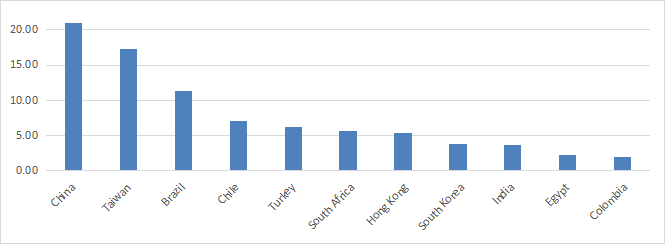
The heaviest sectors are materials (27%), financials (24.7%), energy (15%) and technology (11.5%). Other sectors are below 7%. Three sectors are ignored: consumer discretionary, healthcare and communication.
SDEM sector breakdown in % of asset value (chart: author with GlobalX data.)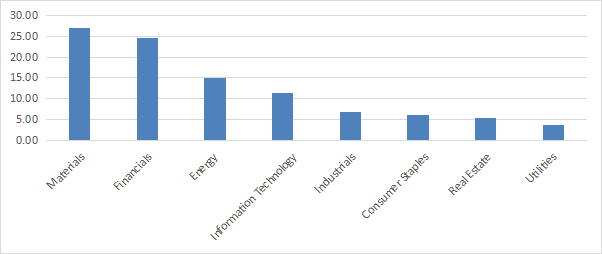
All positions are in equal weight after every rebalancing, but they may drift with price action. The currents top 10 holdings are listed below: these are the constituents with the best momentum since the last rebalancing. They represent 22.3% of asset value, and the top holding weighs 2.42%, so risks related to individual companies are low.
Name | Ticker | % of Net Assets |
PFBCOLO | PFBCOLO CB | 2.42 |
EASTERN CO SAE | EAST EY | 2.38 |
YAPI VE KREDI BANKASI | YKBNK TI | 2.3 |
LITE-ON TECHNOLOGY CORP | 2301 TT | 2.28 |
NOVATEK | 3034 TT | 2.21 |
LONGFOR GROUP HO | 960 HK | 2.18 |
MEDIATEK INC | 2454 TT | 2.17 |
GROWTHPOINT PROP | GRT SJ | 2.16 |
BANPU PUBLIC CO LTD-NVDR | BANPU-R TB | 2.11 |
GERDAU SA | GGBR4 BZ | 2.11 |
Past performance compared to competitors
The next chart compares total returns since inception of SDEM, its parent index represented by iShares MSCI Emerging Markets (EEM), and three emerging market dividend funds:
- WisdomTree Emerging Markets SmallCap Dividend Fund (DGS), reviewed here,
- WisdomTree Emerging Markets High Dividend Fund (DEM),
- Schwab Fundamental Emerging Markets Large Co. Index ETF (FNDE).
SDEM has lagged all of them by a wide margin and it is the only one in loss in this list.
SDEM vs. Emerging Market ETFs since inception (Seeking Alpha)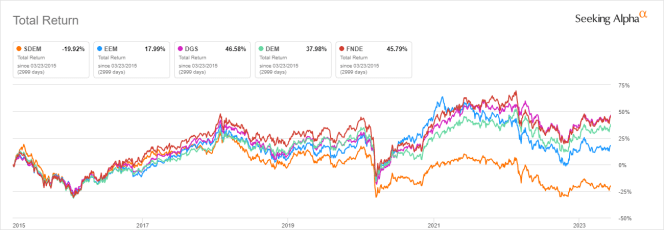
It is also the worst performer in the last 12 months:
SDEM vs. Emerging Market ETFs, last 12 months (Seeking Alpha)
Excluding dividends, SDEM has suffered a decay of 51% since inception, as reported on the next chart.
SDEM share price (Seeking Alpha)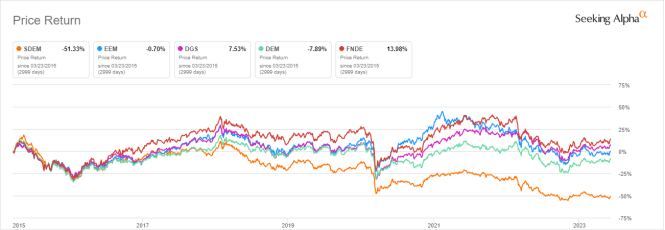
The sum of annual distributions is slightly down since inception: from $2.26 per share in 2015 to $2.11 in 2022. In the same time, the cumulative inflation has been about 25%, based on CPI.
SDEM distribution history (Seeking Alpha)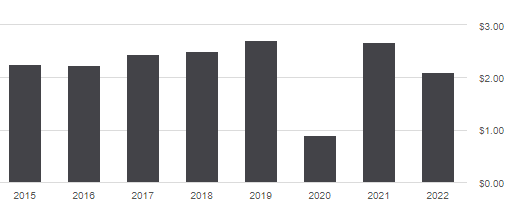
Takeaway
Global X MSCI SuperDividend Emerging Markets ETF holds 50 high-yield stocks listed in emerging markets with an equal-weight methodology. It is well-diversified across holdings, but it has enough downsides to stay away:
- assets under management and liquidity have been decreasing to concerning levels that may threaten the fund's existence,
- over 40% of asset value is directly exposed to geopolitical and regulatory risks related to China,
- the share price has lost 51% since inception,
- distributions have been flattish, while cumulative inflation has been 25%,
- the fund has underperformed a number of emerging market ETFs by a wide margin.
Editor's Note: This article covers one or more microcap stocks. Please be aware of the risks associated with these stocks.
Quantitative Risk & Value (QRV) features data-driven strategies in stocks and closed-end funds outperforming their benchmarks since inception. Get started with a two-week free trial now.

This article was written by

Step up your investing experience: try Quantitative Risk & Value for free now (limited offer).
I am an individual investor and an IT professional, not a finance professional. My writings are data analysis and opinions, not investment advice. They may contain inaccurate information, despite all the effort I put in them. Readers are responsible for all consequences of using information included in my work, and are encouraged to do their own research from various sources.
Analyst’s Disclosure: I/we have no stock, option or similar derivative position in any of the companies mentioned, and no plans to initiate any such positions within the next 72 hours. I wrote this article myself, and it expresses my own opinions. I am not receiving compensation for it (other than from Seeking Alpha). I have no business relationship with any company whose stock is mentioned in this article.
Seeking Alpha's Disclosure: Past performance is no guarantee of future results. No recommendation or advice is being given as to whether any investment is suitable for a particular investor. Any views or opinions expressed above may not reflect those of Seeking Alpha as a whole. Seeking Alpha is not a licensed securities dealer, broker or US investment adviser or investment bank. Our analysts are third party authors that include both professional investors and individual investors who may not be licensed or certified by any institute or regulatory body.