DEEP: Margin Compression, Sluggish Growth, Liquidity Weigh On The Rating

Summary
- DEEP is a passively managed fund with a solidly designed strategy that places emphasis on the value, small-cap, and quality factors.
- DEEP has grossly succeeded in its effort to distill a truly small-cap portfolio, with impressive exposure to the value factor and adequate profitability by the small-cap echelon standards.
- Its performance since the strategy change in October 2020 has been exceptionally robust, especially during the capital rotation.
- However, with the three principal risk factors detailed in the note, I am of the opinion a Hold rating is an optimal one.
PM Images
The Roundhill Acquirers Deep Value ETF (NYSEARCA:DEEP) is a passively managed fund with a solidly designed strategy that places emphasis on the value, small-cap, and quality factors.
After analyzing its holdings using Seeking Alpha tools and a few other data sources, I should conclude that DEEP has grossly succeeded in its effort to distill a truly small-cap portfolio (unlike most of its peers with minimalist strategies that I covered in the past), with impressive exposure to the value factor and adequate profitability by the small-cap echelon standards. Most importantly, its performance since the strategy change in October 2020 has been exceptionally robust, especially during the heyday of the capital rotation in 2021 when the chief narrative was the quickly abating pandemic that bolstered multiples expansion in cyclicals. It also fared relatively well during last year's bear market, beating the iShares Core S&P 500 ETF (IVV), though lagging the iShares Core S&P Small-Cap ETF (IJR) by about 1.5%.
However, with the three principal risk factors detailed below in the note, I am of the opinion a Hold rating is an optimal one, otherwise DEEP would clearly be a Buy.
Strategy overview: the power of the Acquirer's multiple
DEEP underwent a thorough strategy change in the past rendering total returns delivered during the most part of its history (since 2014) irrelevant, thus they will be ignored in the performance analysis section.
As mentioned on page 6 of the prospectus, on June 22, 2020, the fund ceased tracking the Deep Value Index and switched to the Acquirers Deep Value Index, which itself saw a profound change a few months later, reorienting from large-cap names to small caps.
The Acquirers Deep Value Index is supposed to represent the performance of "a portfolio of 100 of the most undervalued, fundamentally strong stocks drawn from the smallest 75% of stocks listed in the United States by market capitalization meeting certain liquidity thresholds" as the DEEP prospectus succinctly put it. It is reconstituted quarterly.
The stock selection and weighting process is thoroughly described on page 3. The philosophy of the index is based on the Acquirer's multiple, a fundamental value indicator with metrics like debt, preferred stock, minority interests, and operating earnings at its crux. The entire initial universe is also screened scrupulously with assets, earnings, and cash flows based metrics, with each candidate assigned a rank based on its valuation characteristics. Next, "statistical measures of fraud, earnings manipulation, and financial distress" are taken into account to ensure soft-quality, risky names (typically referred to as value traps) are filtered out. On the second step, a potential constituent faces a margin of safety test, with three factors examined, namely "a wide discount to a conservative valuation," balance sheet resilience, and free cash flow. On the final step, forensic accounting techniques are applied as the additional quality screen. One hundred most resilient names that successfully passed every test join the index, with constituent weight capped at 1%. Importantly, BDCs cannot compete for a place in it. It is worth noting that even though there is "a buffer for certain criteria" that should keep turnover at bay as said in the prospectus, the metric is still rather high at 119%, which is a drag on the fund's Quant Risk grade.
What optimists say
Exemplary priced portfolio for fervent supporters of value investing philosophy
One of the major issues for maximalist value investors seeking pure-play small-cap portfolios is that most ETFs that should help them in their pursuits have too large exposure to the mid-cap universe. I should also remark that at times, they even have to venture into the micro-cap ETFs, thus potentially adding much more risk as micro-size names are exceedingly volatile and typically with meaningfully softer quality and a plethora of other issues.
Thankfully, this is not the case with DEEP, which grossly succeeded in its effort to distill a truly small-cap portfolio, featuring the weighted-average market capitalization of $942.6 million, with the median at $768.5 million as per my calculations based on June 8 data, even though it does have modest exposure (5.7%) to mid caps (less than $2 billion in market cap) and micro-caps, or those valued at less than $300 million (5.9%). A similar point was expressed by SA contributor Kurtis Hemmerling in the December 2022 article on DEEP, where Mr. Hemmerling provided an excellent discussion of "the size premium" and the flaws of the market-cap-weighted funds like the Vanguard Small-Cap Value ETF (VBR).
Below is the WA market caps of a few small-size plays I covered in the past on Seeking Alpha, based on the data from ETF.com (except for DEEP); IWC was added for better context.
| ETF | Market Cap (weighted-average, $ million) |
| iShares Micro-Cap ETF (IWC) | 776.9 |
| Roundhill Acquirers Deep Value ETF (DEEP) | 942.6 |
| Invesco S&P SmallCap 600 Pure Value ETF (RZV) | 1,280 |
| Invesco S&P SmallCap High Dividend Low Volatility ETF (XSHD) | 1,360 |
| iShares US Small Cap Value Factor ETF (SVAL) | 1,910 |
| SPDR S&P 600 Small Cap Value ETF (SLYV) | 1,960 |
| Invesco S&P SmallCap 600 Revenue ETF (RWJ) | 2,010 |
| Pacer US Small Cap Cash Cows 100 ETF (CALF) | 2,190 |
| iShares Core S&P Small-Cap ETF (IJR) | 2,300 |
| iShares Russell 2000 Value ETF (IWN) | 2,390 |
| Avantis U.S. Small Cap Value Fund (AVUV) | 2,780 |
| VictoryShares US Small Cap High Div Volatility Wtd ETF (CSB) | 2,920 |
| Schwab Strategic Trust - Schwab U.S. Small-Cap ETF (SCHA) | 4,110 |
Clearly, the Roundhill ETF has the smallest WA MC in this cohort (except for the micro-cap play); at the same time, the funds like CALF, IJR, and IWN, etc. are obviously tilted towards mid caps and thus would not appeal to small cap style maximalists.
Next, DEEP also has robust valuation characteristics as shown below. The most important fact is that almost 60% of its holdings have a B- Quant Valuation grade or higher, while those seemingly overpriced account for less than 10%. My dear readers may note here that when I covered SVAL in February 2022, I wrote that "...the weight of stocks with at least a B- rating does not exceed 56% [of the fund's net assets], which is not ideal for a value ETF." I have a similar opinion on DEEP (I would prefer a larger share), but nuance here is that the SVAL fund was burdened by low-quality stocks back then, while the Roundhill ETF is not.
| WA Market Cap | Quant Valuation D+ or worse | Quant Valuation B- or better | WA Earnings Yield | WA P/S | WA EV/S | WA EV/EBITDA | WA Cash Flow Yield |
| $942.6 million | 9.6% | 59.7% | 11.4% | 1.28 | 1.284 | 8.09 | 19% |
Computed by the author using data from Seeking Alpha
Performance since the strategy change has been robust enough
As it is said in the prospectus, the index methodology was reoriented towards small caps "effective October 23, 2020." So, I opted for the November 2020 - May 2023 period to analyze. IWC and IVV were added for better context.
Created by the author using data from Portfolio Visualizer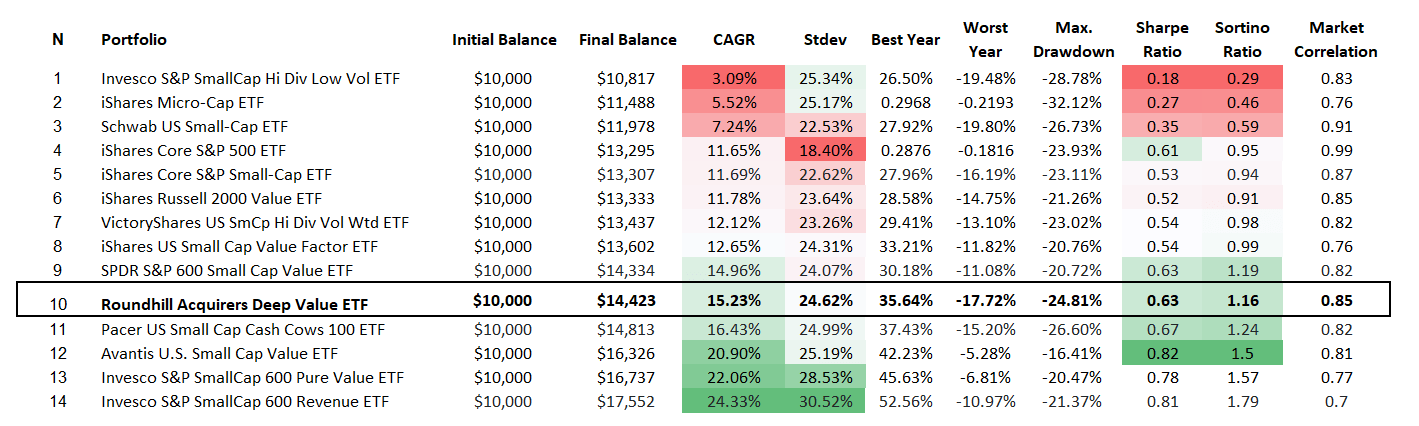
Here, DEEP delivered fairly impressive results, beating most of names in the selected small-cap value cohort and also besting IVV, with a modest standard deviation, so its risk-adjusted returns (Sharpe and Sortino ratios) are also a positive surprise. Importantly, this performance was delivered even despite the ETF's burdensome 80 bps expense ratio.
Quality is mostly sound
As illustrated by the metrics below, DEEP has a fairly robust quality.
| Quant Profitability B- or better | Quant Profitability D+ or worse | WA Net Margin | WA Cash Flow/Net Income | WA ROE | WA ROA | WA Total debt/EBITDA |
| 64.5% | 9.6% | 11.3% | 2.48 | 22.4% | 9.7% | 2.38x |
However, on the negative side, ~6.9% of the net assets are allocated to eight holdings with negative operating cash flows, which is an unpleasant surprise considering DEEP's focus on FCF mentioned above.
Created by the author using data from Seeking Alpha as of June 8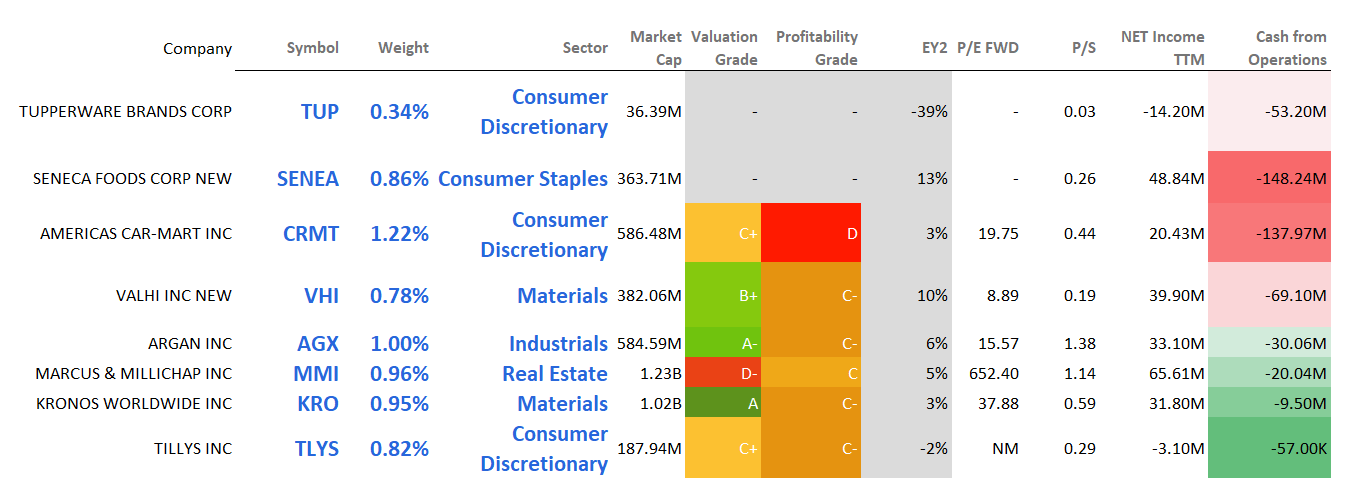
What skeptics say
Lackluster growth exposure reveals margin compression issues beneath the surface
The critical problem with value strategies is that they have to sacrifice something since there is always (mostly) a reason behind a company's attractive valuation, with the top culprits being either profitability or growth concerns. In the case of DEEP, this is mainly poor growth, with a few minor quality nuances to dislike. More specifically, my calculations based on pundits' estimates show its weighted-average forward revenue growth rate at only 1.4%, with EPS growing at a glacial pace and EBITDA even contracting. This is a disappointment.
| Fwd EPS growth | Fwd Revenue | Fwd EBITDA |
| 0.24% | 1.41% | -0.49% |
Small AUM, liquidity risks
Another risk is that DEEP's AUM is at only $38.5 million. This is one of the reasons why it has the worst liquidity characteristics (small AUM, low volumes) in the peer group of the Small Value ETF sub-class encompassing 33 names.
Seeking Alpha ETF Screener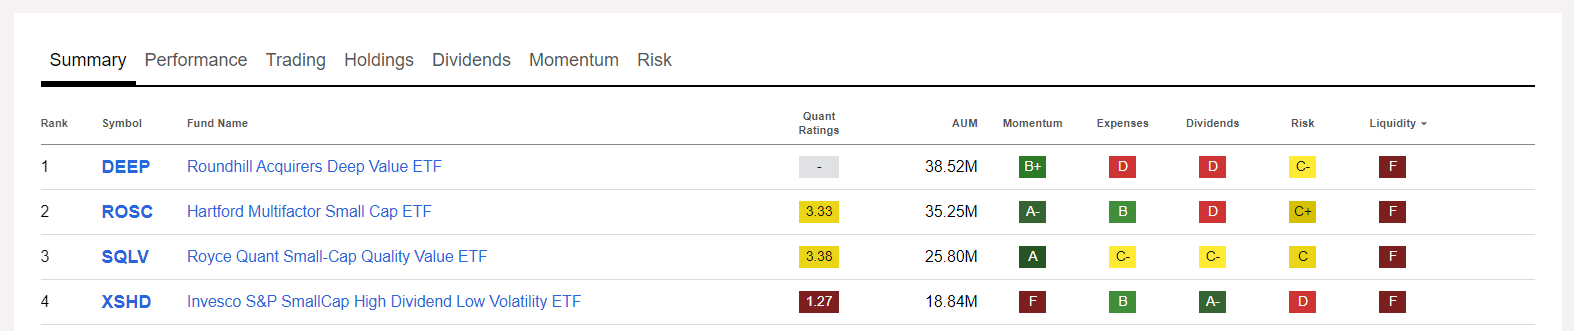
A few final remarks
As a fervent supporter of quality-conscious value strategies, I was impressed by DEEP's equity mix. The fund has clearly delivered on its promise, with mostly robust quality and the cohort-leading performance since a major turning point in its history in October 2020. However, liquidity and AUM considerations should not be ignored. Its growth profile also does not appeal to me, while there is a hidden margin contraction issue. In sum, I opt for a Hold rating.
This article was written by

Analyst’s Disclosure: I/we have no stock, option or similar derivative position in any of the companies mentioned, and no plans to initiate any such positions within the next 72 hours. I wrote this article myself, and it expresses my own opinions. I am not receiving compensation for it (other than from Seeking Alpha). I have no business relationship with any company whose stock is mentioned in this article.
Seeking Alpha's Disclosure: Past performance is no guarantee of future results. No recommendation or advice is being given as to whether any investment is suitable for a particular investor. Any views or opinions expressed above may not reflect those of Seeking Alpha as a whole. Seeking Alpha is not a licensed securities dealer, broker or US investment adviser or investment bank. Our analysts are third party authors that include both professional investors and individual investors who may not be licensed or certified by any institute or regulatory body.