Ford Seems Set To Break Out

Summary
- In the near term, Ford has a good chance of breaking out of the ~$15 consolidation range.
- Key catalysts include the compressed valuation, strong demand for its popular models, and also the improving macroeconomic conditions.
- In the longer term, I am optimistic about investment in new models and the expansion of its manufacturing capabilities, especially for EVs.
- This idea was discussed in more depth with members of my private investing community, Envision Early Retirement. Learn More »
Bill Pugliano/Getty Images News
Thesis
This article is largely a compilation of inquiries from our investing group members regarding our Ford (NYSE:F) holding. As a background, we provide regular updates on our UTMA account (more on this in the second section) for our teenage son. And F is one of the 6 stocks we hold in this account. Our members have asked us a range of questions surrounding F. And these questions have covered an amazing range of topics. I believe many of these questions are of general relevance to investing (e.g., what is a UTMA account and why only 6 stocks) and also of specific interest to F (like its cyclicality and near-term challenges/catalysts).
For today’s article, I’ll limit its length and keep it focused by concentrating on only one of the questions: what are our target prices for our holdings? In the remainder of this article, I will review its business fundamentals and profitability metrics to provide my projections. In a nutshell, my view is that the stock will have a good chance of breaking out of the ~$15 consolidation range this time. Furthermore, if it does, I see the stock having a good chance to rally to ~$17 per share in the near term. I will provide the profitability and valuation analyses to back up these projections.
Our UTMA account and F holding
For readers new to us, a bit of background first. We are long-term investors in the final stage of reaching our early retirement (after working for about 17 years). A key remaining hurdle (a good one though) is our teenage son. To help him, we have been managing a UTMA account (Uniform Transfers to Minors Act account and details can be found in our earlier article). The account provides a good tool to help him both financially and educationally (plus some tax benefits on top of everything). We regularly update this account within our investing group and our current holdings are shown below. A few notes:
- For performance tracing purposes, I used the prices on July 11, 2022 (the date I first published this portfolio) on SA as the entry price. So, it's easier for readers to verify and track its performance.
- Our actual portfolio size is smaller than shown. The numbers in the table below are based on a $100k starting size to simplify the math.
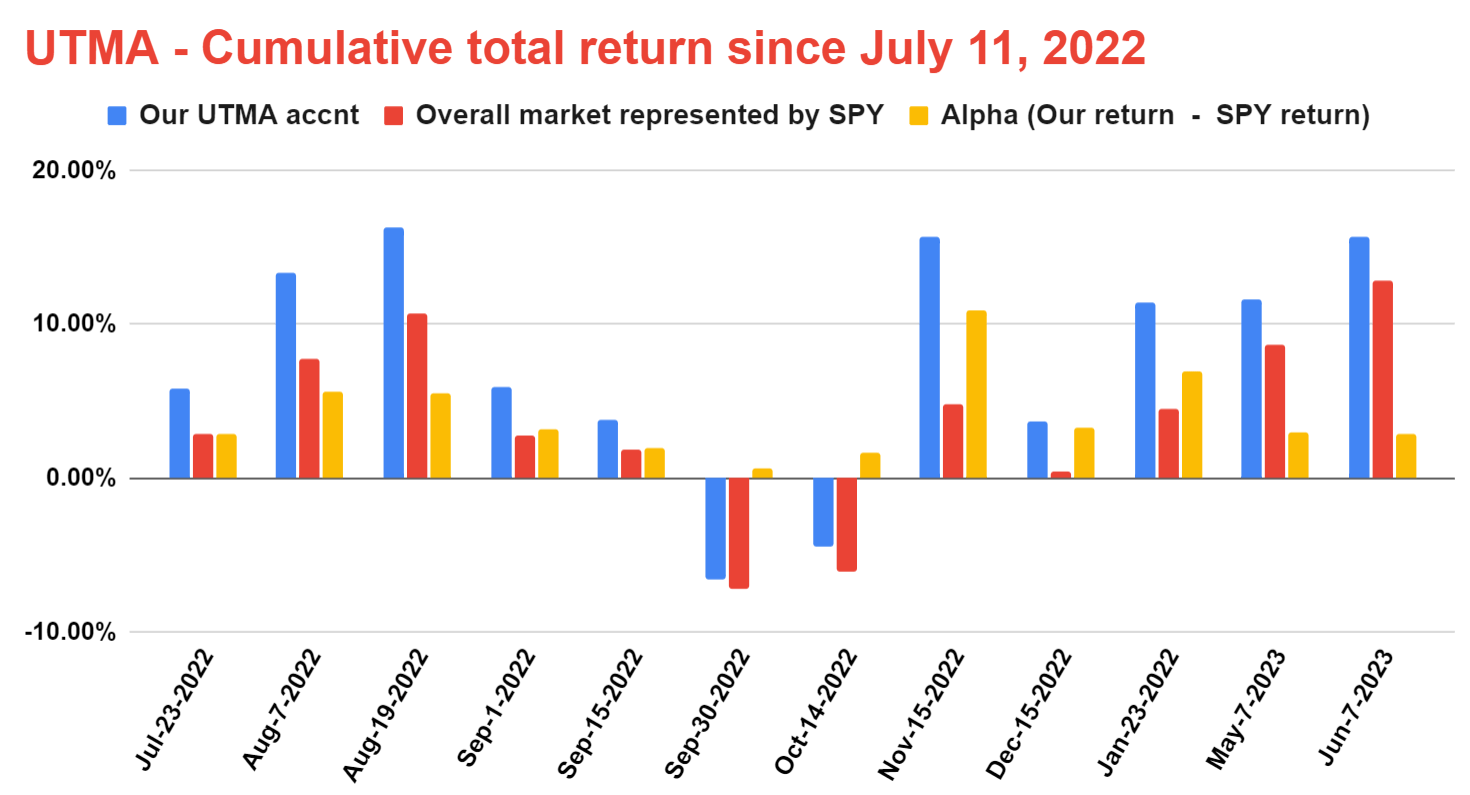
As seen, our UTMA account holds six stocks in total. And F is the second largest position with a weight of 16.8% of the total portfolio. Our portfolio has consistently outperformed the S&P 500 Index since July 2022. As of this writing, the account is leading the SP500 by 2.4%. Many members have asked about our concentrated approach. The questions more or less came like these: should you be concerned about diversification? or how could the portfolio outperform with such concentration? Our experience is that a few well-chosen stocks offer both superior performance and lower risk than a large number of poorly understood holdings. Most retail investors simply do not have the bandwidth to meaningfully follow and understand more than a dozen stocks. Hence, we do not view our account outperformed the SP500 despite its concentration. We believe our account outperformed because of its concentration.
With this background, I will move on to share my thoughts about F. I sincerely hope to see your comments and critiques, so we can all understand it better.
Source: Author Source: Author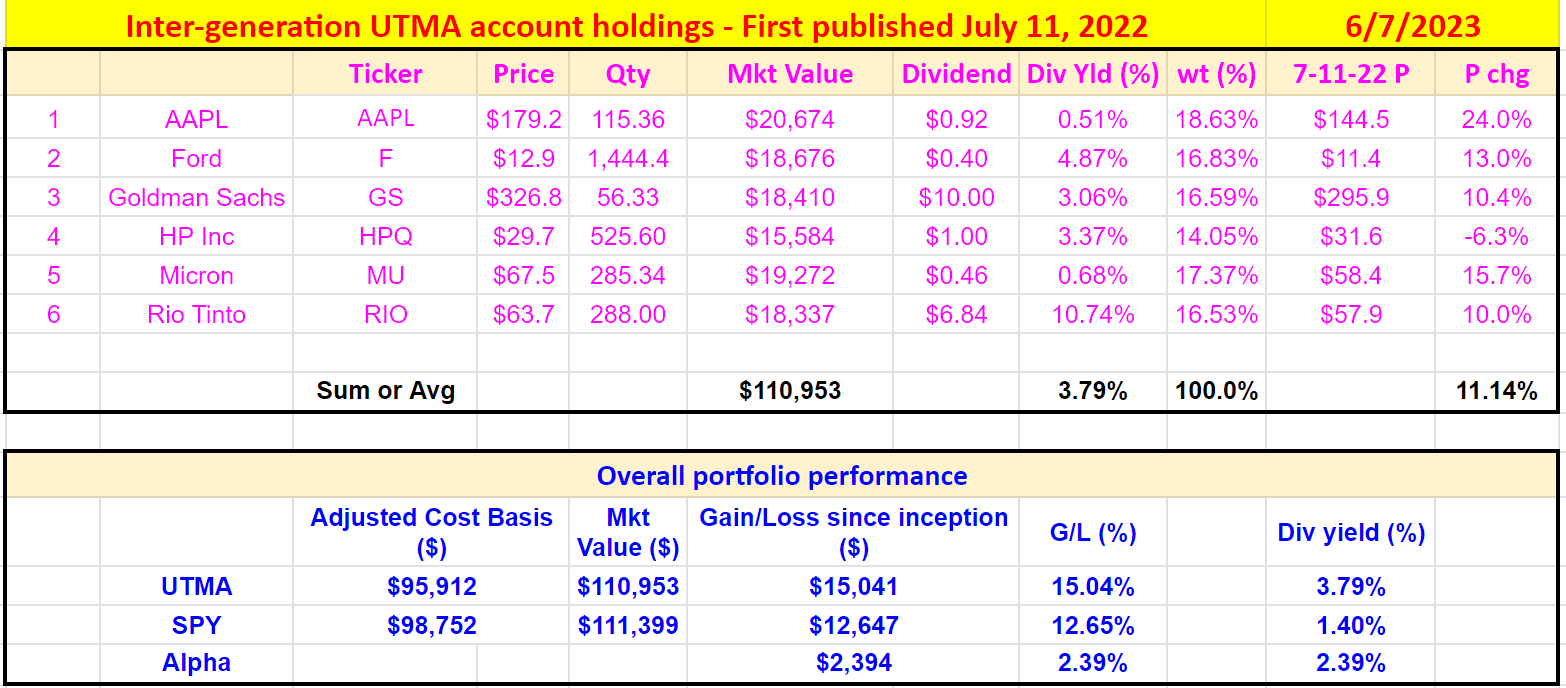
Range bound for ~1 year
As long-term investors, we never encourage our readers to be bothered with the daily trading data. However, if you cannot help, we recommend the following point and figure chart (“PFC”) instead of the common price-volume chart. PFC charts are better in two crucial ways: A) they only record the price movement when the magnitude is large enough, and B) they can show data over an extended period of time. As a result, they help to filter out the daily noises and help to identify underlying trends and patterns. Specific to F, the chart below condenses ~3 years' worth of its price and volume information. Thus, we can also better see the long-term trend rather than daily fluctuations. To wit, during August and September 2022, F was traded at a heavy volume of ~2.2 billion shares and 2.0 billion shares in a price range of about $10 to $15. Such volumes are usually not created by retail investors alone and are due to transactions from institutional holders. As such, the price range often forms a consolidation window. Indeed, F’s prices have been trapped within this range since then.
As long-term investors, we don’t mind the stock prices moving sideways as long as the fundamentals remain strong. This would only lead to more compressed valuation multiples and even larger return potential, which is what we are seeing here as detailed next.
Source: author based on stockcharts.com data.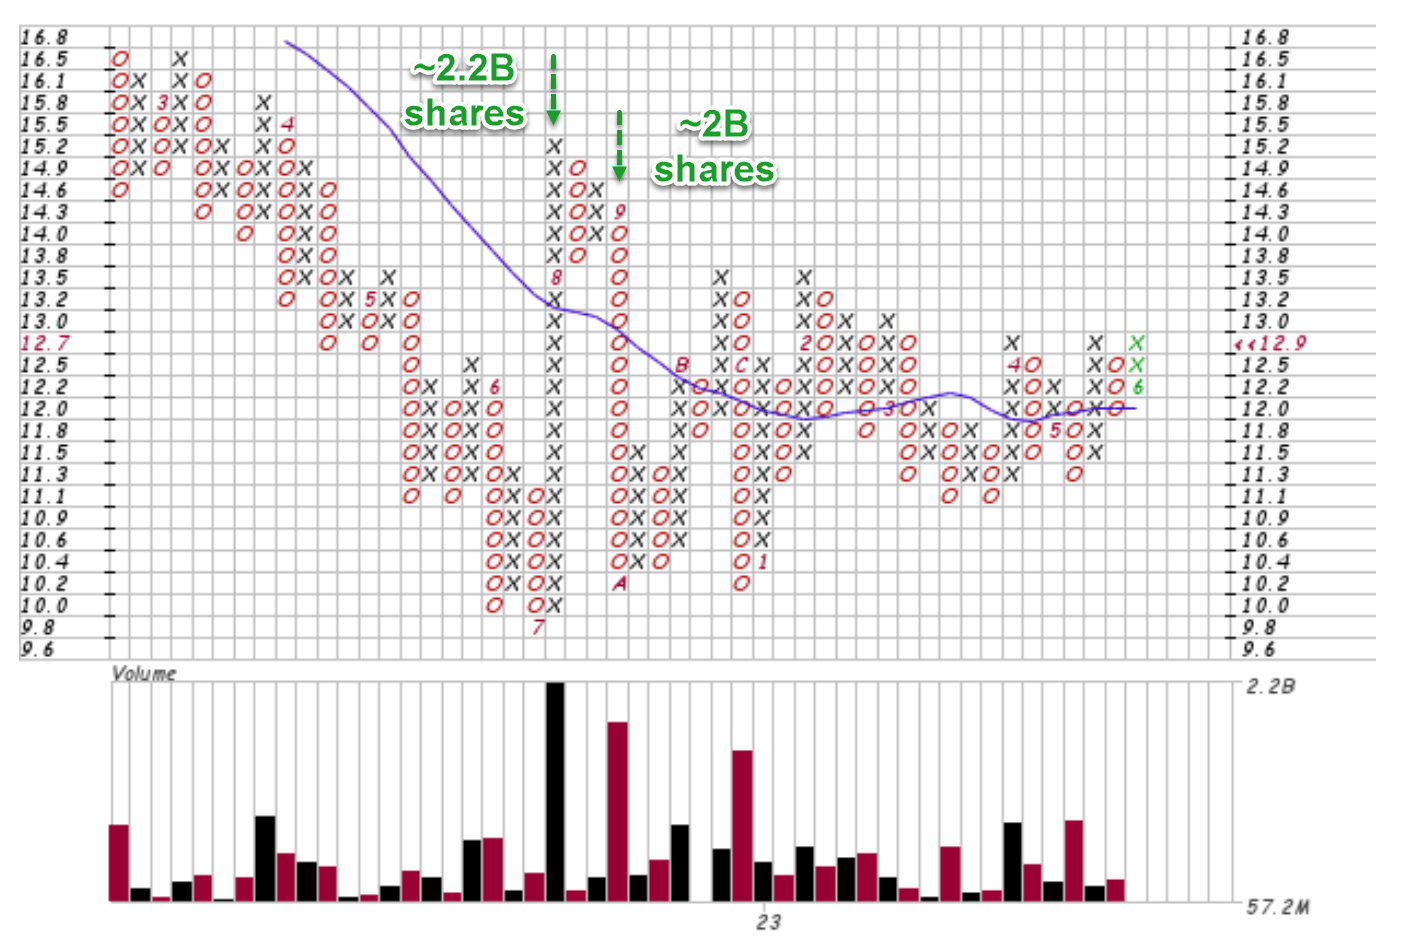
Fundamentals remain strong
F has been maintaining solid profitability over the past, including the recent quarterly amid many macroscopic turbulences. As an example, its Return on Capital Employed (ROCE) has been on average 40.5% in the past decade as seen in the chart below. And its ROCE in both 2021 and 2022 has been essentially at the average level.
Source: author based on Seeking Alpha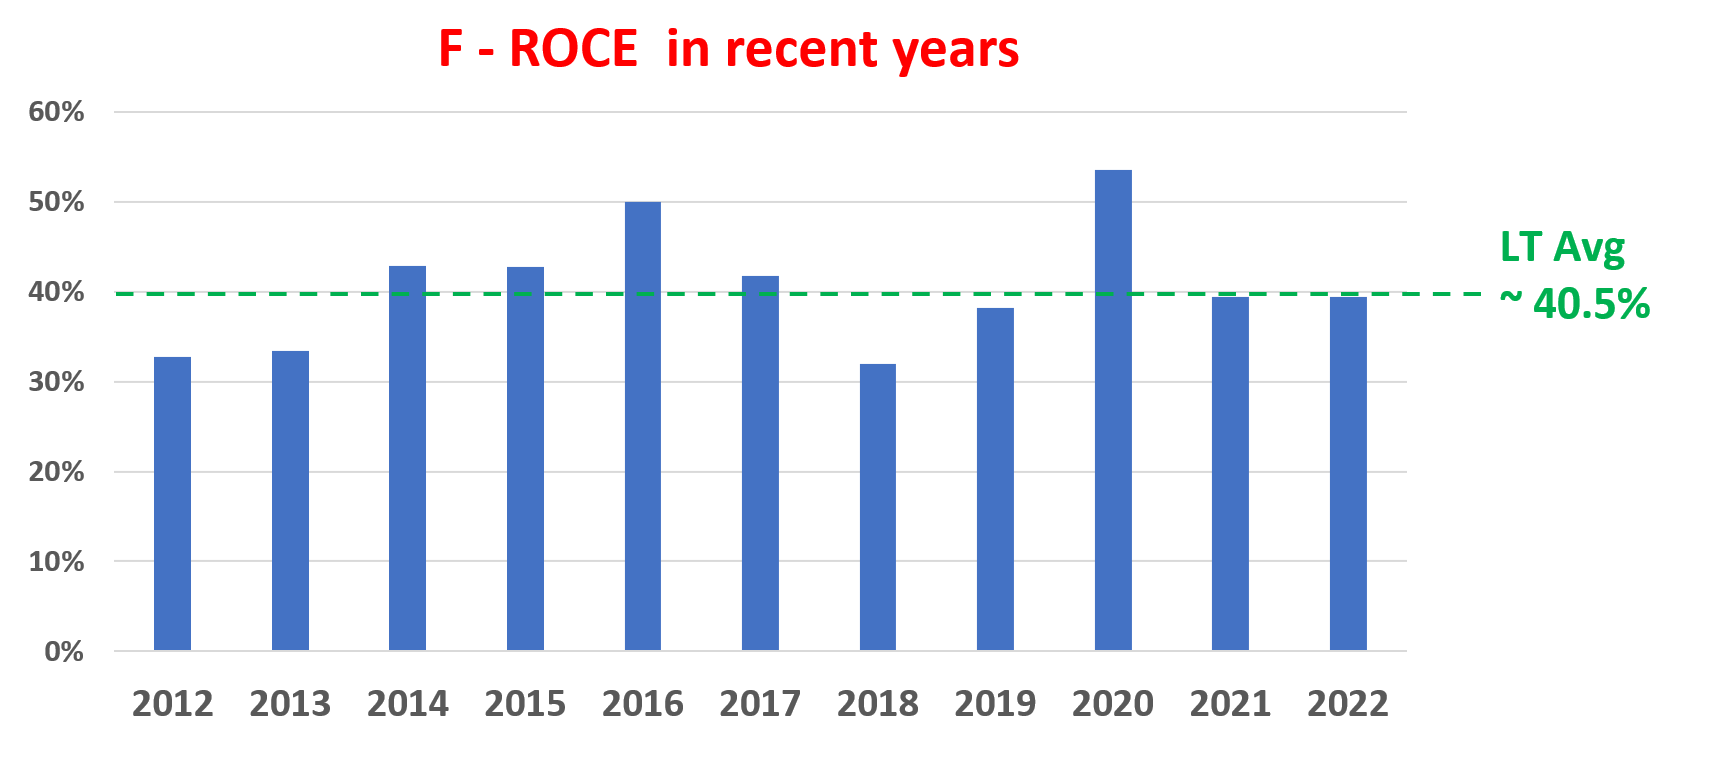
In the meantime, F has also maintained a healthy cash flow and therefore can afford a good amount of growth capital allocation. As seen in the chart below, the company has been ramping up its capital expenditure (“CAPEX”) program steadily in recent years. To wit, F's CAPEX expenditures were about $1.2 billion on a quarterly basis back in 2020. Today, it has risen to almost $1.8 billion, a 50% increase compared to the 2020 level. And I view the management’s capital allocation to be effective. F CAPEX program is focusing on investment in new products, technologies, and manufacturing facilities, which are all key areas to help it to compete more effectively in the global automotive market as to be elaborated on next.
Source: Seeking Alpha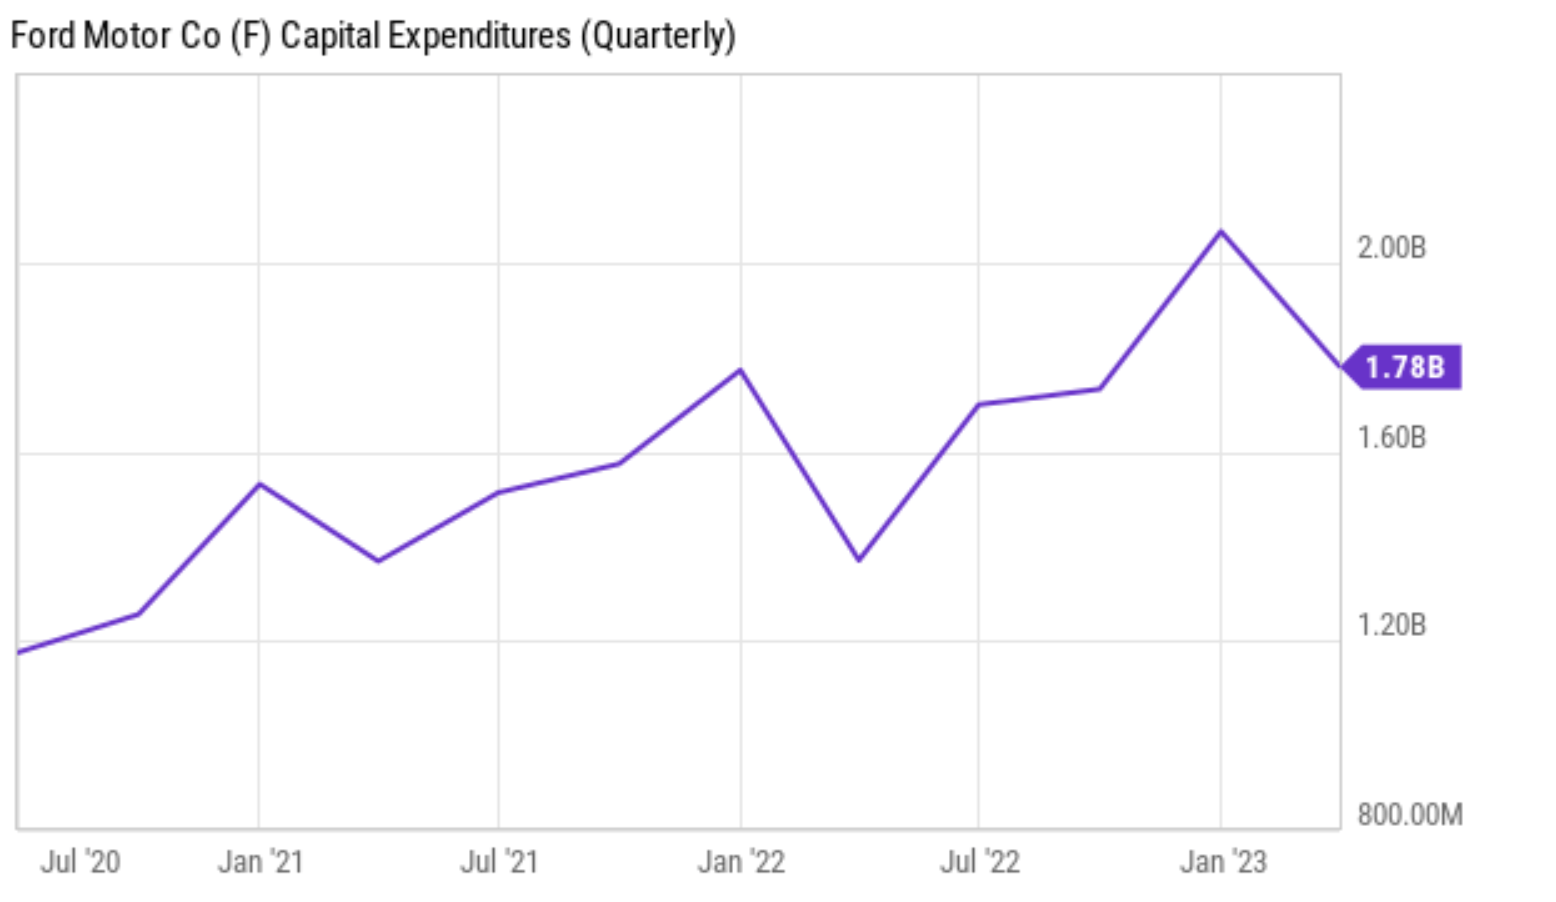
Catalysts
Looking ahead, I see a few key specific catalysts that can help it break out the consolidation range:
- The expansion of the manufacturing capability of its popular models. There is a strong demand for a number of its models, including Bronco Sport, Maverick, and Mustang Mach-E. In response, F is working to increase output at manufacturing sites across North America. The ramp-up of its electric vehicle (“EV”) output is another key area for further growth. Sales of EVs jumped 41% in the more recent quarter, reaching 10,866 units. I am optimistic that the company can reach an annual production of 150,000 and 210,000 units for the F-150 Lightning pickup and Mustang Mach-E crossover, respectively.
- Strong demand across almost all its product lines including trucks (e.g., the F-series), SUVs (e.g., Escape and Explorer), and also EVs (e.g., Mustang Mach-E and F-150 as mentioned above). Overall, its sales in the month of May 2023 went up by 10.7% YoY thanks to the robust demand for its key models. In particular, F-Series truck deliveries grew by 42.7% YOY, Escape compact SUV grew by 31.1%, and Expedition full-size SUV by +52.7%. I view this as a very positive sign, showing the company is well-positioned to continue to grow its sales in the coming quarters in its core lineup of trucks, SUVs, and EVs.
- A sharper focus on EV. The way F’s EV segment operates feels like a startup to me. It has been rapidly developing (under the timeframe of new car model developments) innovative EVs and also autonomous driving technologies. Its plan to sell its German plant is the most recent move to better focus on this future growth area in my view. The sale could free up resources that F could use to invest in electric vehicles and autonomous driving technologies. There are certainly negative considerations such as the union backlash and also potential loss of market share in Europe. However, my view is that the positives outweigh the negatives substantially.
The consolidation range and $15 breakout price
Its stock price is approaching the $15 level again. If you recall from the earlier PFC chart, it attempted the breakout back in Feb 2023 but failed. This time, I think it has a much better chance of succeeding with the catalysts mentioned above. The macroeconomic conditions are also less uncertain at this time than earlier in the year.
Even at a price of $15, F would still be trading at a very attractive valuation as shown in the two charts below. Currently, F is trading at a very low EV/Sales and EV/EBITDA multiple of 1.0x and 10.2x, receptively. Note that here I will stick to EV-based metrics due to the relatively high leverage common in the auto industry. These multiples are substantially below its five-year average by 18% and 45% on an FWD basis. At a break-out price of $15, it would be trading at an EV/sales ratio of 1.04 and EV/EBITDA multiple of 10.64, still substantially below its historical average by a sizable margin.
Source: Author based on Seeking Alpha data Source: Seeking Alpha data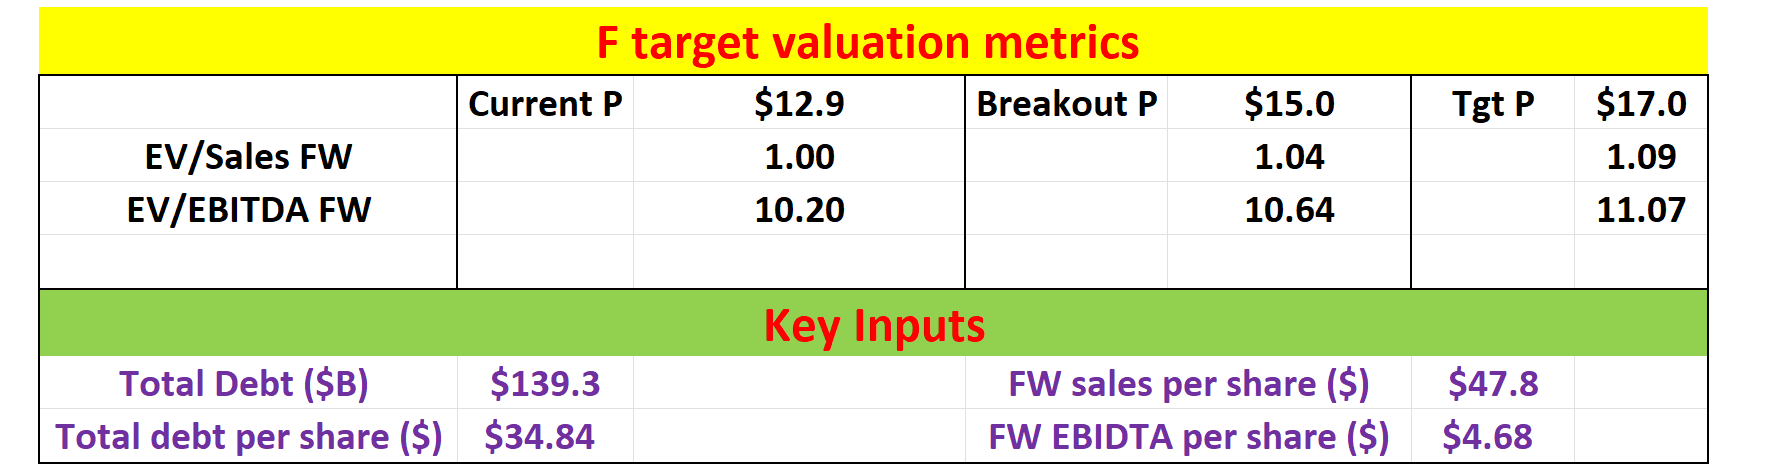

Risks and final thoughts
There are some downside risks to consider in the near term too. F, together with the rest of the automotive industry, faces a few macroscopic and operational challenges in the quarters ahead. Macroscopically, if interest rates kept raising, it could have a significant negative impact in two ways. First, it would increase the borrowing costs of F, which uses relatively high leverage as aforementioned. Second, it would also increase the cost of car loans and weaken demand. Operationally, the chip shortage which limited production, especially during the COIVD pandemic, is easing but is still posing challenges. It could take more time for the global logistic chain to renormalize. At the same time, vehicle recalls continue to represent another risk for F (and other car makers too) in terms of economic losses and reputation losses. Two recent incidents include F’s recall of 2.9 million vehicles in the U.S. due to a software glitch in Feb 2023 and of 490k vehicles due to a fuel tank issue. Vehicles impacted by the former recall included the 2013-2018 Escape, 2013-2018 Fusion, 2015-2018 Edge, et al. And F has said that it expects to spend $1 billion to fix the cars impacted in this recall. Vehicles impacted by the latter recall included the F-150, Expedition, and Super Duty, and the financial impact is still being estimated.
To conclude, I am bullish on the stock both in the near and long term. I view the above challenges either as temporary or relatively minor compared to the positive catalysts. In the near term, I see it having a good chance of breaking out of the ~$15 consolidation range with the catalysts analyzed, the compressed valuation, and also the improving macroeconomic conditions. In the longer term, I am optimistic about its product lineup, investment in new technologies/models, and also the expansion of its manufacturing capability especially for EVs.
As you can tell, our core style is to provide actionable and unambiguous ideas from our independent research. If your share this investment style, check out Envision Early Retirement. It provides at least 1x in-depth articles per week on such ideas.
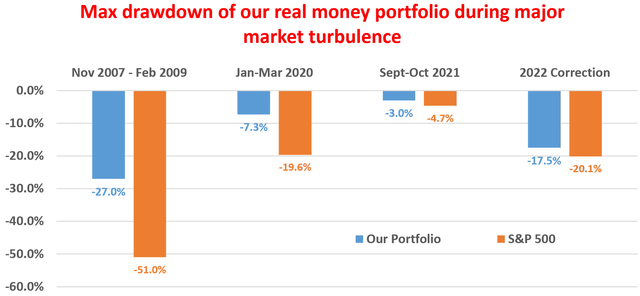
We have helped our members not only to beat S&P 500 but also avoid heavy drawdowns despite the extreme volatilities in BOTH the equity AND bond market.
Join for a 100% Risk-Free trial and see if our proven method can help you too.
This article was written by

** Disclosure: I am associated with Sensor Unlimited.
** Master of Science, 2004, Stanford University, Stanford, CA
Department of Management Science and Engineering, with concentration in quantitative investment
** PhD, 2006, Stanford University, Stanford, CA
Department of Mechanical Engineering, with concentration in advanced and renewable energy solutions
** 15 years of investment management experiences
Since 2006, have been actively analyzing stocks and the overall market, managing various portfolios and accounts and providing investment counseling to many relatives and friends.
** Diverse background and holistic approach
Combined with Sensor Unlimited, we provide more than 3 decades of hands-on experience in high-tech R&D and consulting, housing market, credit market, and actual portfolio management. We monitor several asset classes for tactical opportunities. Examples include less-covered stocks ideas (such as our past holdings like CRUS and FL), the credit and REIT market, short-term and long-term bond trade opportunities, and gold-silver trade opportunities.
I also take a holistic view and watch out on aspects (both dangers and opportunities) often neglected – such as tax considerations (always a large chunk of return), fitness with the rest of holdings (no holding is good or bad until it is examined under the context of what we already hold), and allocation across asset classes.
Above all, like many SA readers and writers, I am a curious investor – I look forward to constantly learn, re-learn, and de-learn with this wonderful community.
Analyst’s Disclosure: I/we have a beneficial long position in the shares of F either through stock ownership, options, or other derivatives. I wrote this article myself, and it expresses my own opinions. I am not receiving compensation for it (other than from Seeking Alpha). I have no business relationship with any company whose stock is mentioned in this article.
Seeking Alpha's Disclosure: Past performance is no guarantee of future results. No recommendation or advice is being given as to whether any investment is suitable for a particular investor. Any views or opinions expressed above may not reflect those of Seeking Alpha as a whole. Seeking Alpha is not a licensed securities dealer, broker or US investment adviser or investment bank. Our analysts are third party authors that include both professional investors and individual investors who may not be licensed or certified by any institute or regulatory body.