5 Reasons Why Investors Should Have Some Exposure To Gold

Summary
- As more and more debt is accumulated and the money supply grows, the value of the U.S. dollar will continue to erode.
- Inflation is sticky and comes in waves.
- Gold continues to perform well and remains undervalued.
- Another spike higher in the USD or continued contraction of M2 are short-term risks for gold.
- There are several ways to gain exposure to gold, and my preferred method is via gold miners. For trading gold, I use GLD, but there is counterparty risk.
- Looking for a helping hand in the market? Members of The Gold Edge get exclusive ideas and guidance to navigate any climate. Learn More »
ayala_studio/iStock via Getty Images
If you're reading this article, you are here for one of three reasons:
- You own gold, are bullish on the sector, and seeking confirmation or additional support for your thesis.
- You are curious about gold and have contemplated investing in the sector but have so far held off buying.
- You don't own gold, have no interest in it, and plan to make that known in the comment section below.
Welcome everyone!
I've been bullish on gold for years as there's a strong underlying investment thesis that supports much higher prices. While many investors might ignore gold, there are several valid reasons to have exposure to the metal (via physical, ETFs, and/or gold miners).
Let's review those now.
1) The U.S. Is Past The Point Of No Return On The Debt/Deficit
With over $30 trillion of debt and climbing, debt to GDP at 100% and expected to increase to ~120% (under the most favorable conditions) over the next decade, and almost $80 trillion of unfunded obligations over the next 75 years, there is no viable way for the U.S. to repay its debt without taking extreme measures - which would result in a multi-year economic depression, maybe even eclipsing the harshness of the Great Depression. Nobody wants that.
Cato.Org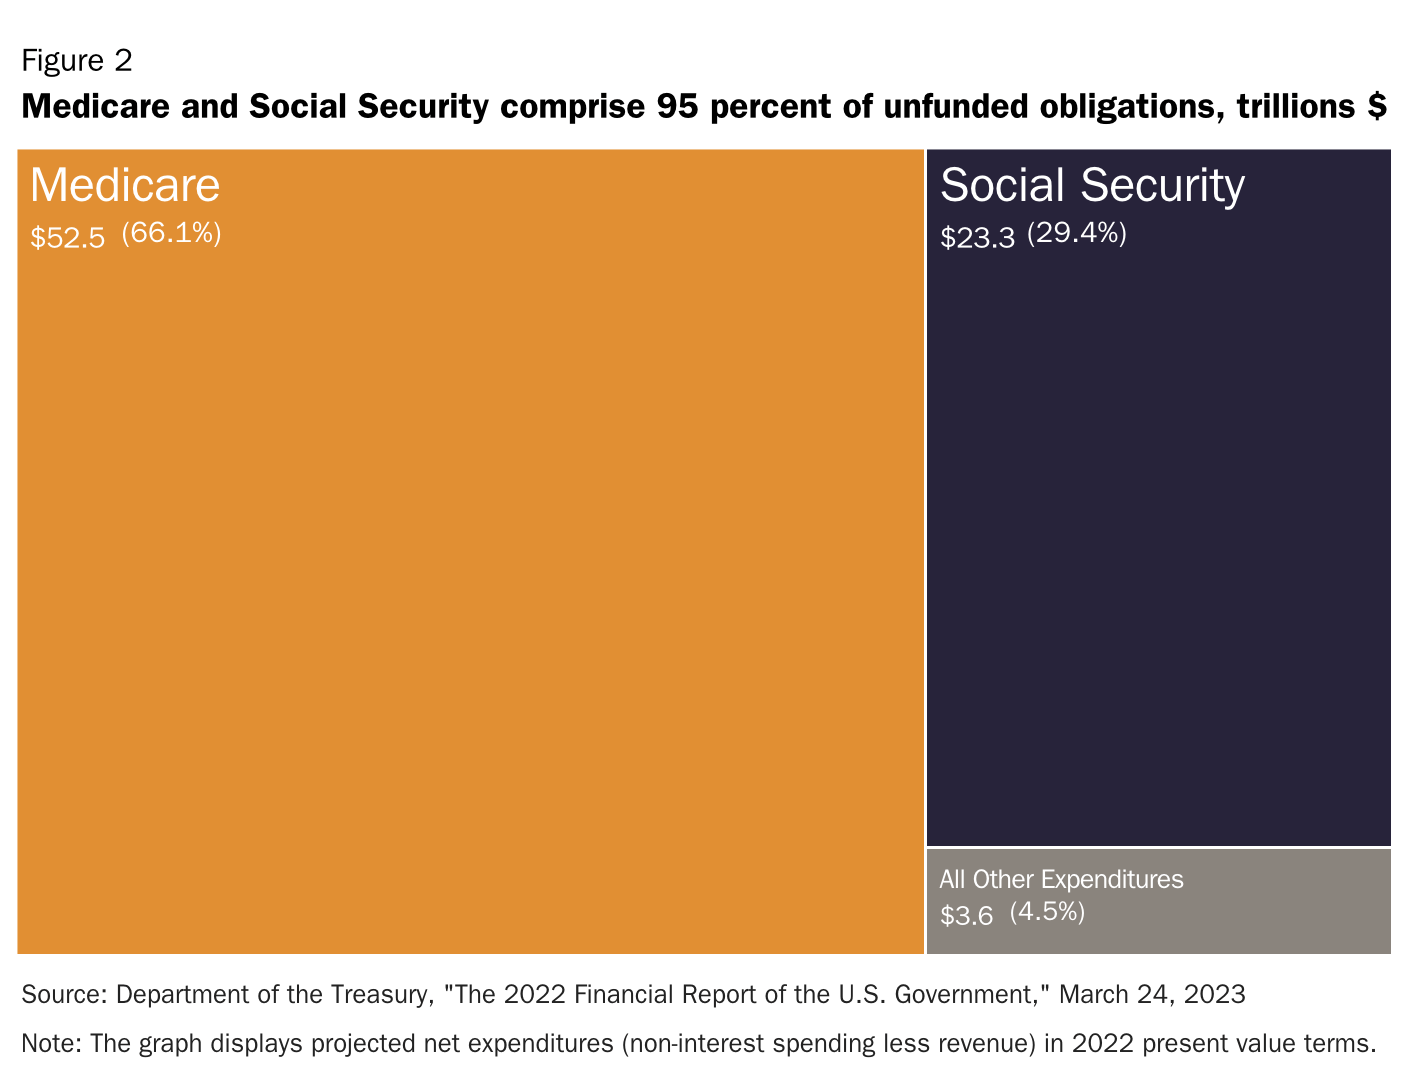
Protracted, down-to-the-wire debt ceiling debates in the U.S. are becoming more common, but nothing substantial ever comes out of it, and it's mostly political posturing.
An article from a few weeks ago, as the debt ceiling agreement was being hashed out, summed up the situation:
The US government could start to run out of money within weeks unless it allows itself to borrow more.
When you have the ability to print unlimited amounts of money to satisfy the debt/obligations you owe, there is no incentive to rein in spending to the degree necessary to get your financial house in order.
It comes down to two choices: Does the U.S. government want to inflate the debt away since it can do so, or does it want to take the hardline approach and throw the economy into a severe economic depression.
Throughout the history of global fiat currency systems, governments have chosen to inflate.
There is no middle-ground option at this stage, as Congress would never agree. Most politicians wouldn't be willing to inflict the pain necessary to lower the debt obligations, which means the U.S. is past the point of no return.
The following is the most important graph investors should follow. While it seems benign in nature, it's the straw that will break the camel's back. What it shows is the average interest rate on U.S. Treasury securities over the last two decades. In 2001, the U.S. was paying over 6.5% interest on its debt. The bond bull market over the next 20 years drove rates lower, to the point that the U.S. was only paying ~1.6% interest on average by 2021-2022. So while the amount of debt quintupled from 2001-2022, the average interest rate fell by ~75%. That allowed the total annual interest paid by the U.S. on its debt to only increase modestly. The biggest beneficiary of the low-interest rate environment over the last decade has been the U.S. government, as it allowed the government to borrow far more for almost the same amount of interest. However, that's now all reversing. The aggressive increase in interest rates over the last 12-18 months has resulted in the average interest rate on the U.S. debt surging to ~2.7%. As older debt rolls over, the average interest will continue to increase - so long as the Fed keeps rates elevated or inflation remains high.
Treasury.gov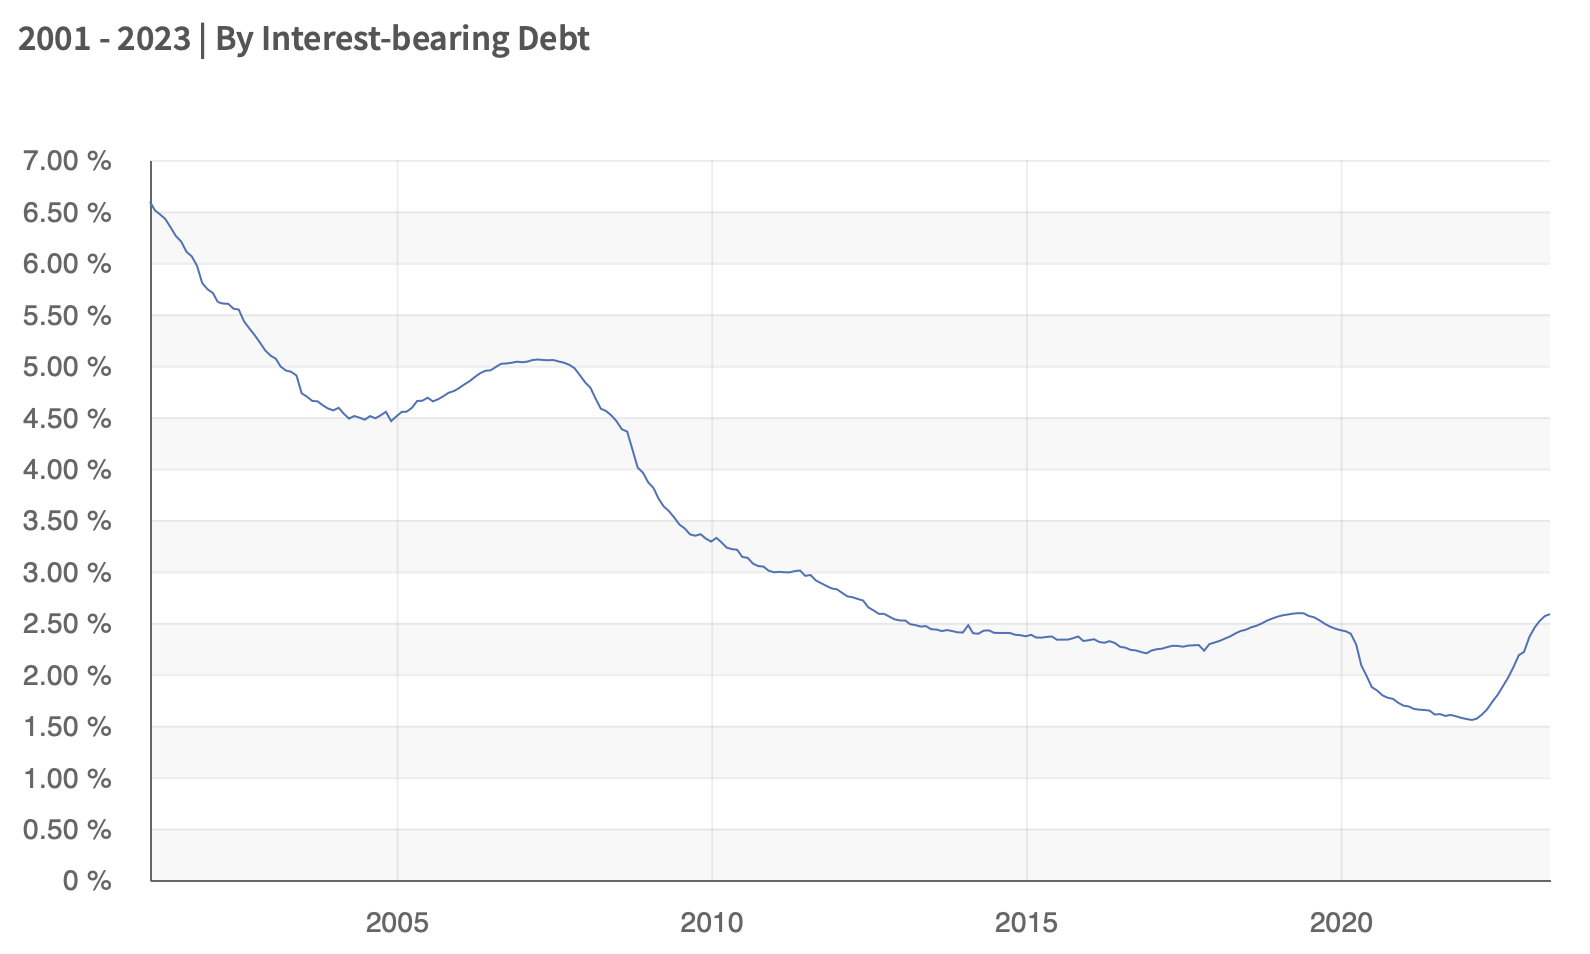
So what does this mean?
The higher the average interest paid on the debt, the higher the annual deficit. That's when the snowball effect kicks in, as more debt is piled on, which requires more money to service and results in the rapid expansion of the money supply. That's how economies end up in hyperinflation.
As more and more debt is accumulated and the money supply grows, the value of the U.S. dollar will continue to erode. Maybe not against a basket of other major global fiat currencies that are also being inflated, but against hard assets like gold.
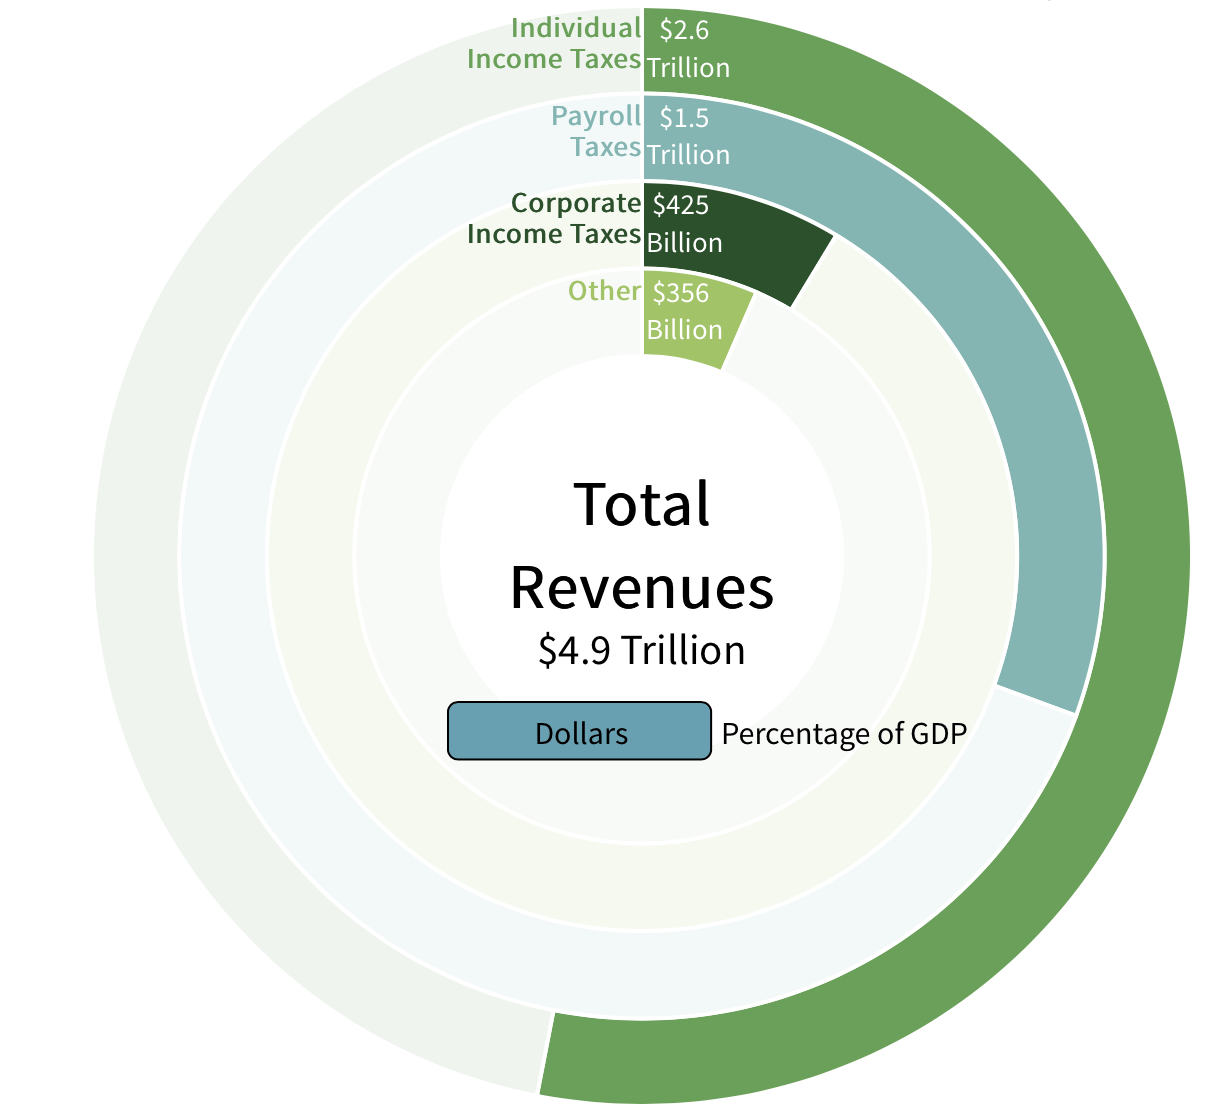
The U.S. ran a $1.3-$1.4 trillion deficit last year. It's projected to run a ~$1.5 trillion deficit this year, and that figure will progressively increase to $2 trillion by 2030. But it's also based on an average interest rate of around 2.7-3.0%. The return to ~6.5% interest on the debt would equate to $1.5-$2.0 trillion just in annual interest payments (which is 4-5x what the U.S. government has been paying) and would add another ~$1 trillion to the annual deficit total.
CBO.gov CBO.gov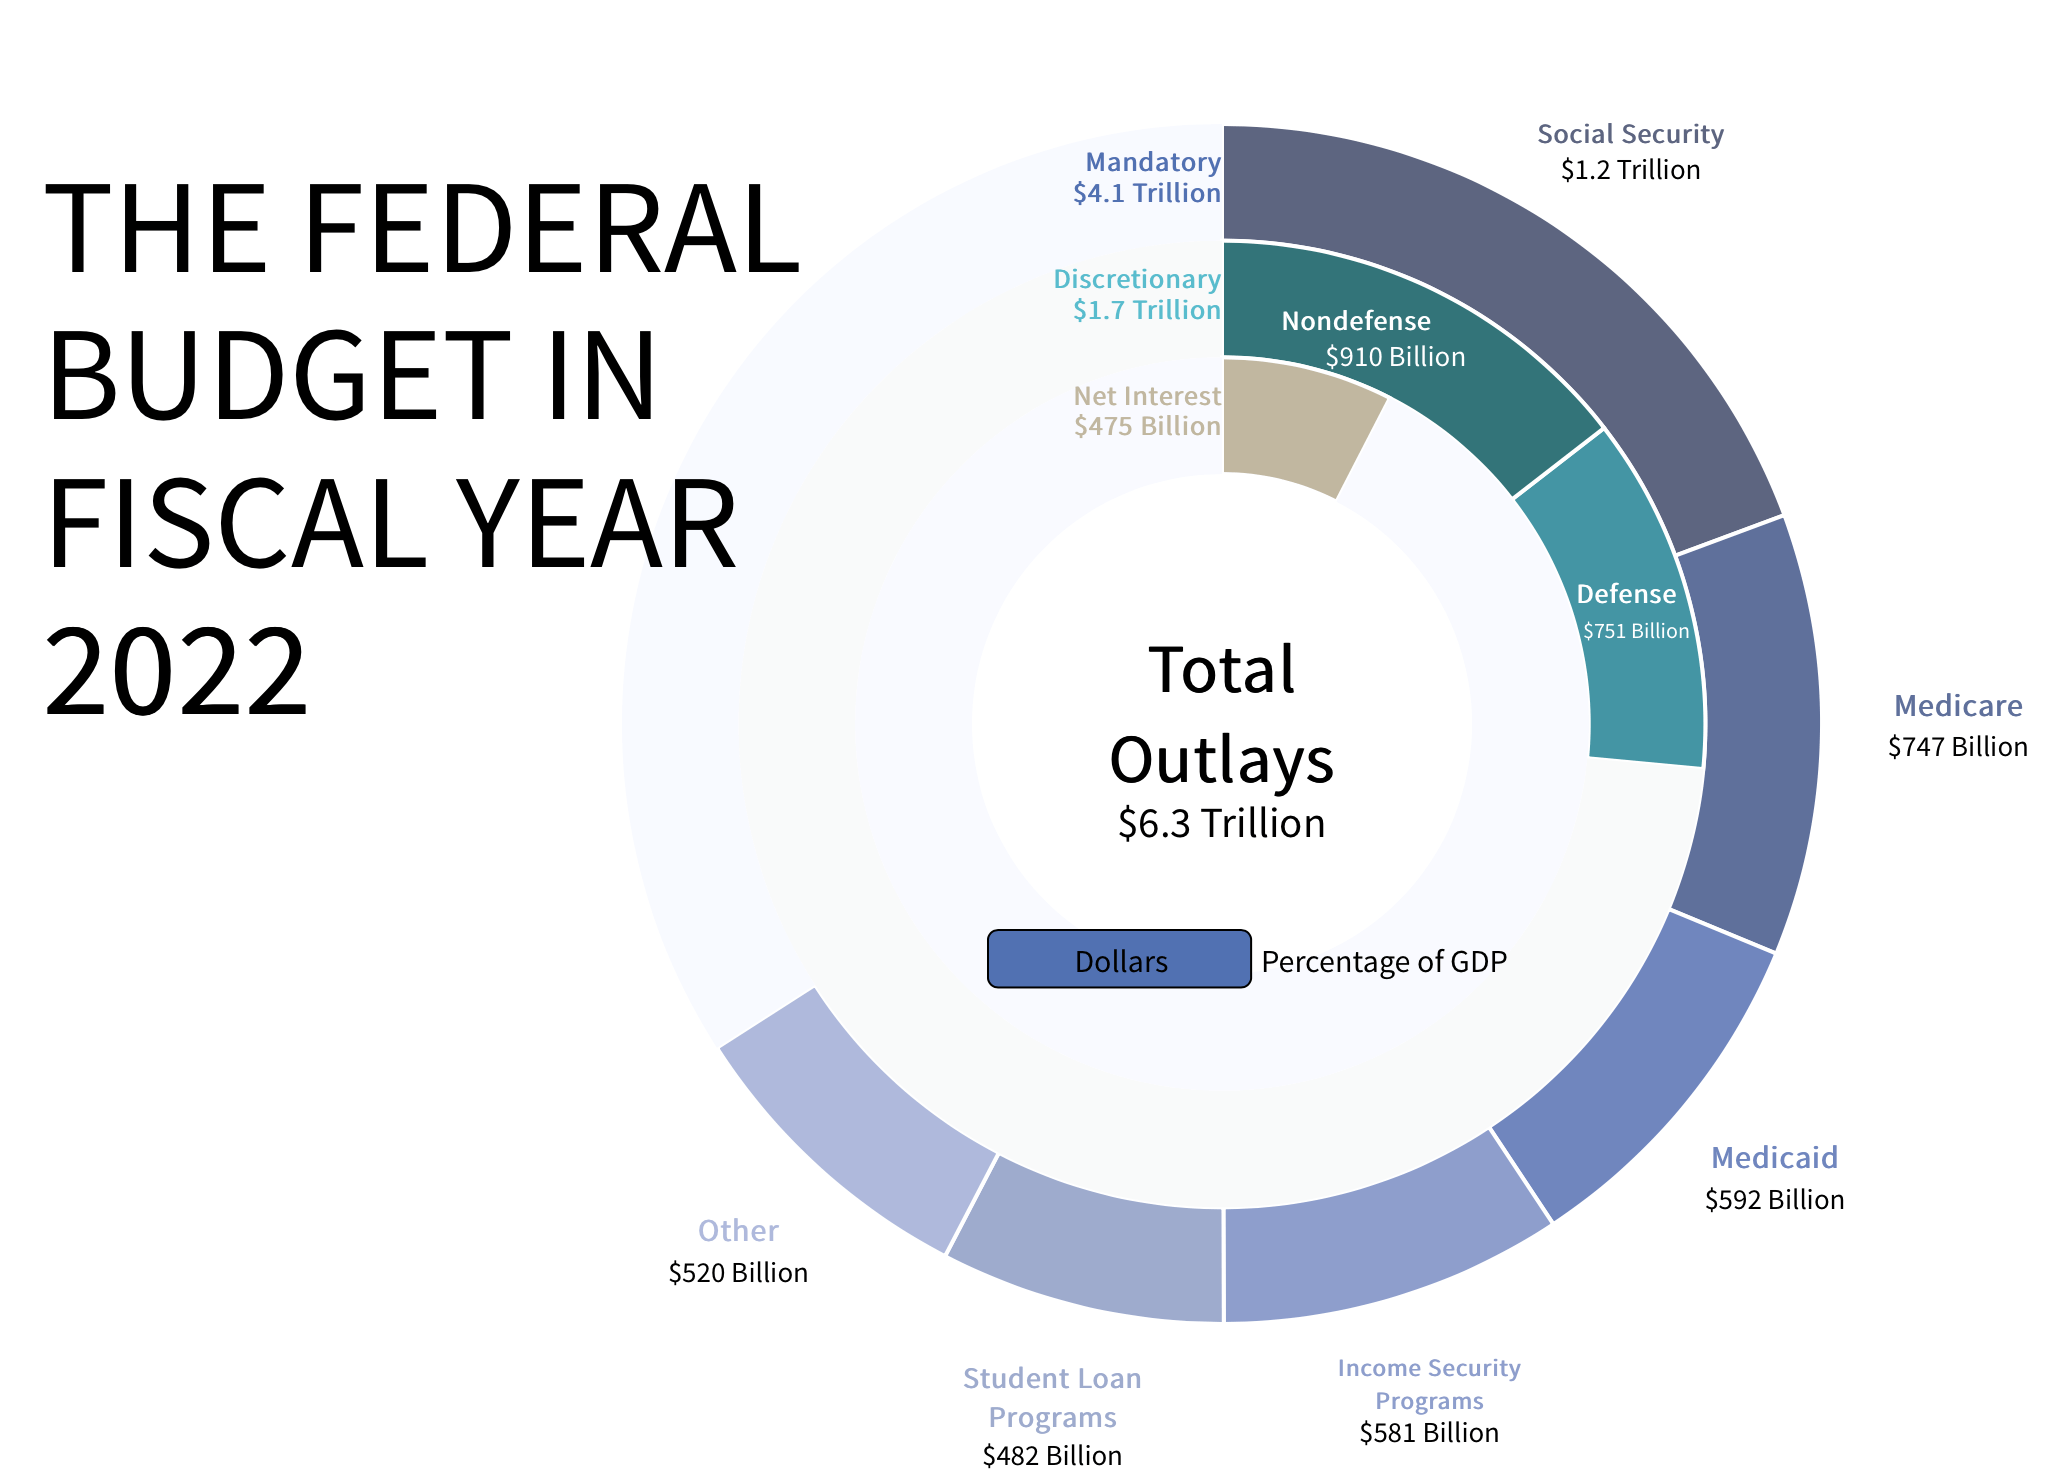
The Fed desperately needs to contain inflation as the U.S. can't afford to pay 5-6% interest on its debt. Unfortunately, once the inflation genie is out of the bottle, it's not easy to put back in. High inflation cycles are typically long in duration and don't just come in one short burst and then disappear. Especially if the government is overloaded with debt. The 1-2% inflationary environment the U.S. was stuck in for years and years is likely over and done with. Which brings us to the next section.
2) Inflation Is Sticky And Comes In Waves
The aggressive increase in the Fed Funds rate is working as we've seen disinflation over the last several quarters. In other words, inflation has peaked in the short term, and the inflation rate is moving lower. However, ex-food and energy, prices are still "sticky" as core PCE remains elevated. I'm not in the camp that the Fed will begin to cut interest rates in the next few months, as I think the more likely outcome will be a holding pattern until the core PCE fever breaks.
FRED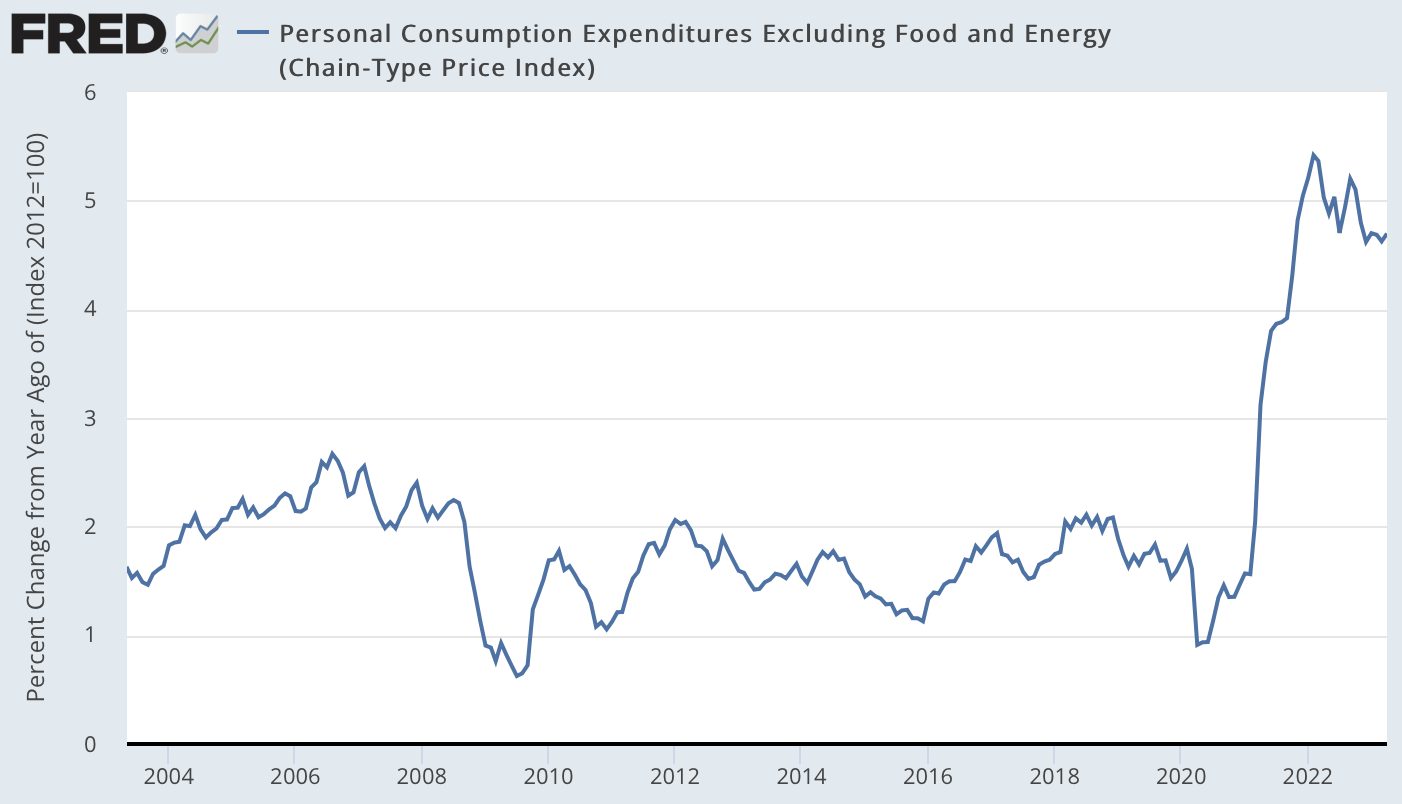
And I do believe it will break in the short term and begin to moderate toward the 3-4% range over the next 3-6 months, given what we are seeing in the economy, global supply chains, money supply, and the Citi Inflation Surprise Index (which continues to decline and has moved into negative territory). PCE inflation could fall even further and move below 3% if economic activity remains subdued, M2 contracts more, and the Fed continues to hold rates steady.
JP Morgan Guide To The Markets (May 31, 2023)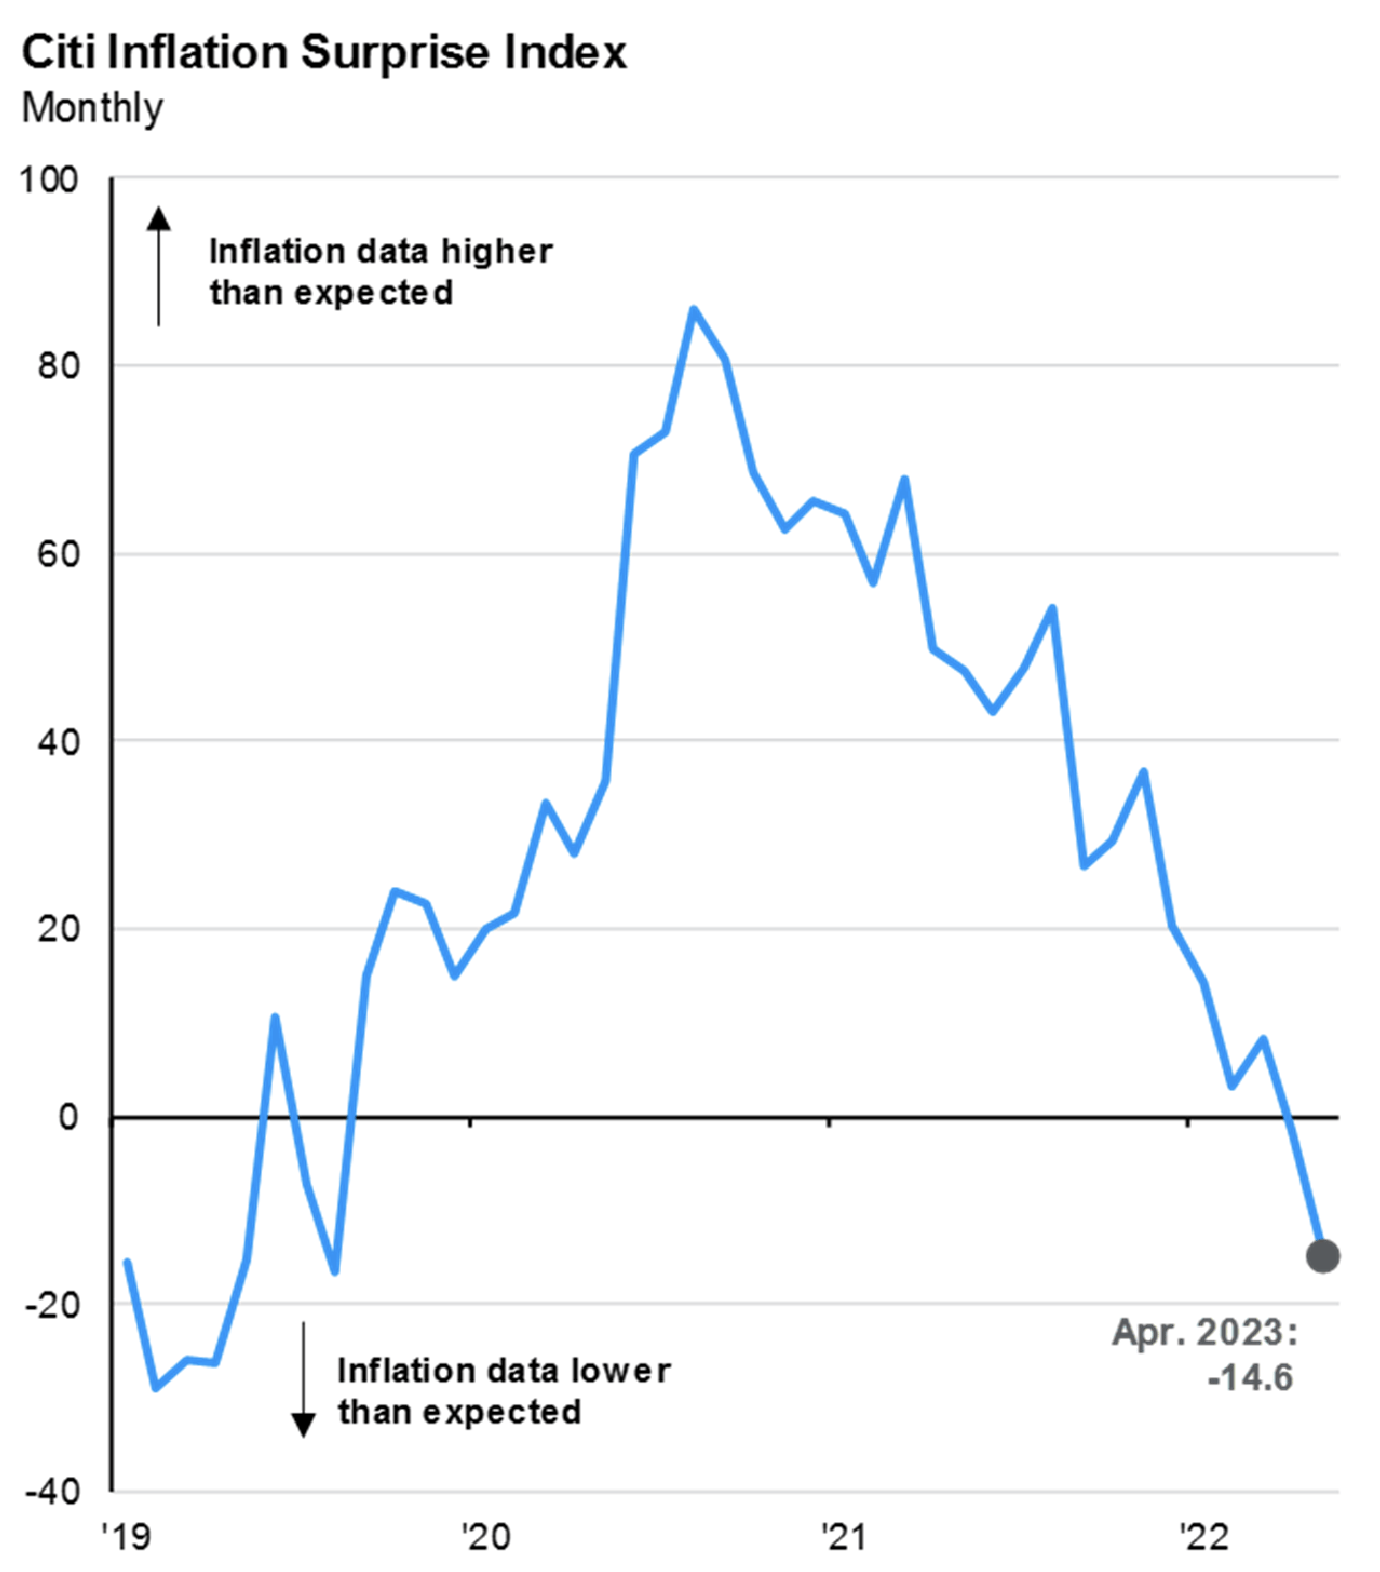
However, I've been saying for the last year that this is only the first inflationary wave, and there will be at least one or two more that will likely be even more extreme than the first one.
While the 2020s might not play out exactly like the 1970s, the last high-inflation decade is a good example of what could take place over the next 5-7 years (if not longer). To combat the first wave of inflation in 1970, the Fed raised rates to 9%. Inflation cooled, the Fed cut rates to 3-4%, but then the second wave hit as the CPI surged by double-digits. That forced the Fed to raise rates to 13%, which contained inflation and allowed the Fed to reduce rates back to 4-5%. Then the third wave came, which saw the worst of the inflation, forcing Volcker and the Fed to raise rates to almost 20%.
FRED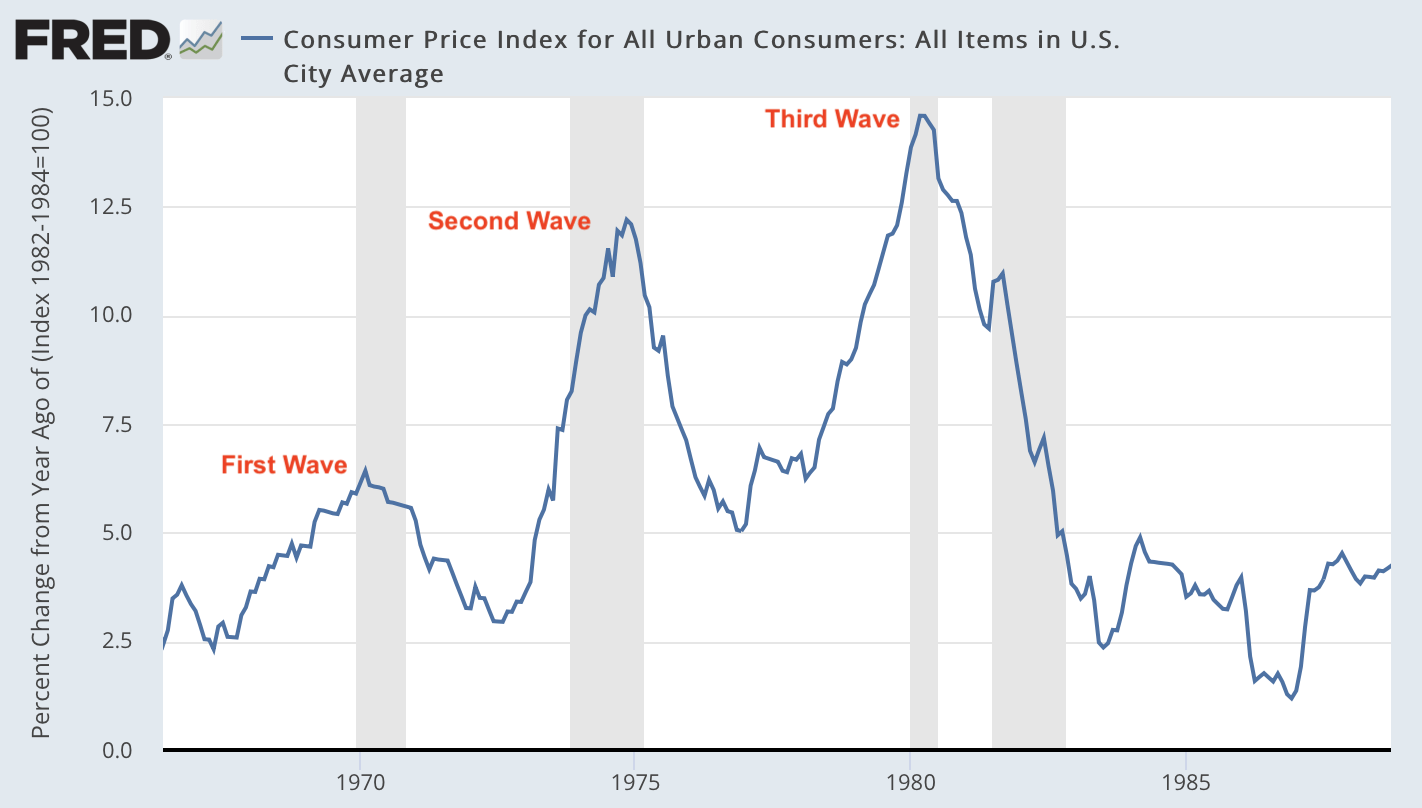
I expect a second inflationary wave that will likely surpass the first wave, which will require an even more aggressive Fed.
Which brings me to the part about gold that I want to clarify, as there is a misassumption by many investors that rising interest rates are bearish for gold. That couldn't be further from the truth.
Looking at the relationship between gold and the Fed Funds rate in the 1970s, we can see the positive correlation, as gold increased with rates. In the late 1970s, as the Fed took rates from 4.5% to 19%, gold more than quadrupled in value. It's real interest rates that are one of the main driving forces for gold (the other being the money supply). If real interest rates are negative (i.e., the rate of inflation is above interest rates), that's bullish for gold as the metal preserves purchasing power.
SomaBull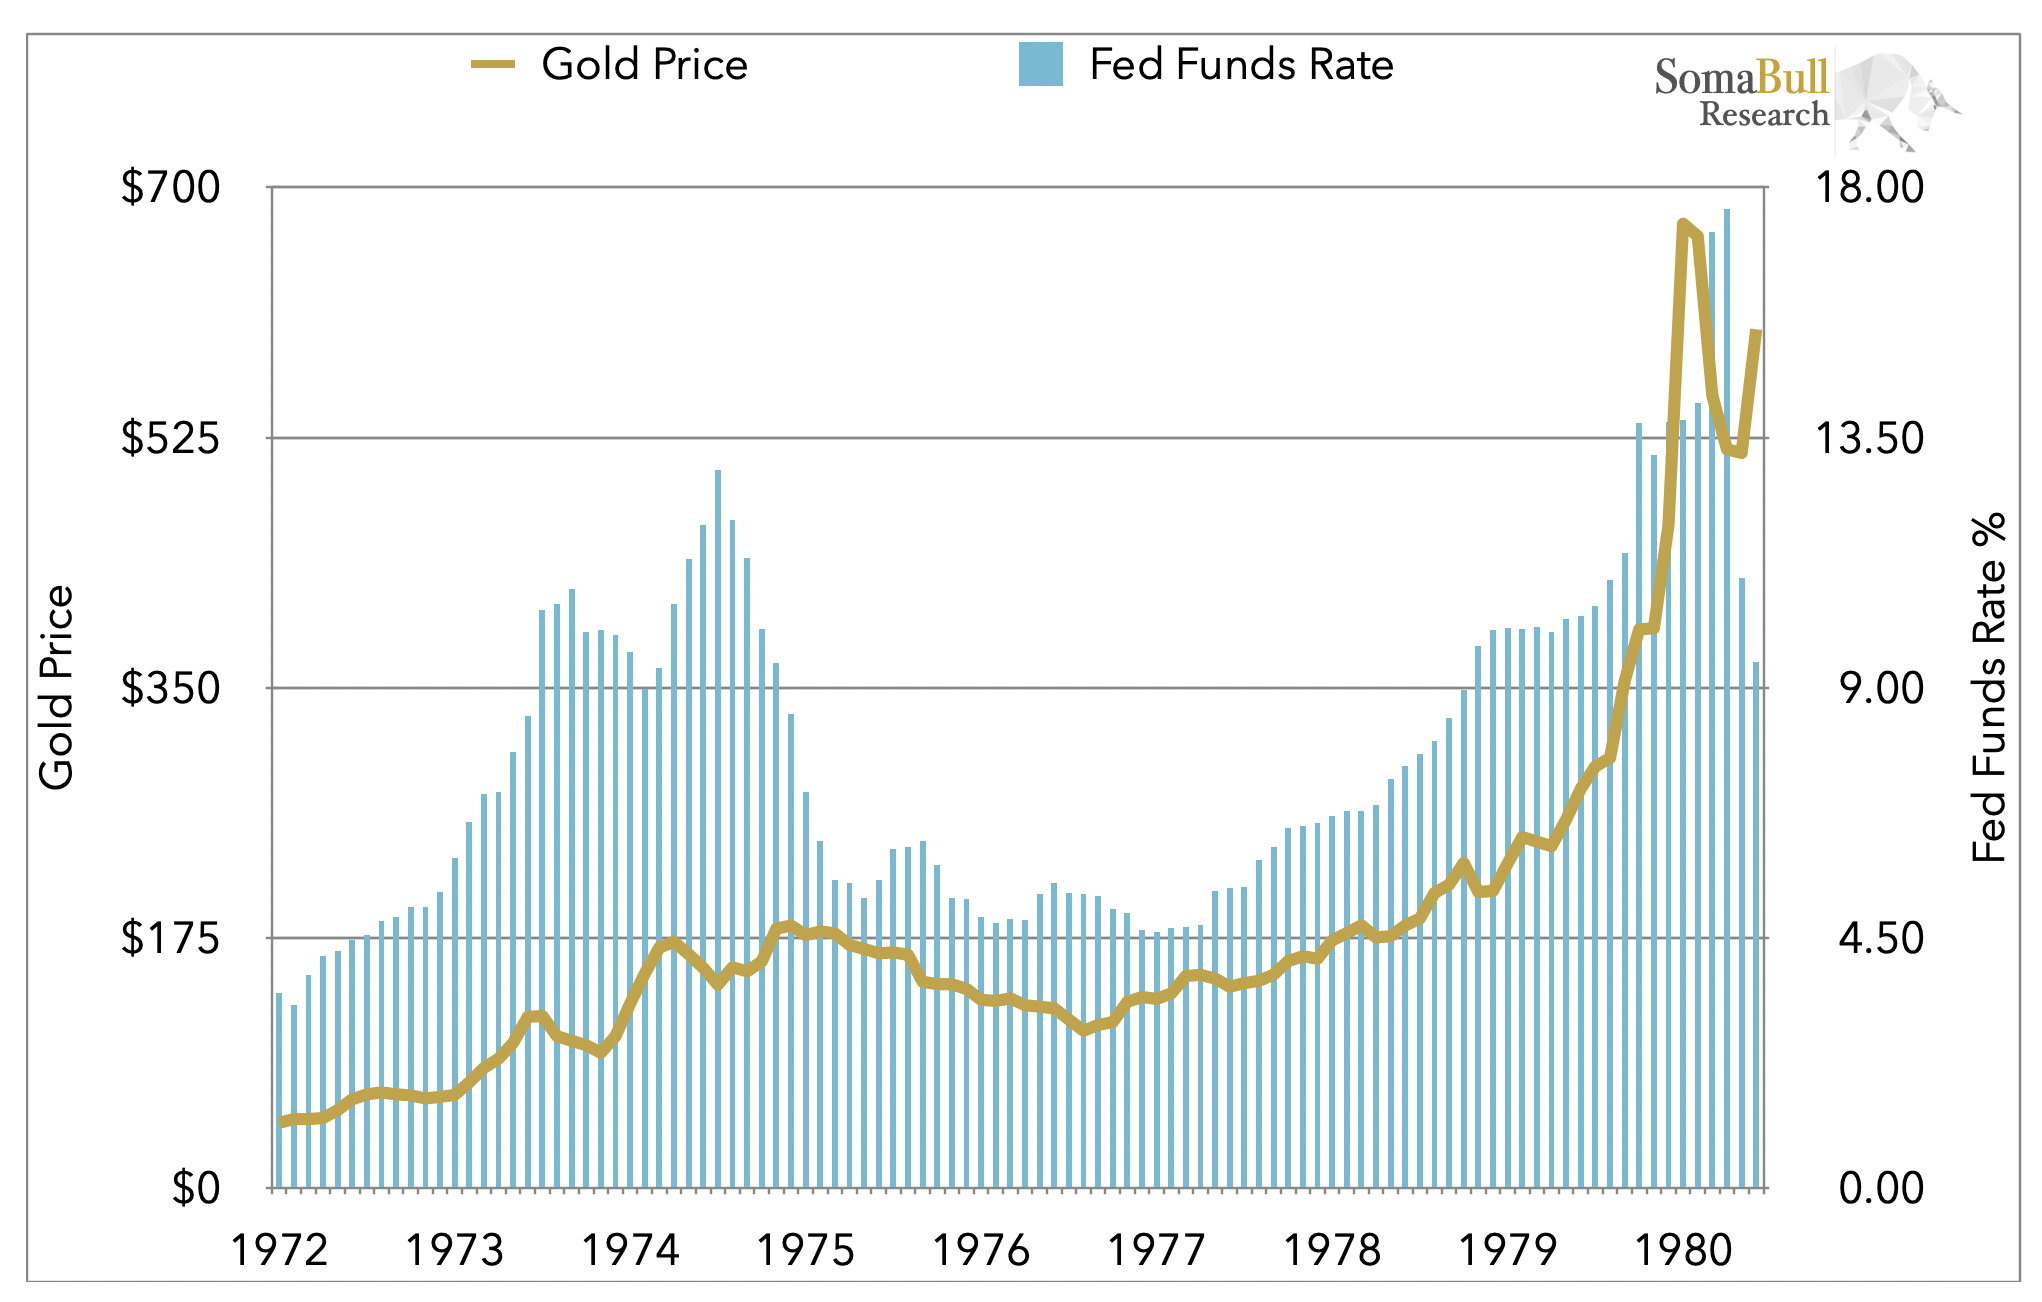
Gold began to tank in price last year when the Fed started raising rates, but the decline in the metal wasn't caused by interest rate hikes; it was the spike in the USD that took gold down. The dollar surged in response to the Fed's aggressive monetary policy actions, as other central banks were slow to respond to inflation and didn't raise rates to the same degree as the U.S. The USD/GOLD performance chart below shows the strong inverse correlation between the dollar and gold over the last ~15 months. Notice how gold bottomed when the USD topped last September/October and how gold has risen sharply since then - from $1,600 to above $2,000. The move off the lows coincided with a Fed Funds rate that went from 3% in September/October 2022 to 5%+ today, as the Fed was still behind the curve (i.e., real interest rates remained well in negative territory). Further proof that rising interest rates aren't bearish for gold.
StockCharts.com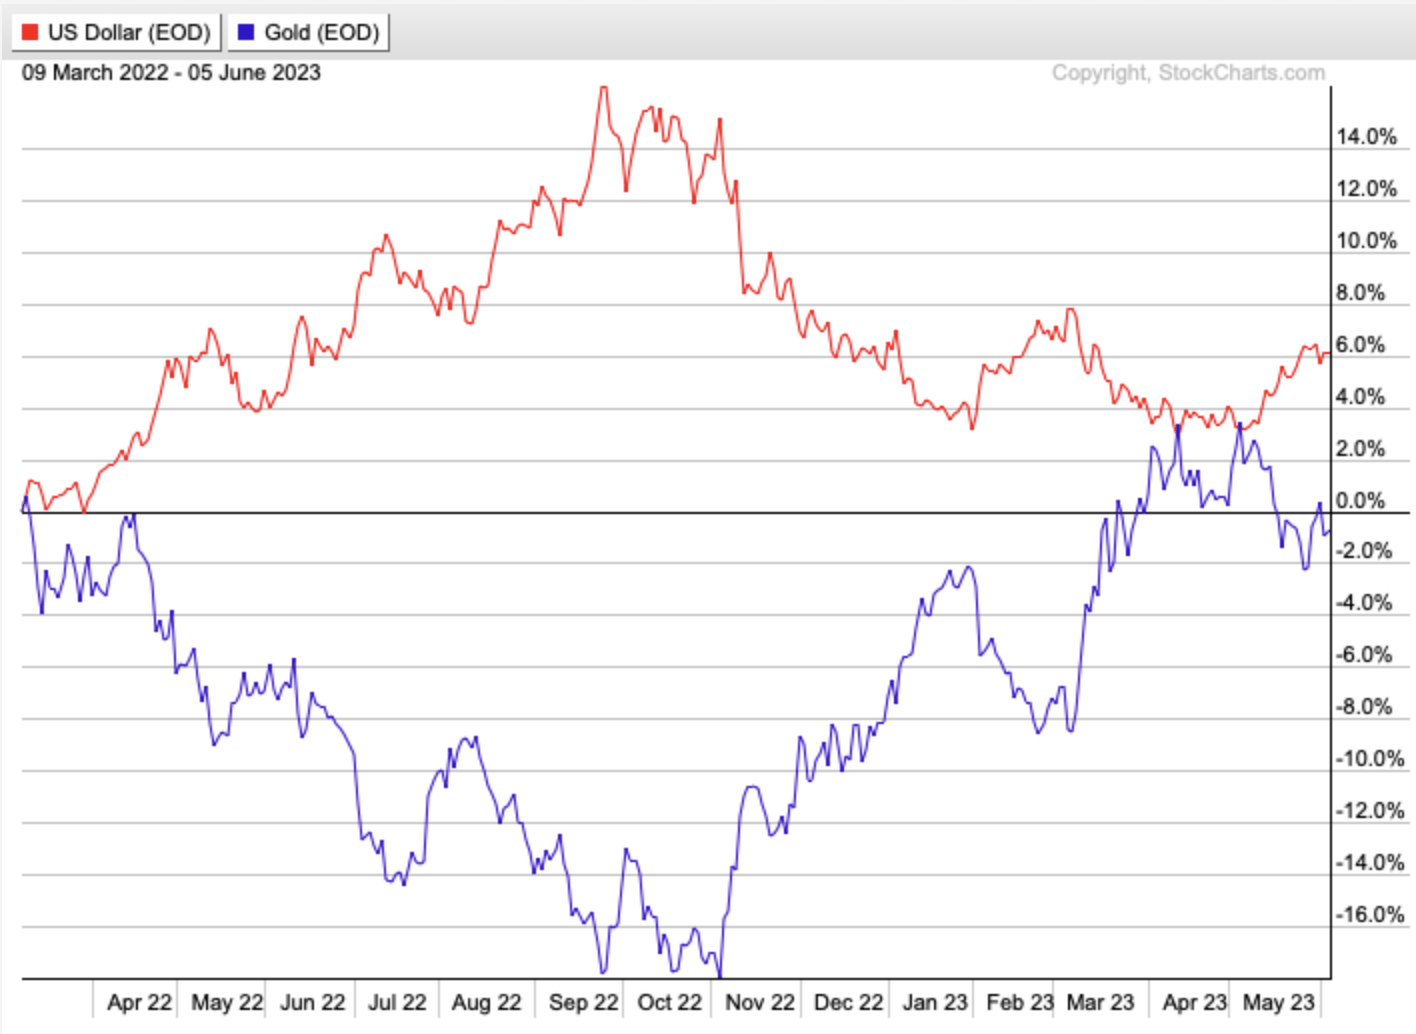
To clarify, there is only a short-term inverse correlation between the USD and gold, for whatever reason (it's likely driven by market misperception and algorithms). Over the long term, there is zero long-term inverse correlation between the two, as the laws of supply and demand won't allow it. It's only during extreme pressures (upwards and downwards) in currency markets when gold is inversely impacted, and that's what we've seen over the past year. In other words, ultra-strong USD price action only acts as a severe headwind for a short period of time. When currency markets eventually calm, gold decouples from the dollar and begins to trade based on fundamentals (i.e., money supply and real interest rates).
A strong USD won't ever prevent gold from reaching its true price.
People's perceptions of how gold works are often wrong/illogical and can't be backed up with facts, which is why these opinions should be ignored.
Back on point, as the second wave of inflation hits, it will force the Fed to step on the gas as they will once again be behind the eight ball (i.e., real interest rates will be negative). Like in the 1970s - and during recent periods of negative real interest rates - gold will respond bullishly.
3) Gold Continues To Perform Well And Remains Undervalued
Given that most investors don't have exposure to gold, many likely ignore the price action in the metal and are unaware of its multi-year/decade bullish trajectory.
While gold won't beat the gains of the hottest tech stock, outperformance is not the purpose of owning the metal. The reason to own gold is to preserve purchasing power, and it's performing well in that regard as it continues to move from the bottom left of the chart to the top right - responding to the increase in the money supply. It's been somewhat of a stealth rally over the last 5-7 years. Gold was hyped up when it approached $2,000 back in 2011, and while it's been mostly forgotten about since then, it keeps chugging along. We can cherry-pick dates to show how the S&P has outperformed gold and vice versa, but for the last one, five, and ~20 years, gold has kept pace with the S&P. In other words, it hasn't hurt to own gold since the 2000s, and I believe that the next 5-10 years very much favor holding gold vs. equities and bonds. Gold is still trading below its fair value (est. $2,200-$2,300) when comparing it to the growth in money supply, and gold tends to far overshoot to the upside during bull markets.
StockCharts.com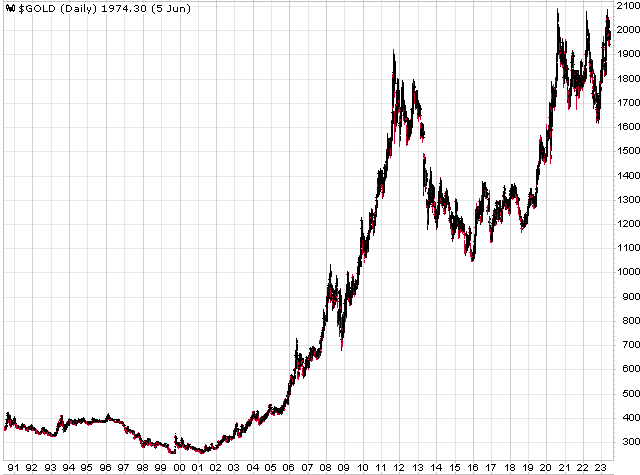
4) Supply/Demand Fundamentals Remain Bullish
While gold has an exceptionally bullish thesis supporting it - based on money supply growth/inflation/debt - there are also constructive supply/demand fundamentals enhancing the story.
Gold struggled in the 1980s as the bubble had deflated and real interest rates were well in positive territory. But what also contributed to the weakness was the almost doubling of the annual gold mine supply from 1980-1990 as the 1970s bull market spurred a spending spree that resulted in significant gold discoveries.
Advancements in heap leaching also boosted production, allowing formerly uneconomical deposits to become profitable.
By the early 1990s, the global mine production was 2,500 tonnes per year.
When demand for any goods or services is flat to declining, and then you double the supply available, that will have an even more negative impact on price.
The gold bull market in the 2000s also spurred new investments and a considerable increase in exploration budgets. This resulted in worldwide annual gold production growing to 3,500 tonnes by the mid-2010s. However, the percent increase in mine supply was drastically less than the previous cycle, and current annual mine production remains below its 2018 peak. Compounding the situation is the number of ounces discovered annually is now a fraction of what it was in the 1990s and throughout most of the 2000s (when ~100 million ounces of gold were being found on average each year). Over the last eight years, only 10-20 million ounces have been discovered annually, which will negatively affect future mine supply.
World Gold Council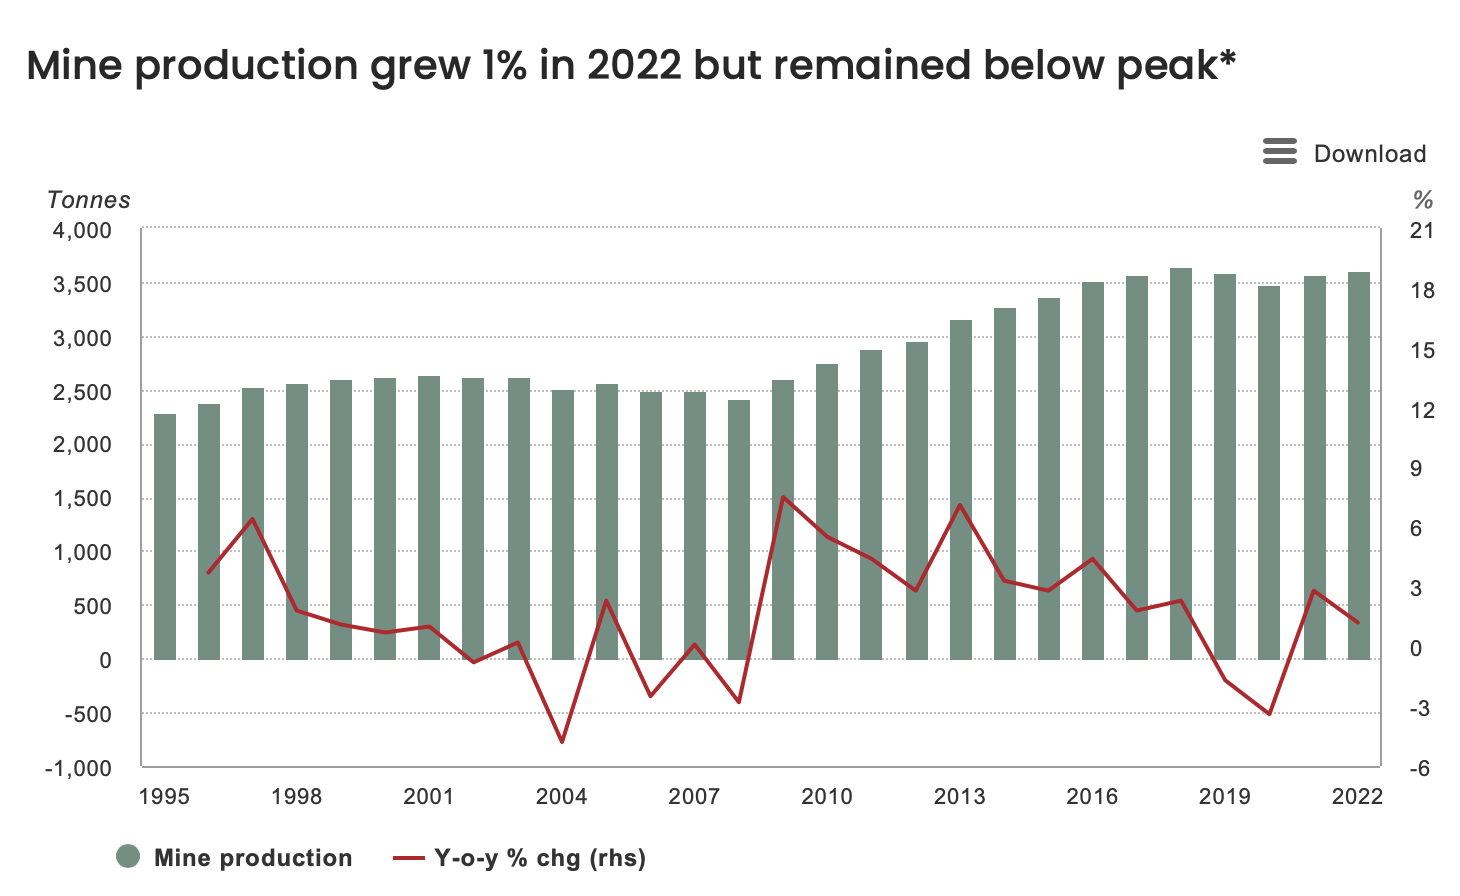
S&P Global stated in a 2022 report:
Our research into the gold production pipeline shows future supply growth, if any, will be relatively minor over the next decade, with even the most optimistic view showing gold production declining by 2028. Although there are several reasons for this, a contributing factor is a lack of quality assets available for development. While nearly half the discoveries included in our analysis are not yet in production, only 33 have over 10 Moz of gold in reserves and resources - enough for a mine to produce over 200,000 ounces per year of gold over a significant mine life. But many of these assets have a long road to production, including feasibility studies and permitting, making them unlikely to have a near- or medium-term impact on the pipeline.
The industry needs to invest more in all levels of the pipeline, from grassroots exploration to locate more quality discoveries to approving funds for construction, to prevent severe supply reductions within the coming years.
Meanwhile, annual gold demand in 2022 - spurred by a surge in central bank buying - was the strongest in over a decade and almost matched the 2011 record high. While CB and investment demand will be the biggest drivers of the gold price - as jewelry and technology demand are usually more flat and predictable - even if overall demand remains at current levels for the foreseeable future, there still won't be enough supply to meet that demand. Which means prices must rise further to get the market in equilibrium.
World Gold Council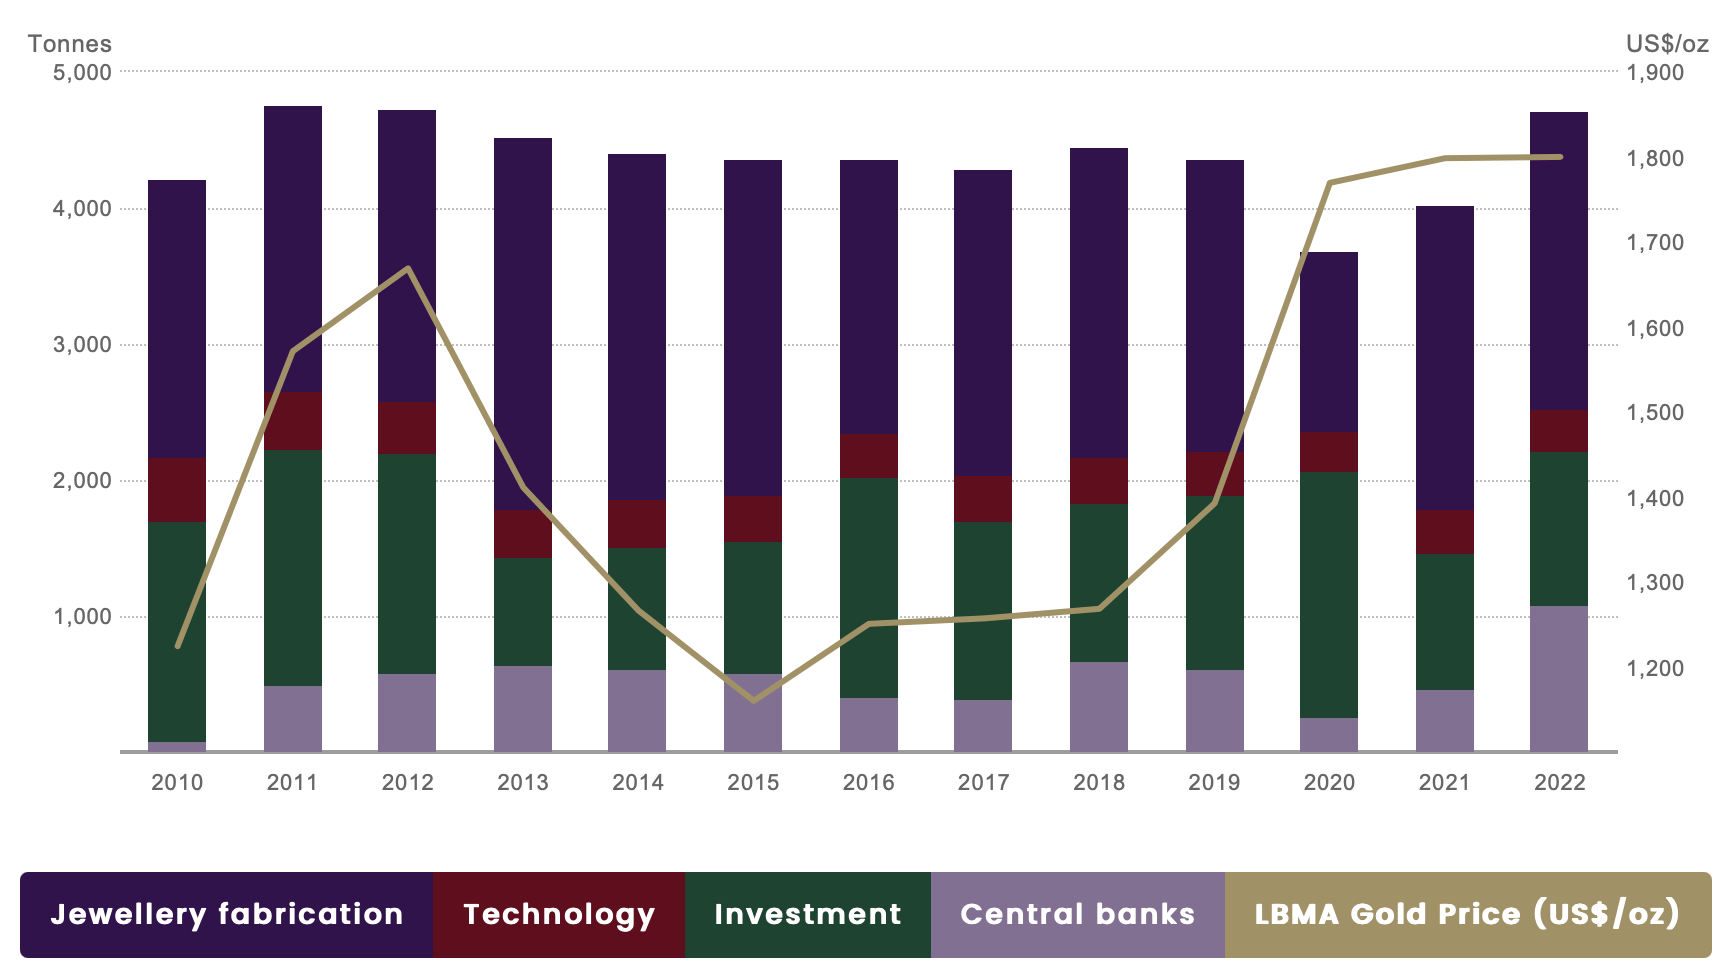
5) Gold Is On The Verge Of A Major Breakout
Gold is now on its third attempt at breaking above the $2,080 level. From April through mid-May 2023, it spent most of its time at or above $2,000. During the two previous attempts, it couldn't hold $2,000 for more than a few days to a week. Gold is showing far more strength this time around as it looks like it wants to move higher.
StockCharts.com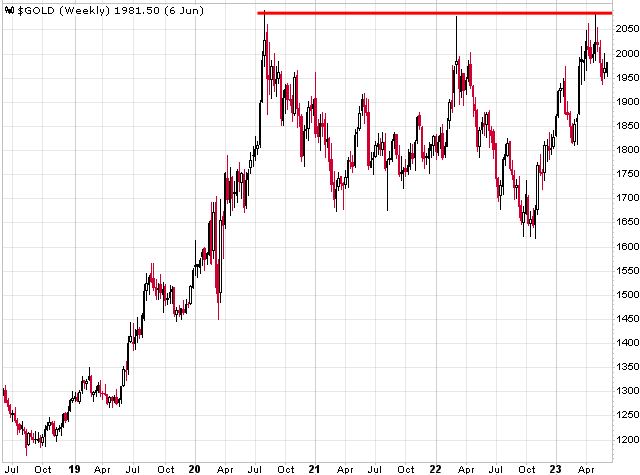
Many don't want to see gold breakout, and the selling pressure is building as shorts try and push gold lower, but new all-time highs are inevitable.
While the timing is unclear, I don't expect it will take years, as I believe it will occur within the next month or two.
Gold could fall another $50-$100 before it reverses and finally breaks out, so by no means are new highs on the immediate horizon.
This setup gives those investors that are unsure about gold something to follow and potentially use as a guide on whether to buy or not and when to buy. With gold under $2,000, there isn't a rush to load up, and it could be conducive to wait for the metal to rebound at least back above $2,000 or reach $2,080+ for good measure. The only risk of not buying at today's price is if there's an overnight event in gold where the price increases by $100-$200. Usually, the chances of that happening are exceedingly low, but we are in an environment where the odds of a jaw-dropping move to the upside are far better than usual. That would be the only reason to have some exposure now for those still on the sidelines.
Depending on interest rates, money supply growth, economic growth, and other factors, gold could quickly increase to $2,300-$2,500 once it gets through resistance. There is also a scenario where $3,000+ gold could be reached by this time next year. Once gold broke through $1,000 in 2009, it doubled in less than two years. So a 20% move to ~$2,500 or 50% move to ~$3,000 aren't unrealistic price assumptions, especially since gold is undervalued relative to M2 and tends to overshoot aggressively. The bottom line is watch for the breakout, as that will set the stage for much higher prices.
Gold has already broken out in other major global currencies (e.g., AUD, EUR, GBP), as this high inflation/debt cycle isn't just isolated to the U.S.
Short-Term Risks For Gold
1) Another Spike In The USD
One thing that could stop gold from rising in value would be an aggressive rebound in the USD. The question is whether that's now even possible.
Looking at the long-term dollar chart, two things stand out: 1) the USD continues to trade well above its mean, and 2) the drop from the recent peak was severe, maybe too much for the dollar to recover from.
JP Morgan Guide To The Markets (May 31, 2023)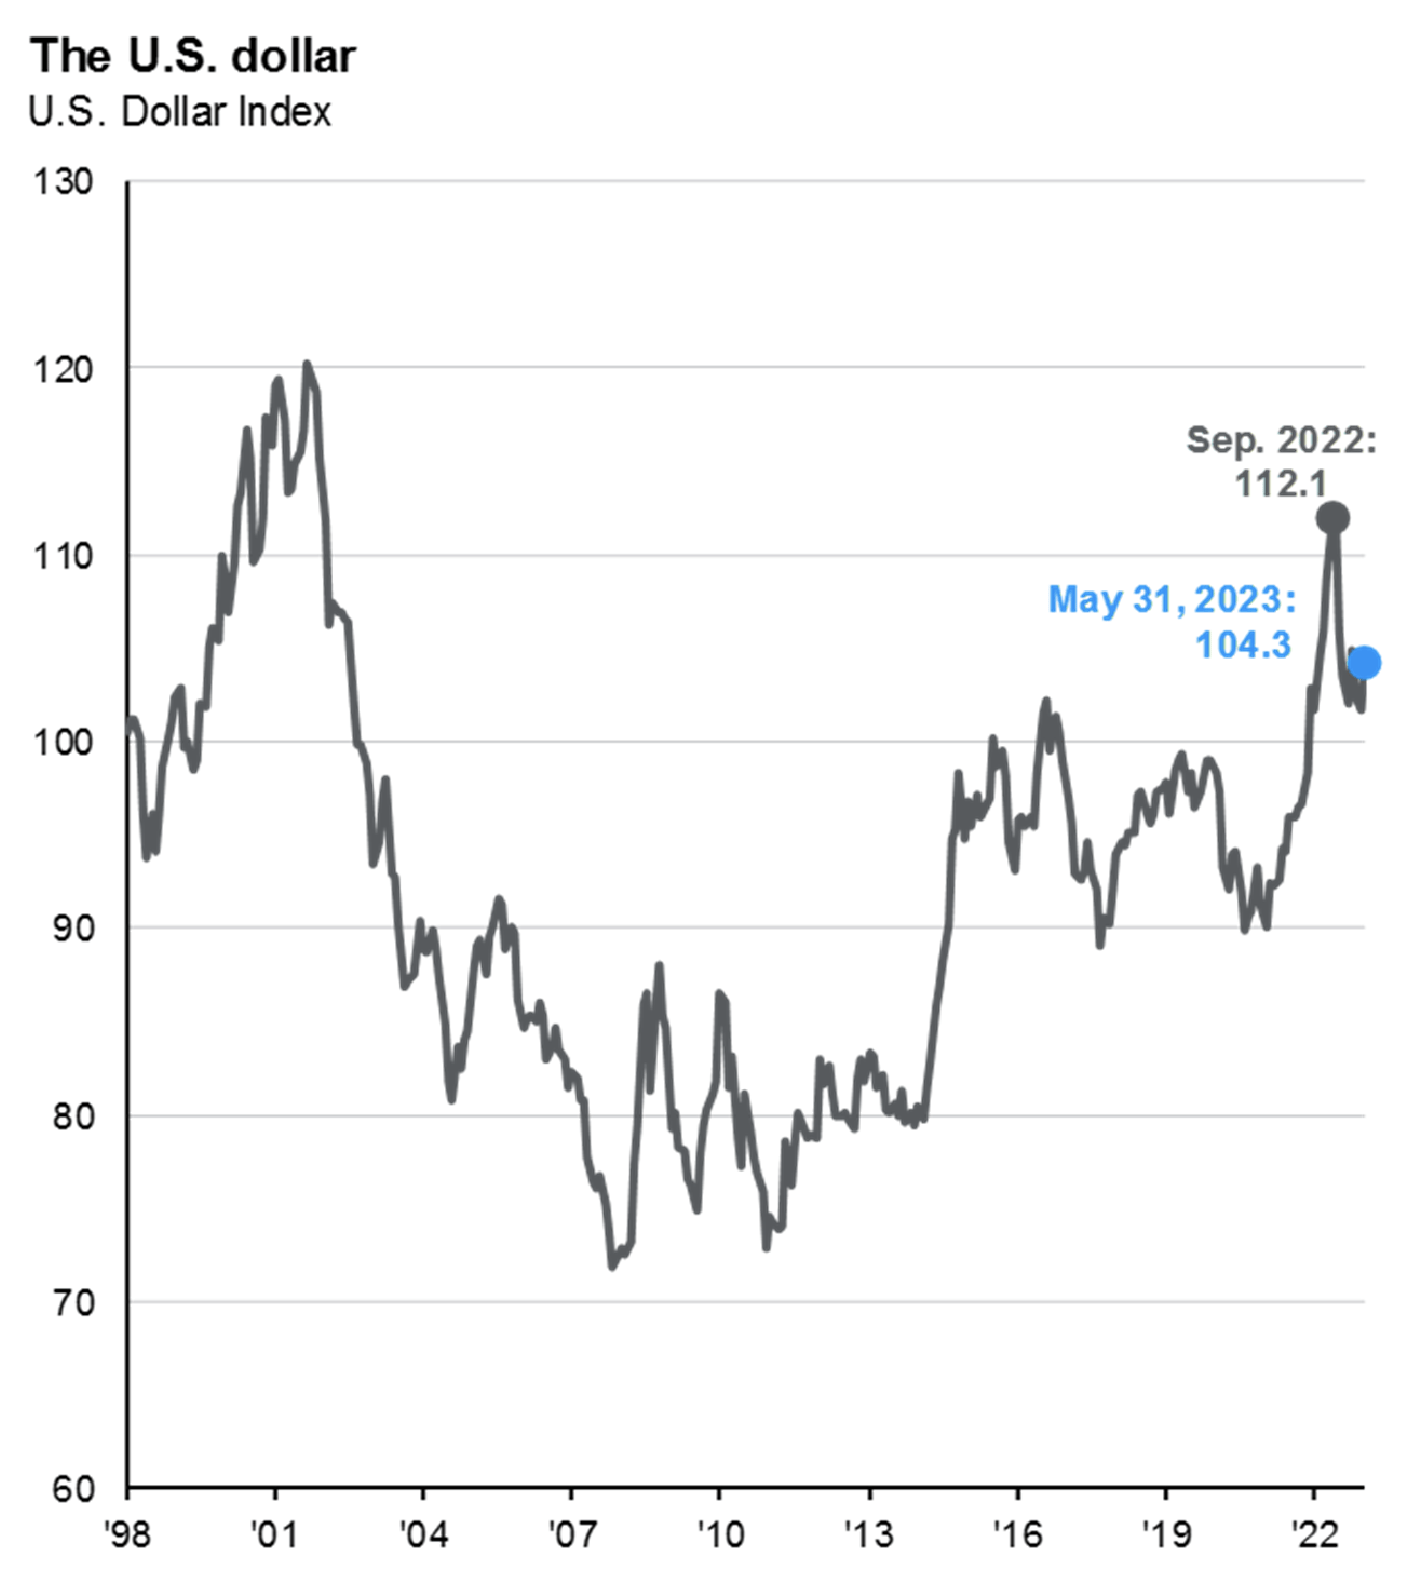
From a valuational and technical perspective, it would be difficult for the USD to gain much strength from its current position, especially considering the disinflation in the U.S. and how the Fed has reached its target rate objective. The prospect of further aggressive Fed tightening seems minuscule in the short term (3-6 months).
There is also growing anti-dollar sentiment at the moment, which will result in continued dollar weakness if countries around the world move away from trading in USD and "de-dollarization" gains more momentum.
Still, currency markets are unpredictable, and it's a race to the bottom for most fiat. If the USD rallies strongly again, it will act as a headwind for gold.
Conversely, if the USD breaks down, it will act as a tailwind.
2) Continued Contraction Of The Money Supply
For the first time since the Great Depression, the U.S. money supply has sharply contracted over the last year, as it's declined by ~$1 trillion since 2022 (or from $21.7 trillion to $20.7 trillion as of the latest April 2023 reading). The shrinking of the Fed's balance sheet via QT and reduction in the monetary base (falling reserve balances), as well as weak demand for credit due to higher rates, are why M2 has dropped. While this fits the definition of deflation, this isn't true deflation, given that the money supply expanded by over $6 trillion (or more than 40%) from early 2020 to early 2022. It was the greatest increase in M2 ever in the U.S. The draining of some of this liquidity doesn't mean the U.S. has suddenly entered a deflationary period.
FRED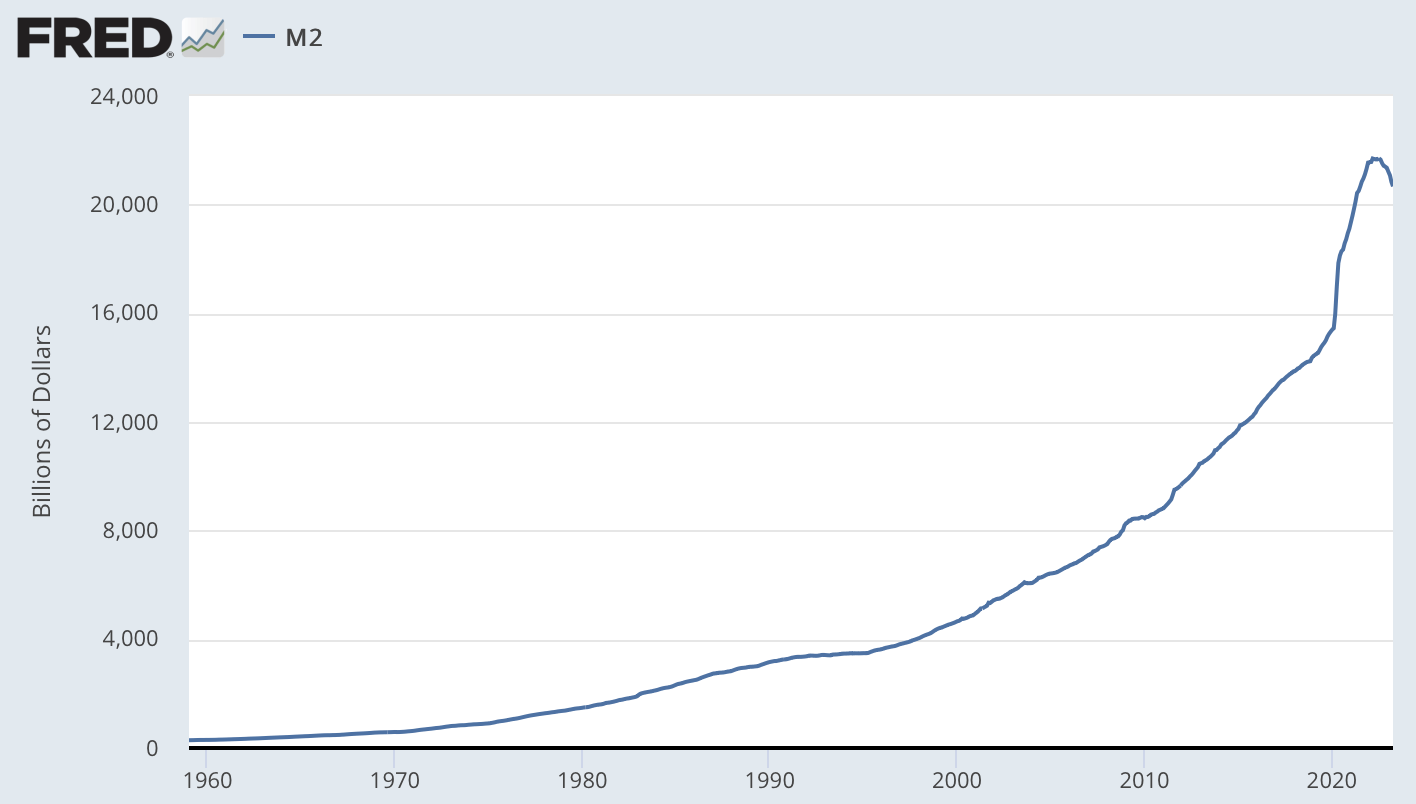
Over the long term, gold keeps pace with M2 as the metal continually moves higher with the money supply, and we can use M2 to determine a rough fair value for gold.
I'm sure the sustained decline in the money stock is one reason for gold's recent price weakness. Should M2 continue to drop to the degree it has over the past 6-9 months, it would exert more downward pressure on gold in the short term.
With the Fed likely pausing on rate hikes and seeing where prices trend before taking any additional monetary policy action, M2 could begin to stabilize around its current level over the subsequent money stock releases. There is also a limit to how much more reserve balances can fall. Eventually, the money supply will expand again, which will signal that the next price inflation wave will soon arrive on shore.
How To Gain Exposure To Gold
There are many ways to gain exposure to gold, with the most popular discussed below. There are other options not mentioned, such as buying gold futures, but these are highly speculative and far too risky for beginning investors, and there are also minimum requirements when purchasing futures.
1) Gold ETFs
If I'm looking to trade gold or only hold it for the short term, I will buy an ETF such as the SPDR Gold Trust ETF (NYSEARCA:GLD). There is counterparty risk with GLD, and many investors have questioned whether the trust actually owns the amount of gold that it says it does (even though audit reports confirm ownership), but GLD has been around since the 2000s and is the largest and most liquid gold ETF, as it holds 30 million ounces of gold worth ~$60 billion. Still, I would never put a sizable amount of my net worth in GLD or any other gold ETF.
2) Physical Gold
Buying physical gold (coins and bars) is the safest option, but the current premium for a 1-ounce gold coin is 10%, and you also have to worry about storage and pay for insurance. Buying physical gold takes far more time, effort, and money. It's also vital to only buy from reputable gold dealers.
3) Gold Mining Stocks
My preferred exposure method to this sector is via gold miners, as they offer 2-3x the leverage to gold, and the vast majority are trading at deep discounts to their NAV. The risk/reward is quite enticing at the moment. However, gold stocks are highly volatile. Moves can be spectacular... and spectacularly jarring.
Click here if you are interested in becoming a member of The Gold Edge.
This article was written by

I’m a private investor with a strong track record of outperformance, and also currently work as a research consultant for high-net-worth clients who invest in the precious metals sector.
My focus was mostly on Tech/Internet when I started investing, but almost 20 years ago I became extremely interested in the gold and silver sector as I anticipated a major bull run.
I’ve been doing in-depth research on gold and silver miners since then. I'm familiar with their stories, their stock patterns, their highs and lows, their operations/projects, their successes and failures, their management teams and turnover at the top, and all other facets of these precious metal companies.
This sector is my singular focus as I expect a massive bull market will unfold. These mining stocks are the cheapest they have been in over a decade, some in fact, are near multi-decade lows as they are oversold and significantly undervalued. I expect strong appreciation in these mining stocks as the bull market in gold and silver recommences.
I believe in buying value, and not chasing the next hot stock. I use several basic investing principles, the main one being buying the balance sheet. I wait for opportunities to present themselves and then establish positions. I believe in doing your homework, and I have a very research intensive focus.
*Disclaimer* I am not a Certified Financial Advisor. My research and articles should not be interpreted as a recommendation to purchase, sell, or hold any security at any time. The accuracy, completeness, or timeliness of the information posted in my articles is not guaranteed. Do not rely on any statement that I make in my articles. All readers and subscribers should always conduct their own research and should consult a professional financial advisor when it comes to making investment decisions.
Analyst’s Disclosure: I/we have no stock, option or similar derivative position in any of the companies mentioned, and no plans to initiate any such positions within the next 72 hours. I wrote this article myself, and it expresses my own opinions. I am not receiving compensation for it (other than from Seeking Alpha). I have no business relationship with any company whose stock is mentioned in this article.
Seeking Alpha's Disclosure: Past performance is no guarantee of future results. No recommendation or advice is being given as to whether any investment is suitable for a particular investor. Any views or opinions expressed above may not reflect those of Seeking Alpha as a whole. Seeking Alpha is not a licensed securities dealer, broker or US investment adviser or investment bank. Our analysts are third party authors that include both professional investors and individual investors who may not be licensed or certified by any institute or regulatory body.