Sierra Bancorp: Attractive Dividend Yield With A Stable Earnings Outlook, But Price Is High

Summary
- The recent deterioration of the asset and deposit mixes will shrink the margin.
- The risk level is currently above average because of the location and a large balance of uninsured deposits.
- The December 2023 target price suggests a small downside from the current market price. Further, BSRR is offering a high dividend yield.

KeithBinns
Earnings of Sierra Bancorp (NASDAQ:BSRR) will likely remain flattish this year as gains in the loan portfolio size will counter a contraction in the net interest margin. I’m expecting the company to report earnings of $2.26 per share for 2023, up by just 1% from last year. Compared to my last report on the company, I haven’t changed my earnings estimate much. The year-end target price is quite close to the current market price. Therefore, I’m maintaining a hold rating on Sierra Bancorp.
Asset and Deposit Mix Deterioration to Hurt the Margin
As expected, the net interest margin dropped by 16 basis points during the first quarter of 2023. The pressure on the margin was attributable to the deterioration of both the asset and deposit mixes. On the asset side, the proportion of loans fell while the proportion of lower-yielding securities increased during the quarter. The full-quarter impact of this change will be visible in the second quarter’s results.
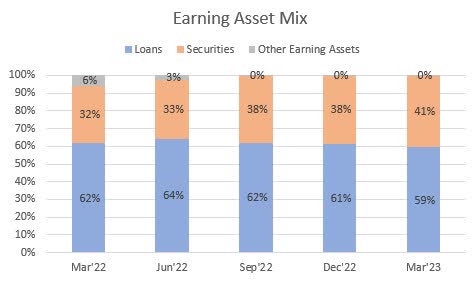
SEC Filings
Further, the proportion of non-interest-bearing deposits in total deposits dropped to 35.3% by the end of March 2023 from 38.2% at the end of December 2022. I’m expecting the deposit mix to worsen even further as a result of consumer behavior in the current high-rate environment. Therefore, further margin compression is likely in the remainder of the year.
Management’s rate sensitivity analysis given in the 10-Q filing shows that both an increase and a decrease in interest rates could hurt the net interest income.
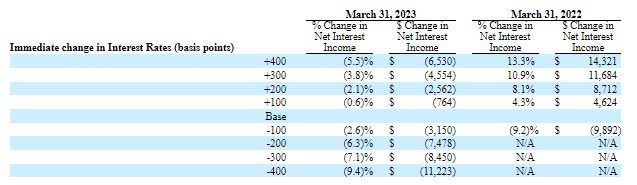
1Q 2023 10-Q Filing
I’m expecting the Fed to increase the Fed funds rate by 25 basis points in June before holding it steady for the remainder of the year. Considering these factors, I’m expecting the net interest margin to dip by a cumulative 25 basis points in the second and third quarters of 2023 before rising by around five basis points in the last quarter of this year.
Conflicting Factors to Keep Loan Growth Subdued
Sierra Bancorp’s loan portfolio dipped by 0.9% during the first quarter of the year. For the remainder of the year, I’m expecting growth to turn positive but remain subdued.
The company operates mainly in San Joaquin Valley (northern California), the Central Coast, and Ventura County (southern California). This location is interesting because the banks that suffered from the recent runs on banks, SVB Financial (OTCPK:SIVBQ) and First Republic Bank (OTCPK:FRCB), also had big exposure to the state of California. Despite the market overlap, Sierra Bancorp’s deposits grew at a healthy rate of 3.6% during the first quarter, which shows that this company has the trust of its customers and it’s safe from deposit runs on the bank. As mentioned above, the deposit growth was also attributable to high-rate deposit accounts that attracted customers. I believe the positive deposit trend will continue for the remainder of the year.
The easy deposit availability will be conducive to loan growth in the year ahead. Further, California’s healthy economy will support loan growth. The trendline for the state’s economic activity index has flattened this year (see below), but the slope is still positive and at par with the slope for the national average.
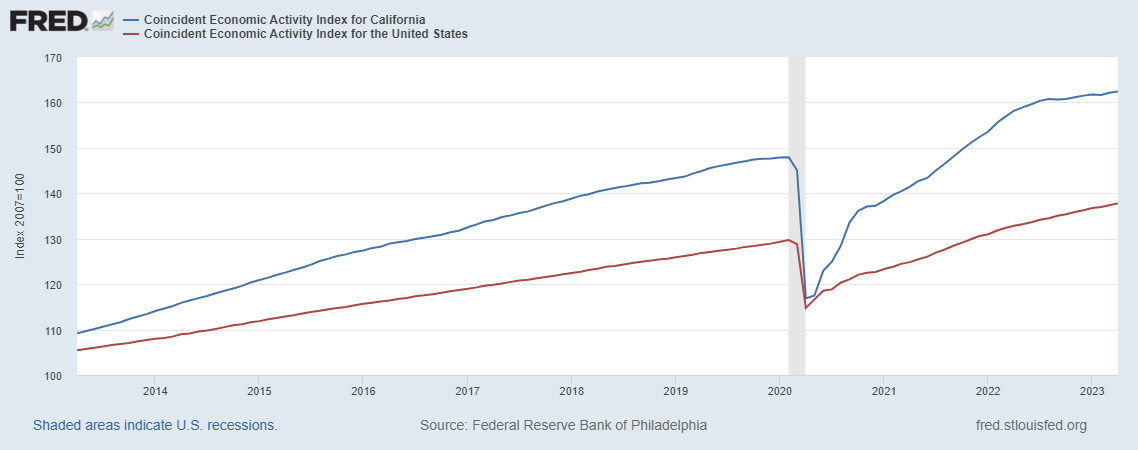
The Federal Reserve Bank of Philadelphia
As a result, I’m expecting upcoming loan growth to be better than first quarter growth. However, due to the high-rate environment, I’m expecting growth to be below the historical average. I’m expecting loan growth of 0.56% for 2023, which is below the 5-year CAGR of 5.6%. The following table shows my balance sheet estimates.
| Financial Position | FY18 | FY19 | FY20 | FY21 | FY22 | FY23E |
| Net Loans | 1,725 | 1,756 | 2,442 | 1,974 | 2,030 | 2,041 |
| Growth of Net Loans | 11.2% | 1.8% | 39.1% | (19.2)% | 2.8% | 0.6% |
| Other Earning Assets | 562 | 601 | 547 | 1,168 | 1,276 | 1,396 |
| Deposits | 2,116 | 2,168 | 2,625 | 2,782 | 2,846 | 2,993 |
| Borrowings and Sub-Debt | 107 | 81 | 217 | 191 | 413 | 402 |
| Common equity | 273 | 309 | 344 | 362 | 304 | 322 |
| Book Value Per Share ($) | 17.7 | 20.0 | 22.5 | 23.6 | 20.2 | 21.5 |
| Tangible BVPS ($) | 15.5 | 17.9 | 20.4 | 21.6 | 18.3 | 19.5 |
| Source: SEC Filings, Author's Estimates(In USD million unless otherwise specified) | ||||||
Expecting Flattish Earnings for 2023
The anticipated margin compression will likely counter the effect of subdued loan growth. As a result, I’m expecting the company to report earnings of $2.26 per share for 2023, up by just 1% year-over-year. The following table shows my income statement estimates.
| Income Statement | FY18 | FY19 | FY20 | FY21 | FY22 | FY23E |
| Net interest income | 92 | 97 | 105 | 109 | 110 | 109 |
| Provision for loan losses | 4 | 3 | 9 | (4) | 11 | 5 |
| Non-interest income | 22 | 23 | 26 | 28 | 31 | 30 |
| Non-interest expense | 70 | 71 | 76 | 84 | 85 | 89 |
| Net income - Common Sh. | 30 | 36 | 35 | 43 | 34 | 34 |
| EPS - Diluted ($) | 1.92 | 2.33 | 2.32 | 2.80 | 2.24 | 2.26 |
| Source: SEC Filings, Earnings Releases, Author's Estimates(In USD million unless otherwise specified) | ||||||
In my last report on Sierra Bancorp, I estimated earnings of $2.25 per share for 2023, which is quite close to my updated earnings estimate. The first quarter’s results were mostly in line with my expectations; therefore, I didn’t feel a need to change my estimates significantly.
Above Average Risk Level
Risks are currently elevated because of the following reasons.
- Sierra Bancorp operates in California; therefore, it shares its markets with other banks that have suffered from deposit runs on the bank, namely First Republic and SVB Financial. As a result, Sierra Bancorp faces high contagion risk.
- Uninsured deposits made up a sizable 30% of total deposits at the end of March 2023, as mentioned in the 10-Q filing. The deposit growth in the first quarter shows that it’s highly unlikely the company will face a deposit run on the bank. Therefore, I’m not too worried about the uninsured deposits. Nevertheless, there is a chance, albeit slim, that there will be a run on the bank and that the company will struggle to find alternate sources of funding to cover these uninsured deposits.
- Unrealized losses on the Available-for-Sale securities portfolio amounted to $50 million at the end of March 2023, which is around 16% of the total equity balance. However, I’m fairly confident that the company won’t feel the need to sell its securities portfolio and realize this loss. The likeliest scenario is that these losses will reverse when interest rates start declining next year.
BSRR is Offering a High Dividend Yield but a Slight Price Downside
Sierra Bancorp is offering a high dividend yield of 5.4% at the current quarterly dividend rate of $0.23 per share. The earnings and dividend estimates suggest a payout ratio of 41% for 2023, which is higher than the five-year average of 34%. Nevertheless, a payout ratio of 41% seems sustainable; therefore, the dividend appears secure.
I’m using the peer average price-to-tangible book (“P/TB”) and price-to-earnings (“P/E”) multiples to value Sierra Bancorp. Peers are trading at an average P/TB ratio of 0.94 and an average P/E ratio of 6.9, as shown below.
| BSRR | TCBX | MVBF | CIVB | FBIZ | FISI | Peer Average | |
| P/E ("ttm") | 7.35 | 10.33 | 17.31 | 5.82 | 6.51 | 5.16 | 9.03 |
| P/E ("fwd") | 7.16 | 7.23 | 8.48 | 5.46 | 7.76 | 5.65 | 6.92 |
| P/B ("ttm") | 0.83 | 0.61 | 0.98 | 0.75 | 1.01 | 0.66 | 0.80 |
| P/TB ("ttm") | 0.92 | 0.64 | 0.99 | 1.22 | 1.06 | 0.81 | 0.94 |
| Source: Seeking Alpha | |||||||
Multiplying the average P/TB multiple with the forecast tangible book value per share of $19.50 gives a target price of $18.40 for the end of 2023. This price target implies a 7.7% upside from the June 7 closing price. The following table shows the sensitivity of the target price to the P/TB ratio.
| P/TB Multiple | 0.74x | 0.84x | 0.94x | 1.04x | 1.14x |
| TBVPS - Dec 2023 ($) | 19.5 | 19.5 | 19.5 | 19.5 | 19.5 |
| Target Price ($) | 14.5 | 16.5 | 18.4 | 20.4 | 22.3 |
| Market Price ($) | 17.1 | 17.1 | 17.1 | 17.1 | 17.1 |
| Upside/(Downside) | (15.2)% | (3.8)% | 7.7% | 19.1% | 30.5% |
| Source: Author's Estimates |
Multiplying the average P/E multiple with the forecast earnings per share of $2.26 gives a target price of $15.60 for the end of 2023. This price target implies an 8.8% downside from the June 7 closing price. The following table shows the sensitivity of the target price to the P/E ratio.
| P/E Multiple | 4.9x | 5.9x | 6.9x | 7.9x | 8.9x |
| EPS 2023 ($) | 2.26 | 2.26 | 2.26 | 2.26 | 2.26 |
| Target Price ($) | 11.1 | 13.3 | 15.6 | 17.9 | 20.1 |
| Market Price ($) | 17.1 | 17.1 | 17.1 | 17.1 | 17.1 |
| Upside/(Downside) | (35.2)% | (22.0)% | (8.8)% | 4.3% | 17.5% |
| Source: Author's Estimates |
Equally weighting the target prices from the two valuation methods gives a combined target price of $17.00, which implies a 0.6% downside from the current market price. Adding the forward dividend yield gives a total expected return of 4.8%. Hence, I’m maintaining a hold rating on Sierra Bancorp.
This article was written by

Analyst’s Disclosure: I/we have no stock, option or similar derivative position in any of the companies mentioned, and no plans to initiate any such positions within the next 72 hours. I wrote this article myself, and it expresses my own opinions. I am not receiving compensation for it (other than from Seeking Alpha). I have no business relationship with any company whose stock is mentioned in this article.
Disclaimer: This article is not financial advice. Investors are expected to consider their investment objectives and constraints before investing in the stock(s) mentioned in the article.
Seeking Alpha's Disclosure: Past performance is no guarantee of future results. No recommendation or advice is being given as to whether any investment is suitable for a particular investor. Any views or opinions expressed above may not reflect those of Seeking Alpha as a whole. Seeking Alpha is not a licensed securities dealer, broker or US investment adviser or investment bank. Our analysts are third party authors that include both professional investors and individual investors who may not be licensed or certified by any institute or regulatory body.