The S&P GARP Index Series Expands To Include S&P MidCap 400 And S&P SmallCap 600 Versions

Summary
- The S&P GARP Index Series has outperformed corresponding benchmarks since its launch in 2019, focusing on companies with consistent earnings, sales growth, and reasonable valuations.
- The S&P MidCap 400 GARP Index and the S&P SmallCap 600 GARP Index have also outperformed their benchmarks across all periods studied.
- The S&P GARP Indices have had a noticeable overweight in Consumer Discretionary and an underweight in Financials, Consumer Staples, Utilities, and Communication Services.
SeanShot
By Wenli Bill Hao
The S&P 500® GARP (Growth at a Reasonable Price) Index was launched in February 2019 to strike a balance between pure growth and pure valuation. Due to its popularity among market participants, this index series has recently been expanded to include the S&P MidCap 400® GARP Index and the S&P SmallCap 600 GARP® Index.
The S&P GARP Index Series strives to select companies with consistent earnings and sales growth, as well as strong earnings power, solid financial strength and reasonable valuation. Since the launch of the S&P 500 GARP Index, global economies have weathered the COVID-19 pandemic and the ongoing Ukraine-Russia conflict. As a result, high inflation and rising interest rates have been hallmarks of this time period. From the beginning of 2020 through to the end of May 2023, it is interesting to note that all three S&P GARP indices have outperformed their corresponding benchmarks (See Exhibit 1) by a wide margin. Therefore, selecting profitable growth stocks with more reasonable valuations has been a worthwhile strategy during this period.

In this blog, we will examine the S&P GARP Indices’ construction methodology, historical performance, sector compositions and factor exposures.
Methodology Overview
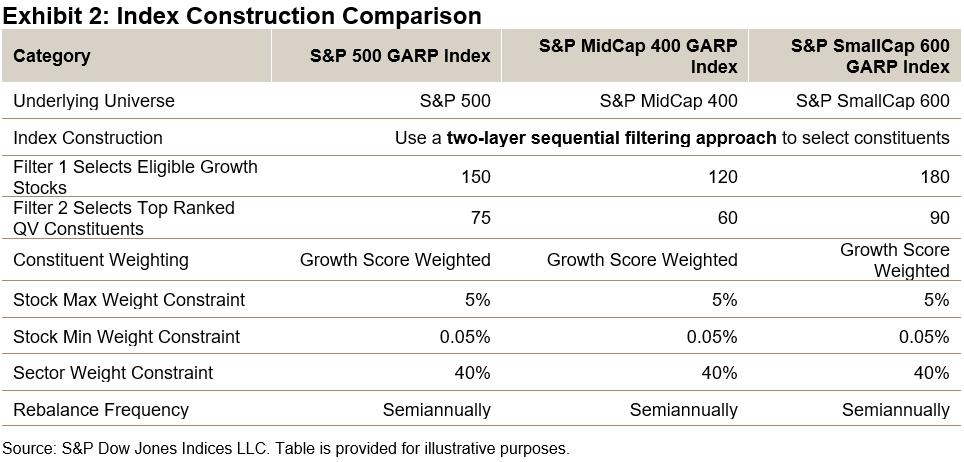
The S&P GARP Index methodology uses a two-layer sequential filtering approach to select its constituents.1 In the first step (filter 1), stocks are ranked by their growth z-scores (three-year EPS and SPS growth), with a targeted number of top-ranked stocks remaining eligible for constituent inclusion.2 In the second step (filter 2), the eligible stocks are ranked by their quality & value (QV) composite z-scores and a targeted number of top-ranked stocks are selected. The QV Score is based on the average of two quality factors (return on equity and financial leverage ratio) and one value factor (earnings-to-price ratio).
As illustrated in Exhibit 2, the resulting constituents represent growth stocks with relatively higher quality and value characteristics. The selected constituents are weighted proportional to their growth exposure, subject to the maximum individual weight of 5% and sector weight of 40%. This approach seeks to provide purer growth exposure and limit concentration risk.

Performance Comparison
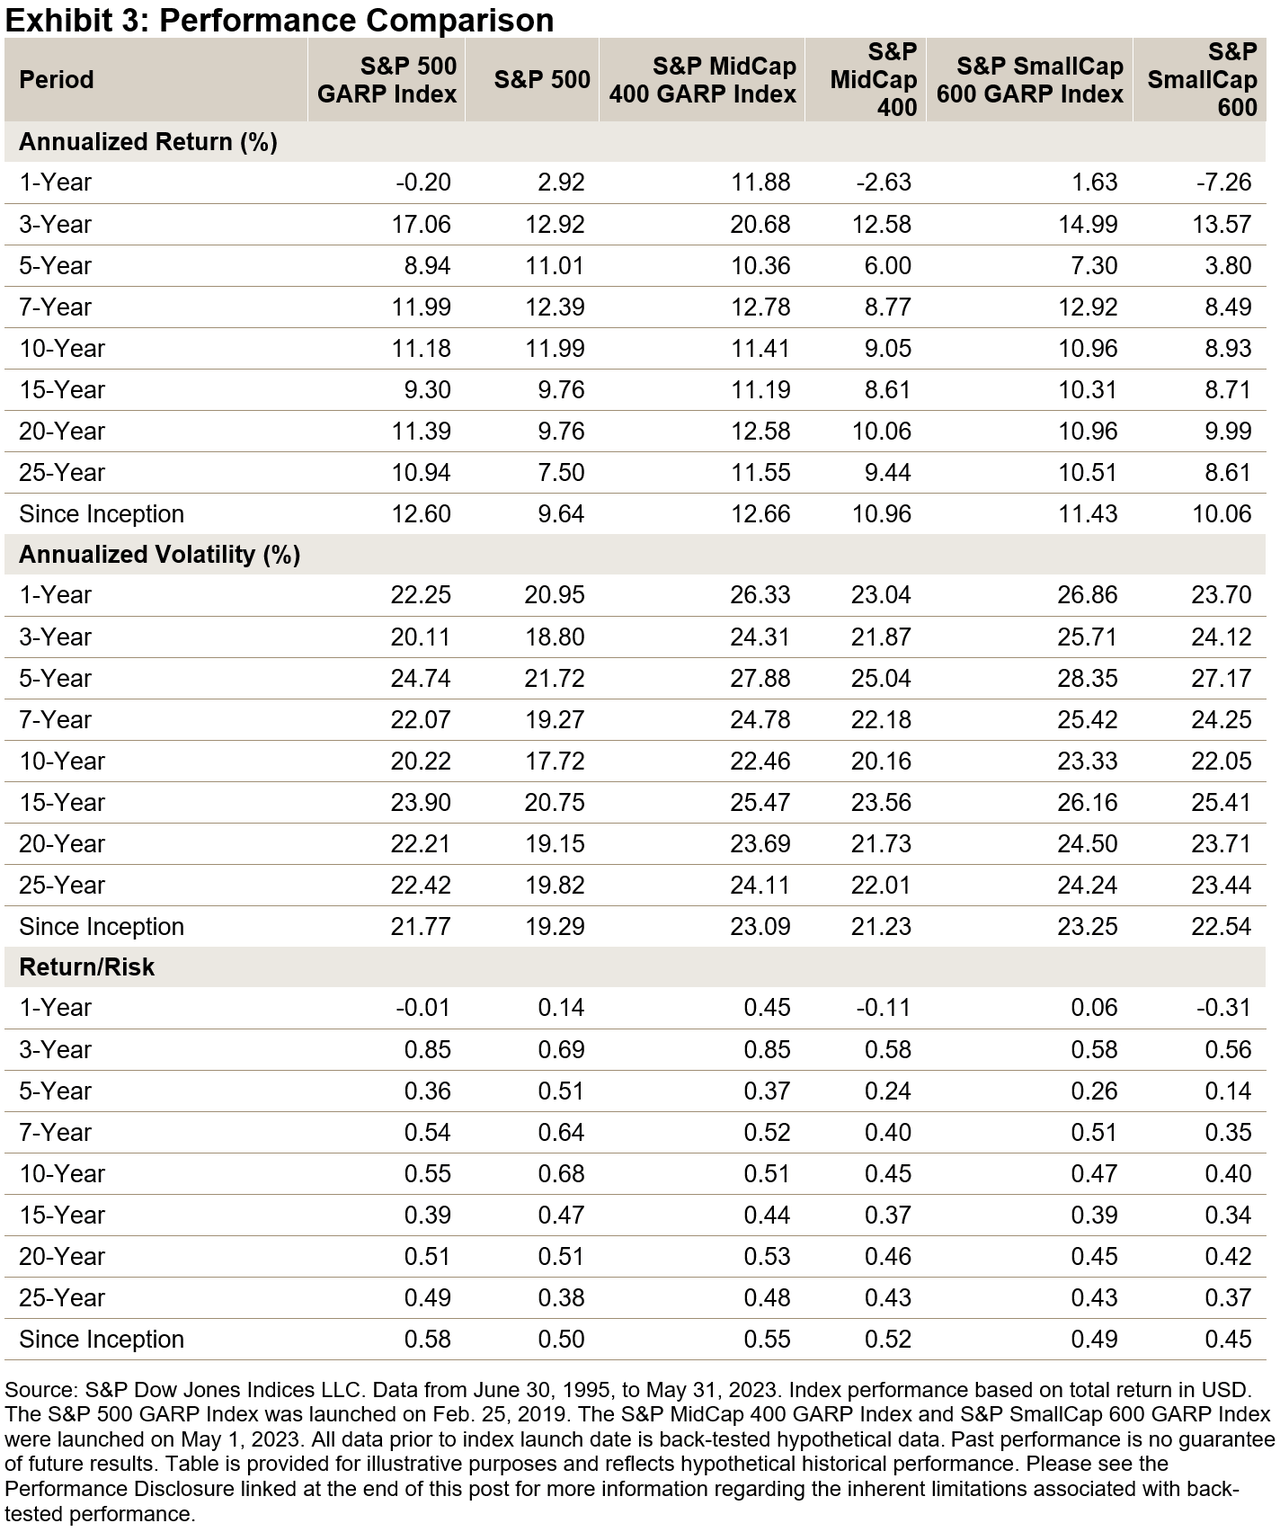
Historically, over the long term, the S&P GARP Indices outperformed their corresponding benchmarks in terms of both total and risk-adjusted return. The results show that the approach of selecting profitable growth stocks with reasonable valuations has yielded meaningful results over longer periods. In addition, both the S&P MidCap 400 GARP Index and the S&P SmallCap 600 GARP Index outperformed their corresponding benchmarks for all periods studied (see Exhibit 3).
Sector Composition
Exhibit 4 shows the historic sector exposure difference between the S&P GARP Indices versus their benchmarks. The S&P GARP Indices have had a noticeable overweight in Consumer Discretionary and an underweight in Financials, Consumer Staples, Utilities and Communication Services.

Factor Exposure
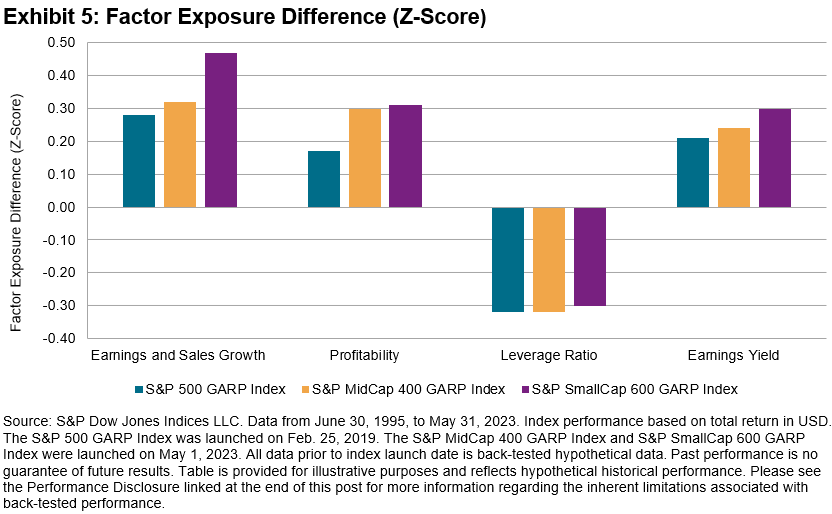
Exhibit 5 shows the factor characteristics as measured through the lens of Axioma Risk Model Factor Z-scores. The strategies had higher exposure to earnings and sales growth, profitability and earnings yield, while having lower leverage (lower exposure to leverage ratio).

Conclusion
As the simulated performance shows, applying the S&P GARP Index methodology to the mid-cap and small-cap universes has resulted in outperformance over the long term. For market participants looking to gain exposure across the market cap range, the S&P MidCap 400 GARP Index and the S&P SmallCap 600 GARP Index are a welcome addition to the S&P GARP Index Series.
1 Hao, W. and Soe, A., Indexing GARP Strategies: A Practitioner’s Guide, S&P Dow Jones Indices, 2019.
2 The indices apply 20% selection buffer according to the following process: 1. Rank the top Growth z-score stocks by QV composite z-score. Select automatically the top 80% highest ranking stocks for index inclusion. 2. Select current constituents ranked within the top 120% by QV composite z-score for index inclusion in order of QV composite z-score until the target QV count is reached. 3. If, at this point, there are not enough constituents selected to meet the QV count, select non-constituents based on QV composite z-score ranking until the target count is reached.
Disclosure: Copyright © 2023 S&P Dow Jones Indices LLC, a division of S&P Global. All rights reserved. This material is reproduced with the prior written consent of S&P DJI. For more information on S&P DJI please visit S&P Dow Jones Indices. For full terms of use and disclosures please visit Terms of Use.
Editor's Note: The summary bullets for this article were chosen by Seeking Alpha editors.
This article was written by

