PFIX: Playing A Summer Bid In Treasuries, Shifting To A Sell

Summary
- Rate risks have turned and are now skewed to the downside amid softening economic data following the yield rise since the start of Q2.
- PFIX's performance has languished as yields have stabilized, with a 7% decline in 2023 compared to a 2% total return in a broad Treasury basket.
- Selling PFIX today and repurchasing it if the 10-year rate nears 3.35%, which would equate to about $58 on PFIX, appears to be the prudent play.
Torsten Asmus
I analyzed and recommended a fixed-income ETF a few months ago. Given volatility in the bond market lately, I thought revisiting the Simplify Interest Rate Hedge ETF (NYSEARCA:PFIX) would be timely given key data next week, including the May CPI report and the pivotal June FOMC meeting.
I am updating my view on PFIX from a buy to a sell amid risks of lower yields ahead. I see the chance of an eventual move to the 3.3% to 3.4% range on the 10-year note.
TNX: Eyeing A Test of Support
StockCharts.com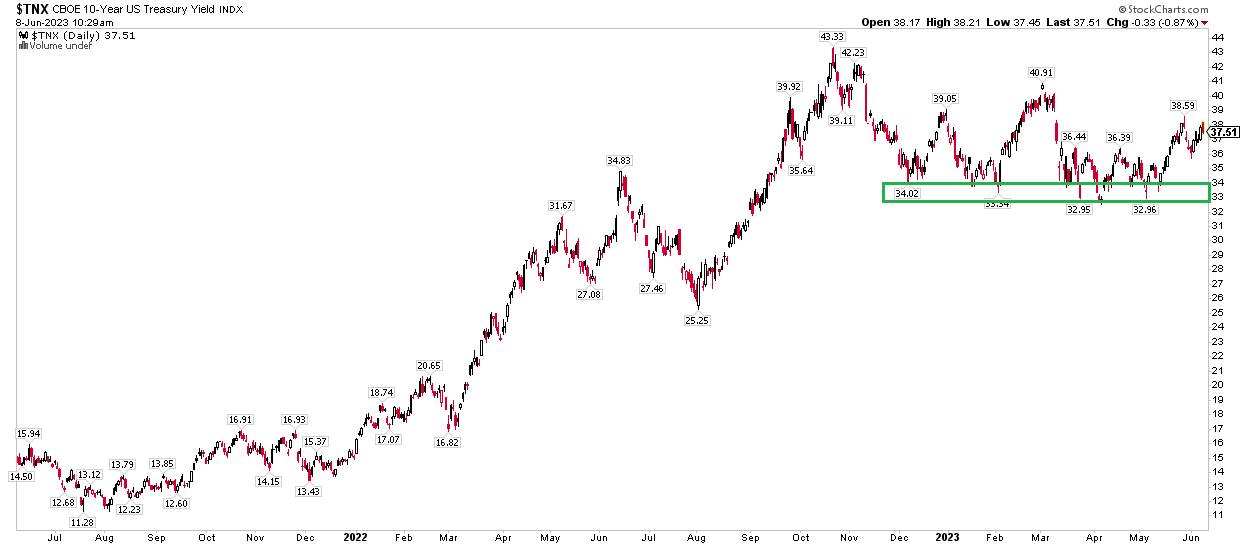
Since early April, rates have risen sharply, so being long PFIX relative to a basket of purely long Treasury securities would have paid off. Lately, however, we have seen yields take a breather. The 1-year rate was unable to climb above its early March high with much vigor, while the long bond - the 30yr - found resistance at the psychologically important 4% mark.
Treasury Yields Up Sharply From The March-April Lows, Rolling Over Slightly Lately
Koyfin Charts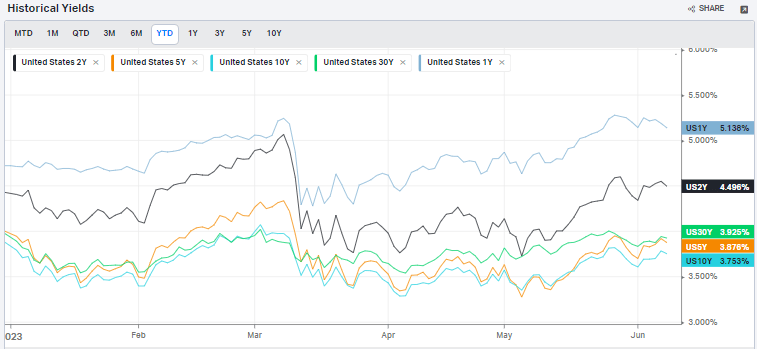
Buyers stepped to the plate on Thursday, June 8 when US Initial Jobless Claims rose to the highest level since October 2021, according to Liz Young at SoFi. If we see more weak economic data, then Treasuries should continue to catch a bid - particularly after the significant selloff we have seen over the last few months.
Initial Jobless Claims Spike, Treasuries Rally
Liz Young, SoFI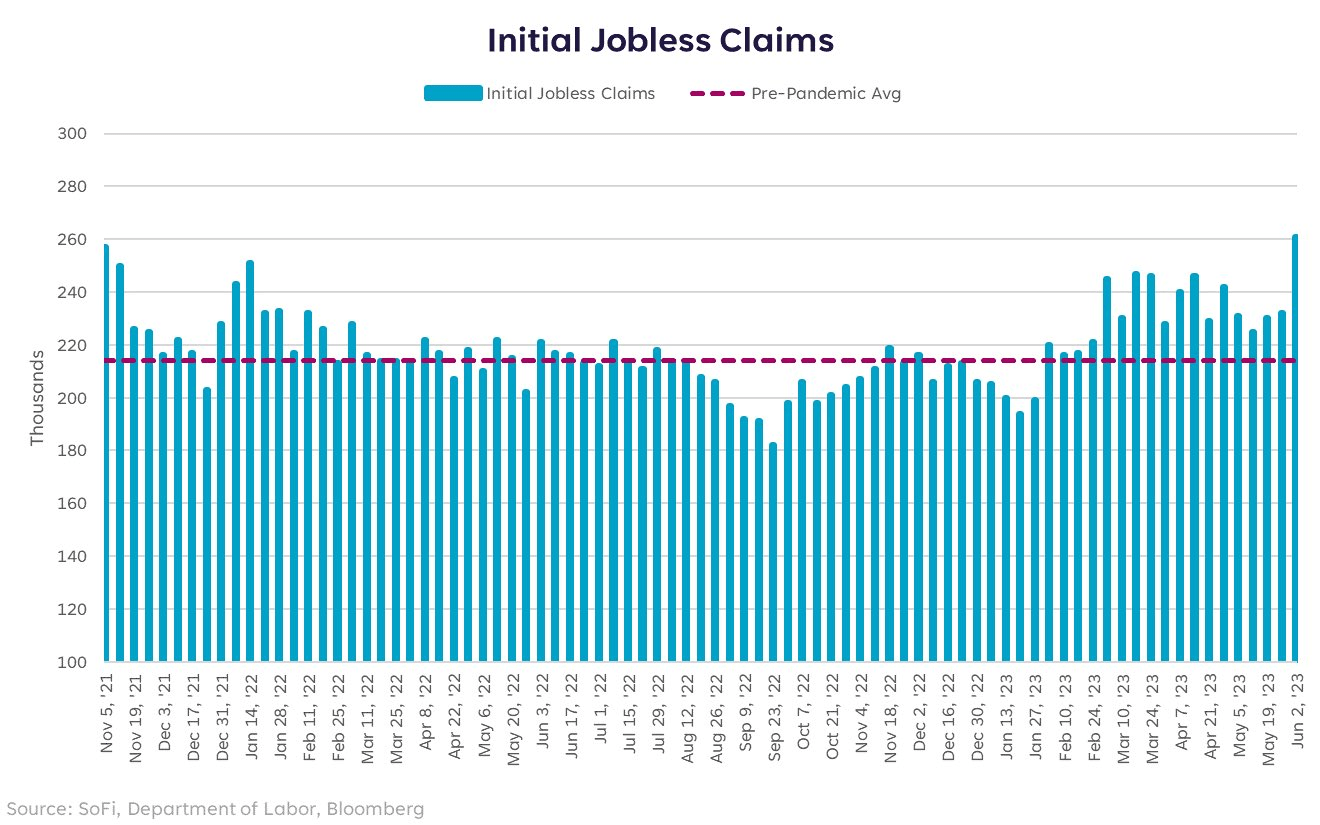
Ahead of the Fed next week, traders currently price in just a 27% chance of a hike. Go out through the July 26 meeting, though, and that probability increases to 63%. A rate cut is then expected in Q4 this year.
An Expectations Game: Skip, Hike, Pause, And A Cut
CME FedWatch Tool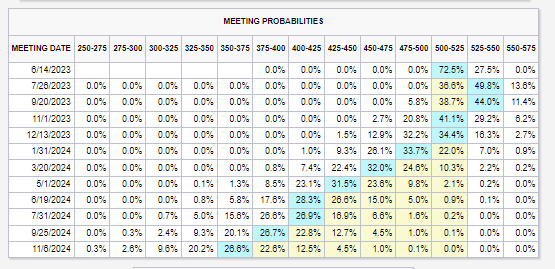
Despite the rollercoaster, the ICE BofA Interest Rate Volatility Index (MOVE) dropped to lows not seen since mid-February earlier this week. Traders are coming to grips with the reality that the Fed is near the end of its rate-increase cycle. Moreover, with almost three months having passed since the domestic regional banking crisis, there is more confidence in the Financials sector.
Rate Volatility (MOVE) Fresh 4-Month Lows
TradingView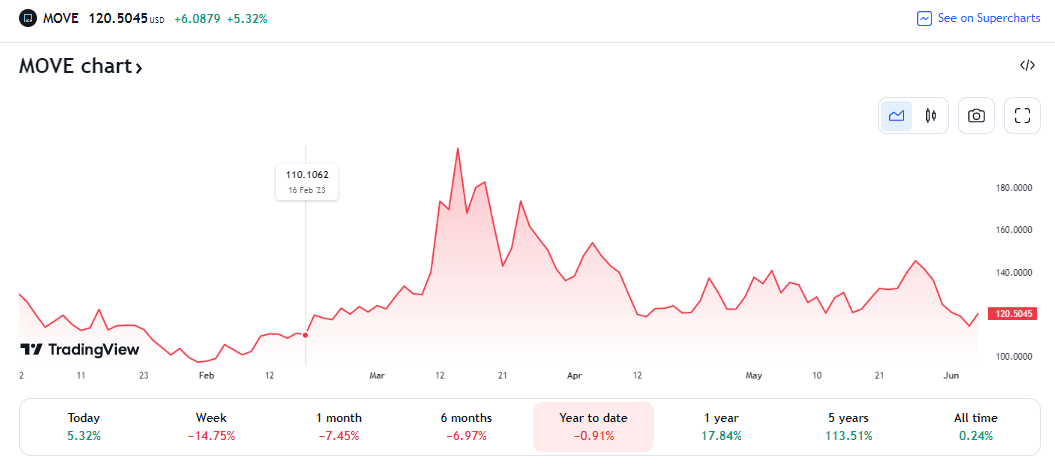
So, we have a dual backdrop: An improved banking system compared to fears projected in March, but also the potential of a weaker broader economy. In the short run, lower bond yields are likely in my view. To get the most bang for your buck, going long high-duration long-term Treasuries would make the most sense, while avoiding PFIX would be prudent.
According to the issuer, the Simplify Interest Rate Hedge ETF seeks to hedge against rising long-term interest rates, and to benefit from market stress when fixed income volatility increases. The fund holds a large position in over-the-counter (OTC) interest rate options intended to provide a direct and transparent convex exposure to large upward moves in interest rates and interest rate volatility.
PFIX Fund Details
Simplify ETFs
PFIX is an ideal way to maintain Treasury exposure while backing out the downside risk of rising rates. Hence, 2022's bond bear market was heavenly for the ETF. As yields have stabilized, its performance has languished. So far this year, PFIX is down 7% compared to a 2% total return in a broad Treasury basket. Following the regional banking saga, PFIX rose more than 10%. I assert harvesting gains from late March is wise.
2023: PFIX -7%, GOVT +2%
StockCharts.com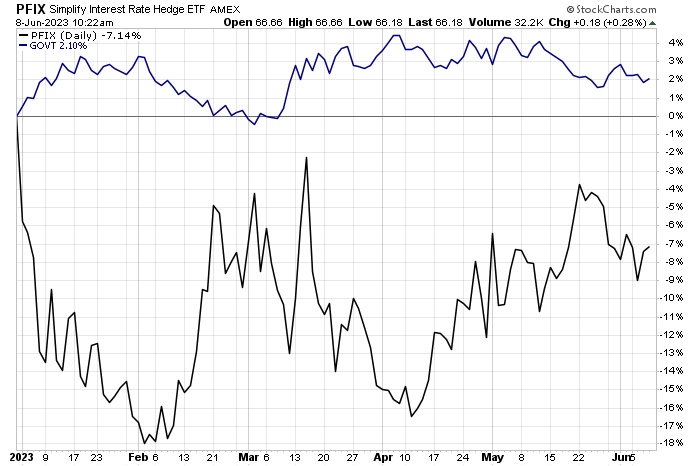
Seasonality is something to take into account, as well. According to data from Equity Clock, GOVT tends to rally from mid-June through mid-August. This is yet another piece of evidence supporting positioning a portfolio for lower yields in the coming months.
Bullish Treasury Market Seasonality June-August
Equity Clock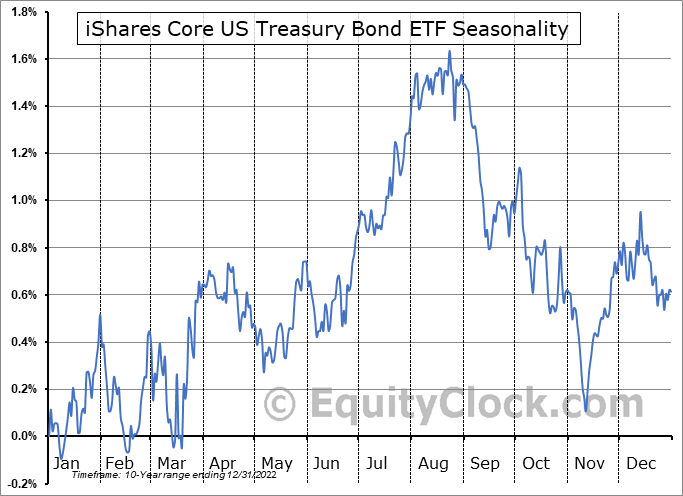
The Technical Take
I also noticed that PFIX's technical situation is not as sanguine as it once was. Notice in the chart below that the fund is consolidating in a symmetrical triangle. This is considered a continuation pattern, and the next significant move is presumed to be in the trend of greater degree - down, in this case, off the October 2022 high. I see near-term support around $59, and a breakdown below that would portend a measured move price target into the low $40s based on the range of the pattern. That would take PFIX back down to the top end of its 2021 range.
PFIX: Bearish Symmetrical Triangle Emerges
StockCharts.com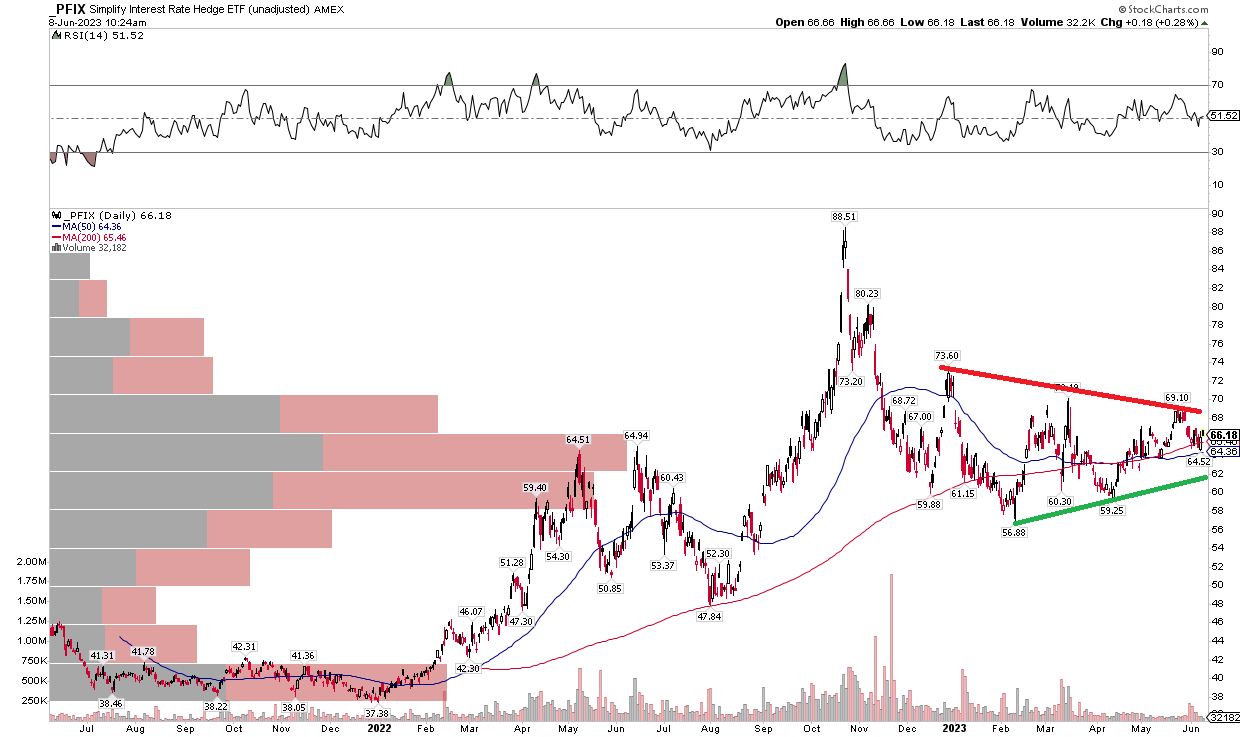
The Bottom Line
That is a dire chartist rendering of where PFIX may go. My bearish thesis is a bit more short-term and less drastic. I would avoid PFIX today and get long should the 10-year rate near 3.35% - that would equate to about $58 on PFIX.
This article was written by

Analyst’s Disclosure: I/we have no stock, option or similar derivative position in any of the companies mentioned, and no plans to initiate any such positions within the next 72 hours. I wrote this article myself, and it expresses my own opinions. I am not receiving compensation for it (other than from Seeking Alpha). I have no business relationship with any company whose stock is mentioned in this article.
Seeking Alpha's Disclosure: Past performance is no guarantee of future results. No recommendation or advice is being given as to whether any investment is suitable for a particular investor. Any views or opinions expressed above may not reflect those of Seeking Alpha as a whole. Seeking Alpha is not a licensed securities dealer, broker or US investment adviser or investment bank. Our analysts are third party authors that include both professional investors and individual investors who may not be licensed or certified by any institute or regulatory body.