XLV Vs. VHT: A Head-To-Head Healthcare ETF Comparison

Summary
- The Health Care Select Sector SPDR ETF and the Vanguard Health Care ETF are the two most popular Health Care ETFs, with a combined $57 billion in assets under management.
- Both ETFs have a 0.10% expense ratio, a five-year beta around 0.70, and trade at nearly identical valuations. While XLV has a profitability advantage, VHT has the edge on growth.
- The article compares the composition, historical returns, and current fundamentals of both funds. Also included is a comprehensive performance review of 28 Health Care ETFs between 2008-2023.
- Looking for more investing ideas like this one? Get them exclusively at Hoya Capital Income Builder. Learn More »
Dragon Claws
Investment Thesis
The Health Care Select Sector SPDR ETF (NYSEARCA:XLV) and the Vanguard Health Care ETF (NYSEARCA:VHT) are the two most popular Health Care ETFs today, with a combined $57 billion in assets under management. Both funds sport a low 0.10% expense ratio, have a five-year beta of around 0.70, and trade at nearly an identical forward earnings valuation. However, VHT has a slight performance edge and more growth potential. This article dives deeper into the composition of both funds, compares their historical returns against 26 other Health Care ETFs, and provides an opinion on whether you should buy either today.
ETF Overview
Strategy Comparison: XLV vs. VHT
XLV tracks the Health Care Select Sector Index, holding only the 65 Health Care securities that qualify for the S&P 500 Index based on Global Industry Classification Standards. Select Sector Indexes are float-market-cap-weighted with caps in place for constituents with over a 24% weighting. In addition, companies with weights greater than 4.8% can be at most 50% of the total. The Index rebalances quarterly after the third Friday of March, June, September, and December.
VHT tracks the MSCI Spliced U.S. Investable Market Health Care 25/50 Index, holding 411 Health Care securities across all size segments based on the same GICS standards as XLV. The Index is also float-market-cap-weighted and has similar capping rules. Specifically, a security's weight cannot exceed 25%, and all securities with weights above 5% cannot total more than 50%. MSCI's methodology document provides further details.
The caps do not apply to either XLV or VHT. XLV's largest holding is UnitedHealth Group (UNH), with a 9.29% weighting, and there are five holdings with weightings above 4.8% that total 35.60% of the portfolio. For VHT, UNH is also the top holding with a 7.99% weighting. In addition, there are only three holdings with weightings above 5%, totaling 21.57%. In short, the primary difference is the selection universe. We'll need to determine if adding small- and mid-cap stocks through VHT is beneficial.
Top Holdings: XLV
XLV's top ten holdings are below, totaling 54% of the portfolio. After UNH, Johnson & Johnson (JNJ), Eli Lilly (LLY), Merck & Co. (MRK), and AbbVie (ABBV) round out the top five.
State Street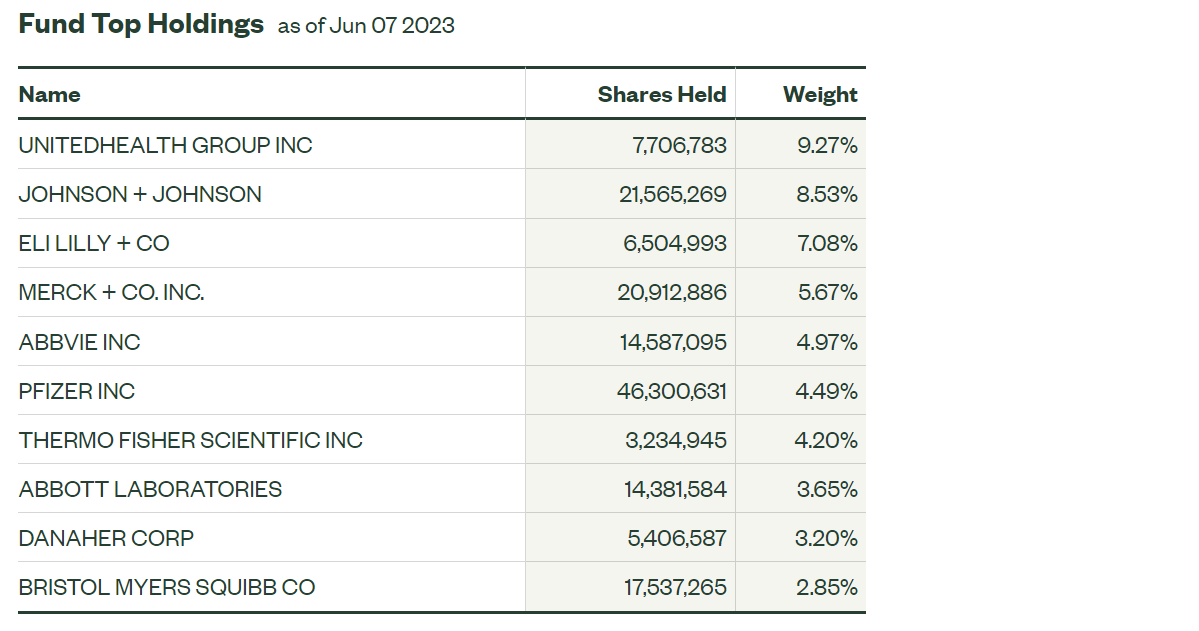
Furthermore, XLV holds stocks across nine industries, as follows:
- Pharmaceuticals: 27.90%
- Health Care Equipment: 19.57%
- Biotechnology: 17.58%
- Managed Health Care: 13.96%
- Life Sciences Tools & Services: 11.98%
- Health Care Services: 4.33%
- Health Care Distributors: 2.32%
- Health Care Facilities: 1.38%
- Health Care Supplies: 0.98%
Top Holdings: VHT
VHT's top ten holdings are listed below, totaling 47% of the portfolio. The listing is the same as XLV's, just with different weightings. However, please note that the holdings listed on Vanguard's website (and, by extension, all third-party websites, including Seeking Alpha) are as of April 30, 2023, and will remain this way until on or about June 15, 2023.
Vanguard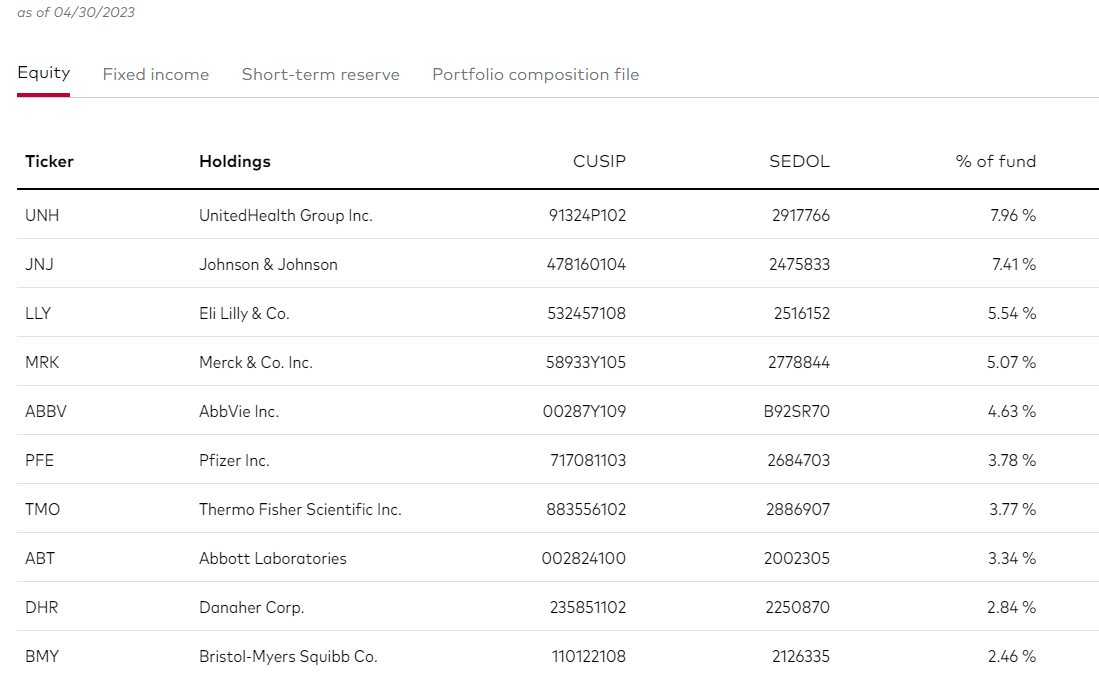
I've done a workaround using VHT's "Portfolio Composition File" tab on Vanguard's website, which updates daily. The most significant change is with Eli Lilly, which now has a 6.26% weighting vs. 5.54% on April 30, 2023. I will rely on these more up-to-date numbers for the remainder of the article.
Vanguard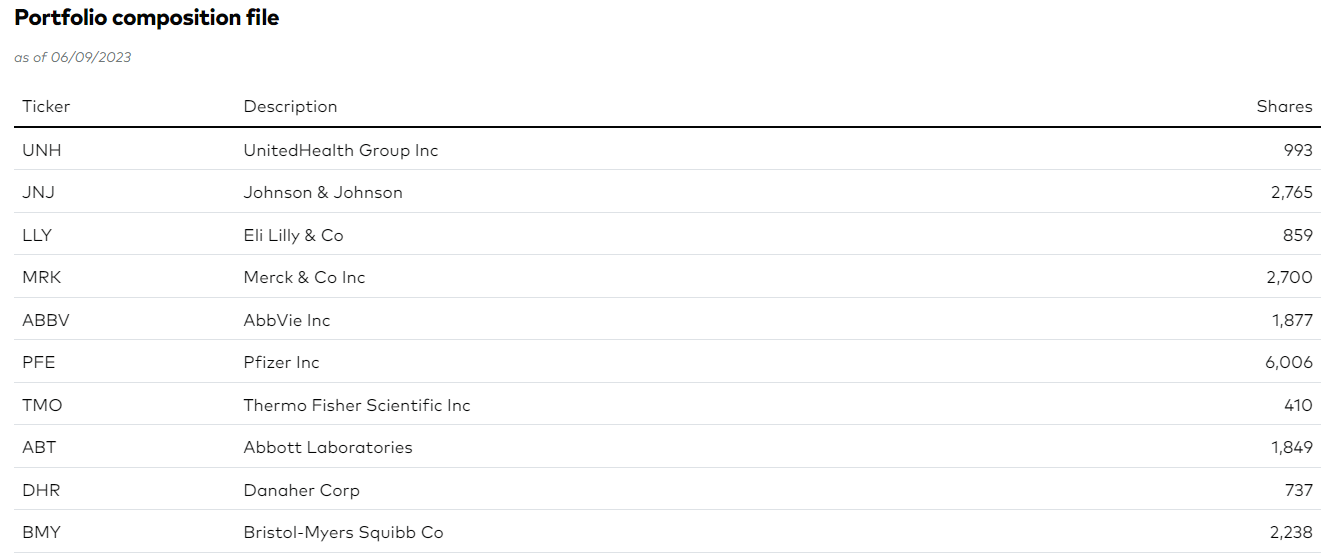
VHT's industry exposures are slightly different, too, as shown below. Biotechnology is higher by 3.57%, while Pharmaceuticals and Managed Health Care exposure is reduced by 2.55% and 1.78%.
- Pharmaceuticals: 25.35%
- Biotechnology: 21.15%
- Health Care Equipment: 18.54%
- Managed Health Care: 12.18%
- Life Sciences Tools & Services: 11.52%
- Health Care Services: 4.67%
- Health Care Distributors: 2.12%
- Health Care Facilities: 1.79%
- Health Care Supplies: 1.56%
- Health Care Technology: 1.13%
Health Care Technology is one industry that VHT holds, but XLV does not. There are 20 companies in this industry, with market capitalizations between $254 million and $31.4 billion. The latter is Veeva Systems (VEEV), and based on its size, it should qualify for XLV but is excluded because a committee determines S&P 500 Index eligibility. Seagen (SGEN) and Alnylam Pharmaceuticals (ALNY) are others included in VHT but not XLV, but the reason is profitability. S&P 500 constituents must have four consecutive profitable quarters, which neither SGEN nor ALNY accomplished.
Performance Analysis
XLV and VHT are the two largest Health Care ETFs, managing $40.3 billion and $16.7 in assets. They share the same low 0.10% expense ratio, and as shown below, if investors want specific exposure to a particular industry, they'll have to pay for it. The iShares Biotechnology ETF (IBB), the SPDR S&P Biotech ETF (XBI), and the iShares U.S. Medical Devices ETF (IHI) are the next largest by assets but have expense ratios of 0.44%, 0.35%, and 0.39%.
Morningstar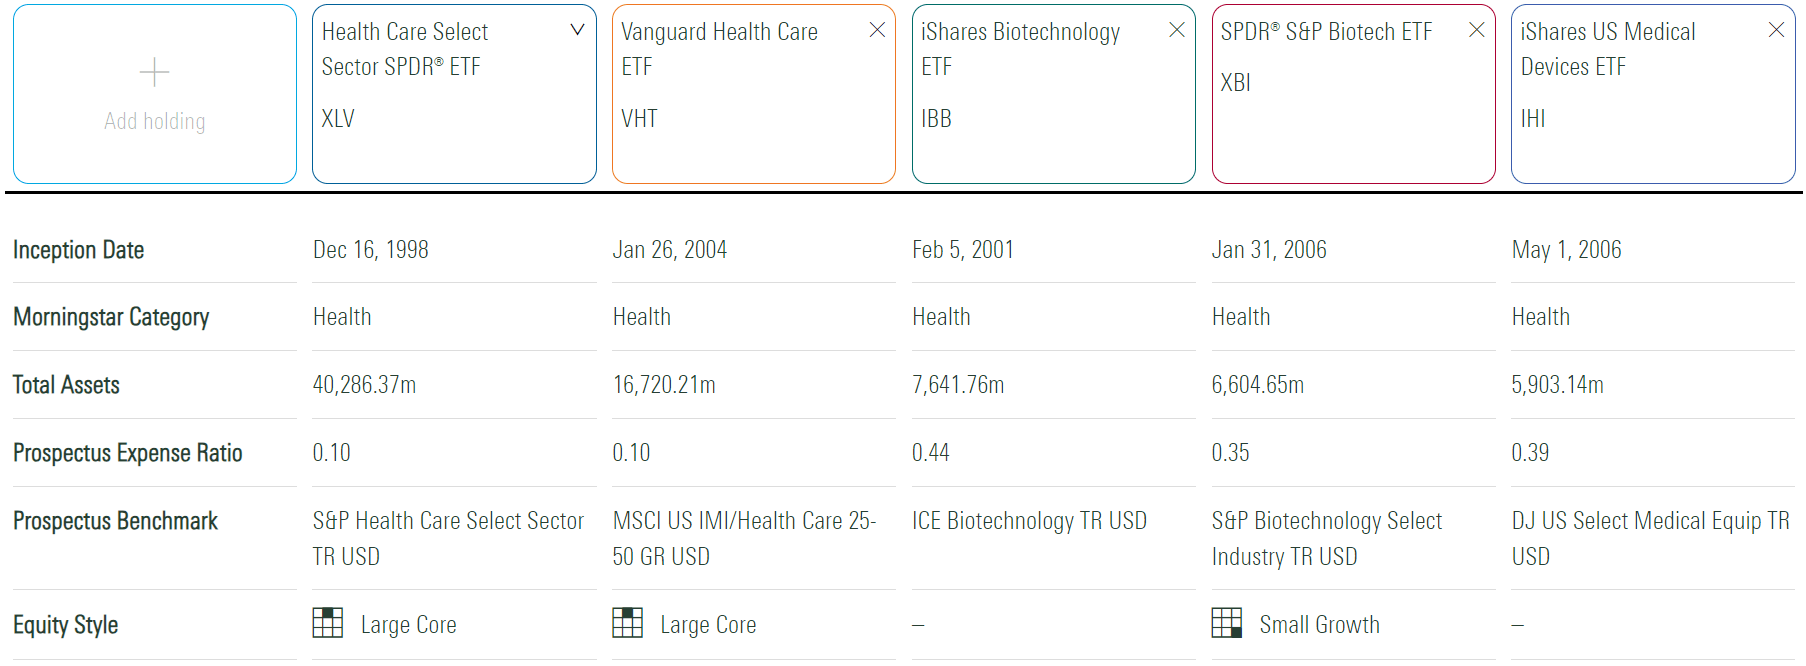
A solid track record is one reason to buy either XLV or VHT. As shown below, both outperformed the SPDR S&P 500 Trust ETF (SPY) since VHT launched in January 2004.
Portfolio Visualizer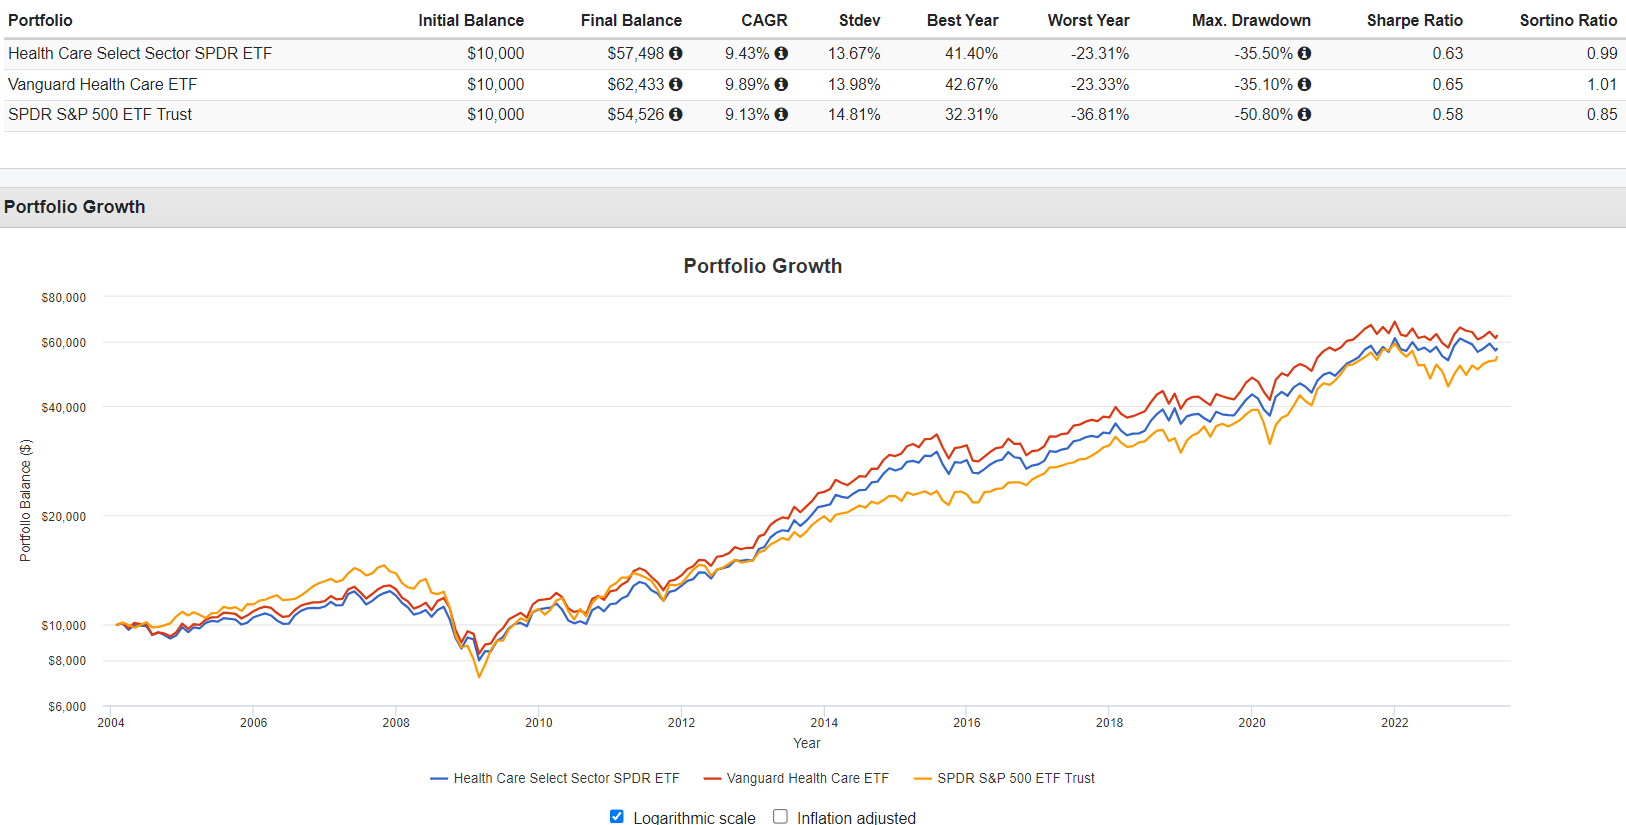
Importantly, each did so with less volatility, resulting in better risk-adjusted returns (Sharpe and Sortino Ratios). Drawdowns are typically less, too. XLV and VHT outperformed SPY by 15% in the Subprime Crisis and 6% through the Q1 2020 decline related to COVID-19.
Portfolio Visualizer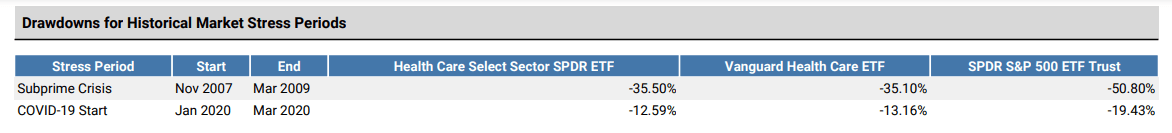
Even though these results are strong, long-term performance charts are difficult to interpret. To illustrate, XLV and VHT lagged SPY by 3-5% per year over the last three years but led for the seven years prior. It's not evident which performance period is most relevant.
Portfolio Visualizer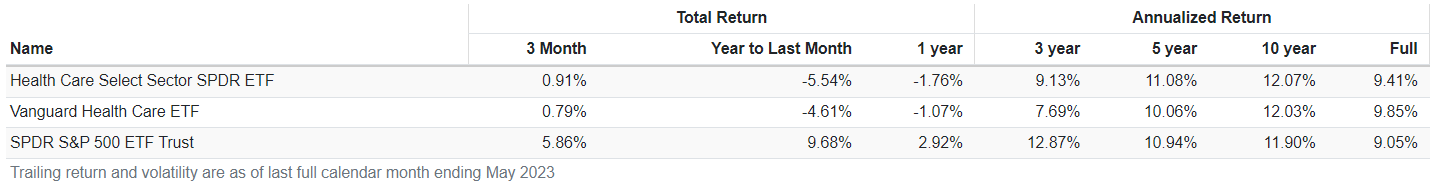
Instead, I've created a peer group for XLV and VHT that includes SPY and 26 other Health Care ETFs. The following table ranks each fund's annual returns since 2008, with percentile rankings bolded in the final rows (lower is better).
The Sunday Investor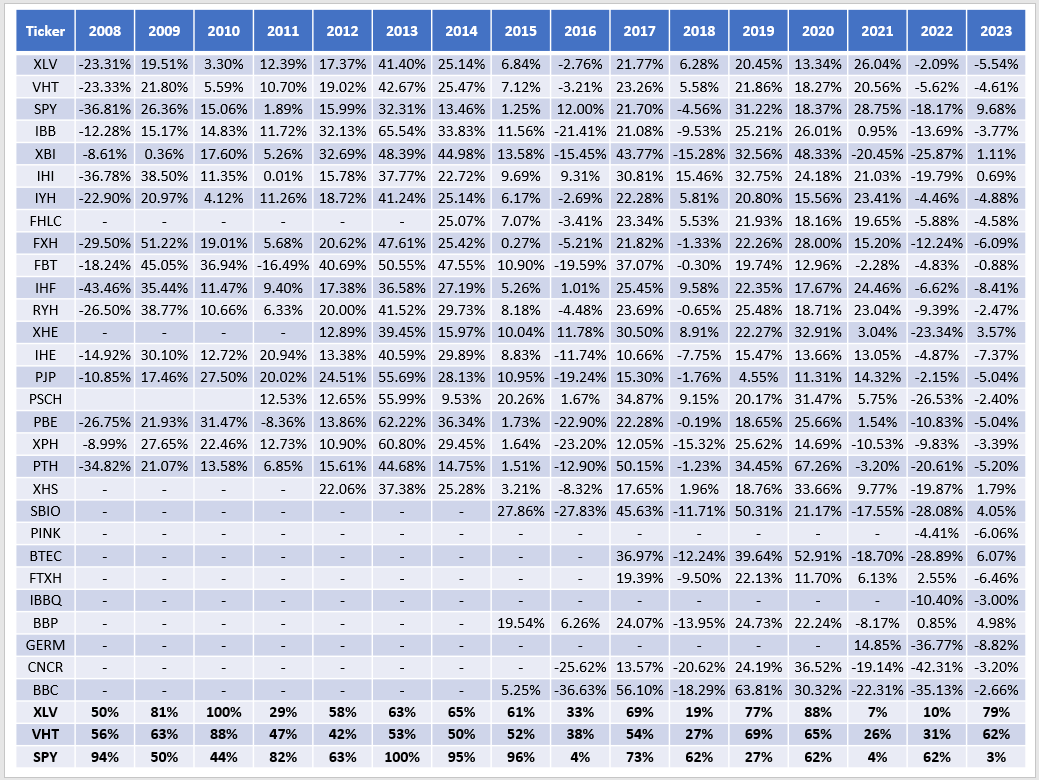
Based on this information, I calculated these statistics:
- XLV and VHT outperformed SPY in 9/16 years
- VHT beat XLV in 10/16 years
- XLV, VHT, and SPY averaged 56, 51, and 58 percentile performance
Finally, I noted six ETFs with better average results between 2008-2023:
- First Trust NYSE ARCA Biotechnology Fund (FBT)
- SPDR S&P Biotech ETF (XBI)
- Invesco S&P 500 Equal Weight Health Care ETF (RSPH), previously RYH
- iShares Biotechnology ETF (IBB)
- iShares U.S. Medical Devices ETF (IHI)
- Invesco Dynamic Pharmaceuticals ETF (PJP)
Of these six, RSPH is the only other broad-based fund, and because of its more consistent performance, it has delivered about 1% more total return per year than VHT since its November 2006 launch. I will include it in my fundamentals analysis section, as it's an easy way to diversify away from the mega-cap stocks listed earlier.
Portfolio Visualizer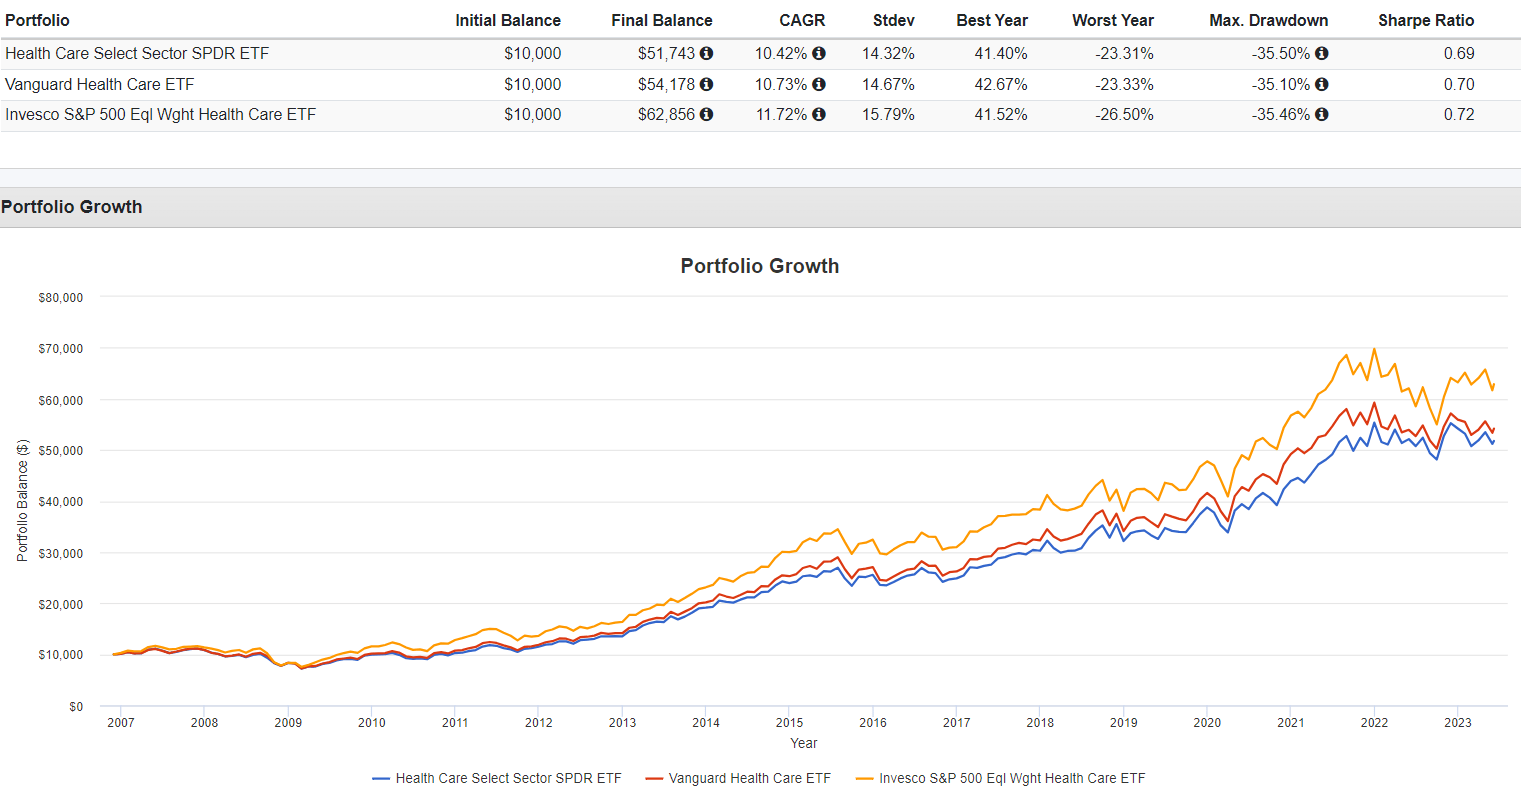
Fundamental Analysis
The following table highlights selected fundamental metrics for XLV's top 25 companies, totaling 81% of the portfolio. VHT's holdings are virtually identical, but just with different weightings.
The Sunday Investor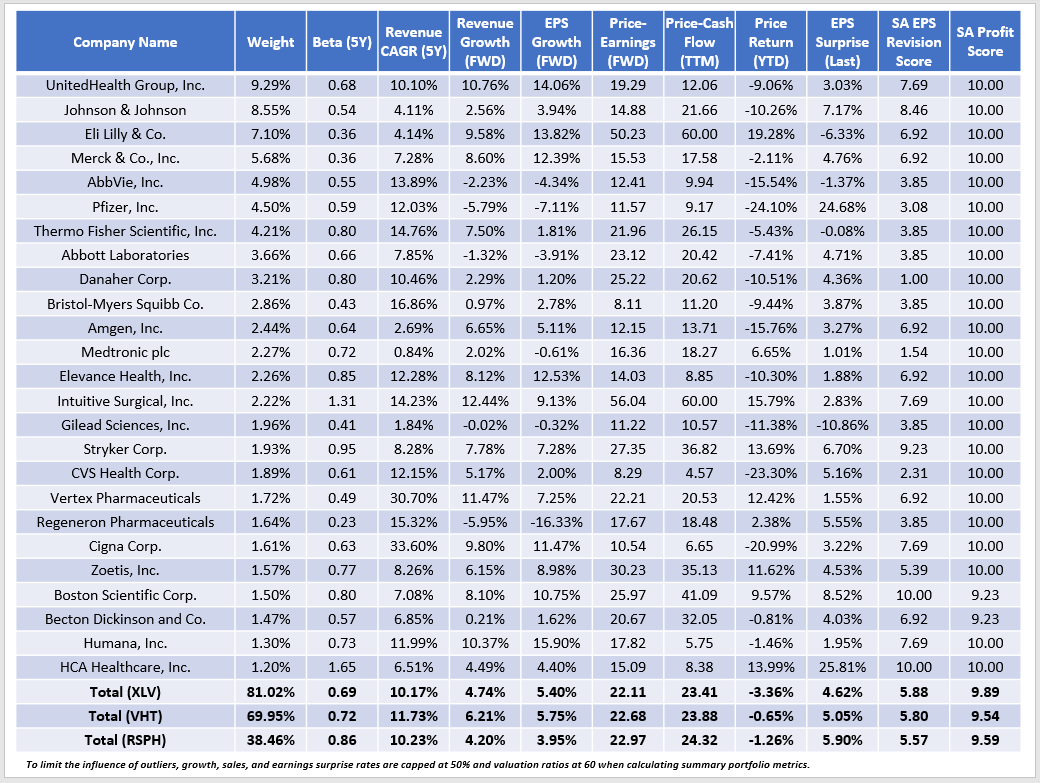
There are apparent similarities between XLV and VHT. Each have similar five-year betas (0.69 and 0.72) and valuations, indicated by their 22-24x forward P/E and trailing cash flow ratios. Profitability scores are also sufficiently strong in both cases, although VHT's is slightly lower because it holds some small- and mid-cap stocks. However, the benefit is a higher estimated sales growth (6.21% vs. 4.74%) that could give it an edge moving forward. Based on its consistent track record and how it's generally underperformed XLV since the pandemic began, there's likely better value with VHT. Still, the entire Health Care sector isn't too attractive today. The sector's aggregate earnings surprise last quarter was 6.2% (7.1% for the S&P 500 Index), and only 41.3% of companies reported positive year-over-year earnings growth.
Yardeni Research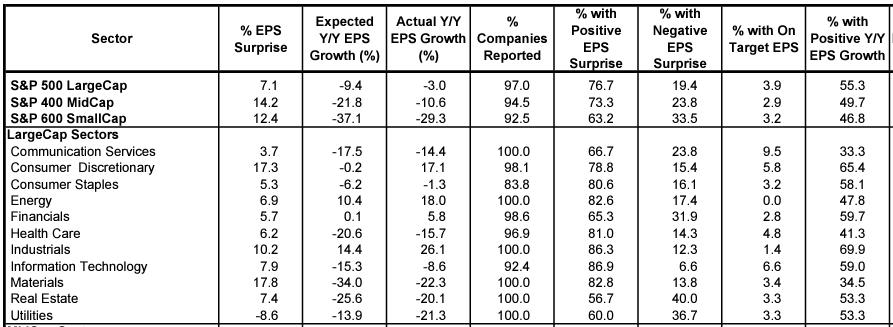
The mid-caps had the best earnings surprises in Q1: 14.2% for the S&P 400 MidCap and 12.3% for the Health Care segment. Again, this suggests there's potentially better value with VHT over XLV, and it's showing in these results, too. For the 345 stocks in VHT but not in XLV, the average YTD price return was 9.27%, including 17% and 52% gains for Veeva Systems and Seagen.
Finally, while diversifying by size looks like a solid strategy for the Health Care sector, I'm surprised to see such poor fundamentals for RSPH, the equal-weight S&P 500 Health Care ETF. Estimated sales and earnings growth is only 4%, and the two valuation ratios highlighted are no more attractive than XLV or VHT. RSPH's weighted average earnings surprise was slightly better at 5.90%, but its normalized Seeking Alpha EPS Revision Score disappoints at just 5.57/10. Furthermore, investors might be discouraged by its 0.86 five-year beta. As shown in the drawdowns analysis below, RSPH declined by 21.19% for the first three quarters of 2022, just 2.74% better than SPY.
Portfolio Visualizer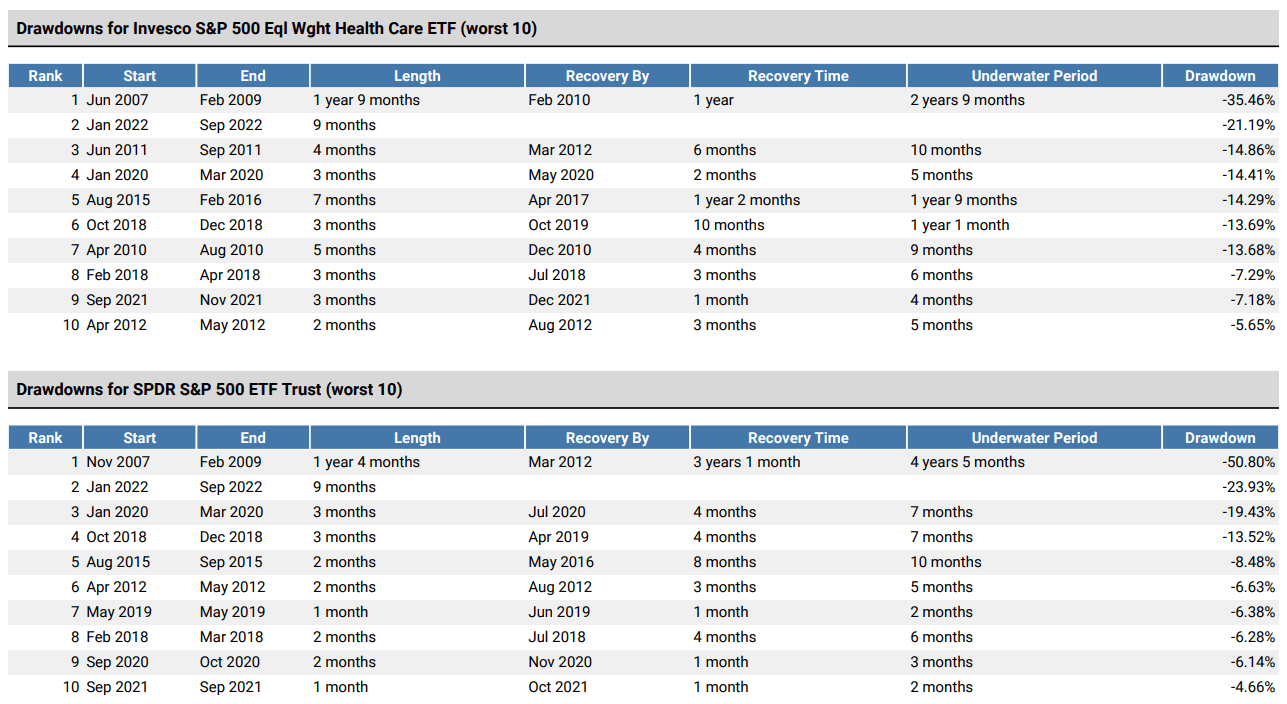
It may signify a new normal, where Health Care stocks are no longer considered safe assets. Remember how richly-valued stocks were punished in 2022, and XLV still has the fourth-highest forward price-earnings ratio out of all of State Street's Select Sector SPDR ETFs (excluding Real Estate). Consumer Discretionary, Technology and Consumer Staples are the most expensive, while Energy (XLE), Financials (XLF), and Utilities (XLU) are the three cheapest.
Investment Recommendation
Between 2008 and 2023, VHT outperformed XLV in 10/16 years and had better returns and risk-adjusted returns since its inception in 2004. I also determined that VHT's estimated sales and earnings growth rate was superior, so if I had to choose one, it would be VHT. However, the Health Care sector is not attractive right now. Its valuation remains high, especially for the lackluster growth provided, and I am concerned Health Care stocks won't live up to their reputation for providing downside protection through the next recession. Therefore, I have rated both ETFs as a hold, and I encourage readers to explore some of the other industry-specific Health Care ETFs mentioned in this article. Please let me know in the comments section below if any of them caught your eye, and thank you for reading.
The Sunday Investor Joins Income Builder
The Sunday Investor has teamed up with Hoya Capital to launch the premier income-focused investing service on Seeking Alpha. Members receive complete early access to our articles along with exclusive income-focused model portfolios and a comprehensive suite of tools and models to help build sustainable portfolio income targeting premium dividend yields of up to 10%.
Whether your focus is High Yield or Dividend Growth, we’ve got you covered with actionable investment research focusing on real income-producing asset classes that offer potential diversification, monthly income, capital appreciation, and inflation hedging. Start A Free 2-Week Trial Today!

This article was written by

I perform independent fundamental analysis for over 850 U.S. Equity ETFs and aim to provide you with the most comprehensive ETF coverage on Seeking Alpha. My insights into how ETFs are constructed at the industry level are unique rather than surface-level reviews that’s standard on other investment platforms. My deep-dive articles always include a set of alternative funds, and I am active in the comments section and ready to answer your questions about the ETFs you own or are considering.
My qualifications include a Certificate in Advanced Investment Advice from the Canadian Securities Institute, the completion of all educational requirements for the Chartered Investment Manager (CIM) designation, and a Bachelor of Commerce degree with a major in Accounting. In addition, I passed the CFA Level 1 Exam and am on track to become licensed to advise on options and derivatives in 2023. In November 2021, I became a contributor for the Hoya Capital Income Builder Marketplace Service and manage the "Active Equity ETF Model Portfolio", which as a total return objective. Sign up for a free trial today! Hoya Capital Income Builder.
Analyst’s Disclosure: I/we have a beneficial long position in the shares of SPY either through stock ownership, options, or other derivatives. I wrote this article myself, and it expresses my own opinions. I am not receiving compensation for it (other than from Seeking Alpha). I have no business relationship with any company whose stock is mentioned in this article.
Seeking Alpha's Disclosure: Past performance is no guarantee of future results. No recommendation or advice is being given as to whether any investment is suitable for a particular investor. Any views or opinions expressed above may not reflect those of Seeking Alpha as a whole. Seeking Alpha is not a licensed securities dealer, broker or US investment adviser or investment bank. Our analysts are third party authors that include both professional investors and individual investors who may not be licensed or certified by any institute or regulatory body.