Target: Appears Fairly Valued Given Headwinds

Summary
- Target Corporation's stock is down ~14% over the past month, facing near-term headwinds.
- Inventory shrink and promotional markdowns have impacted profitability, but gross margins improved slightly in Q1.
- My valuation approach estimates that TGT currently trades around fair value.
- Due to the factors above, I rate TGT stock a hold.
Scott Olson/Getty Images News
Introduction
Target Corporation (NYSE:TGT) is down ~14% over the past month as they continue to face several headwinds in the near term. The company currently offers a 3.26% dividend yield and has paid dividends every quarter since 1967. The balance sheet is okay for now with a d/e ratio of 1.62 and the majority of the debt being long-term. My valuation approach estimates a value of $123.43, implying that the stock is currently around fair value.
Target's Inventory Problem
2022 was a rough year for Target's profitability as gross margins dropped to 23.6%. Supply chain issues stemming from Covid-19 continued to affect TGT as the arrival of inventory was in excess of the sales trend for the year. In order to clear out this inventory, TGT issued higher promotional markdown rates. According to the most recent annual report, this contributed to a 3.4% decrease in gross margin for the year.
2022 10K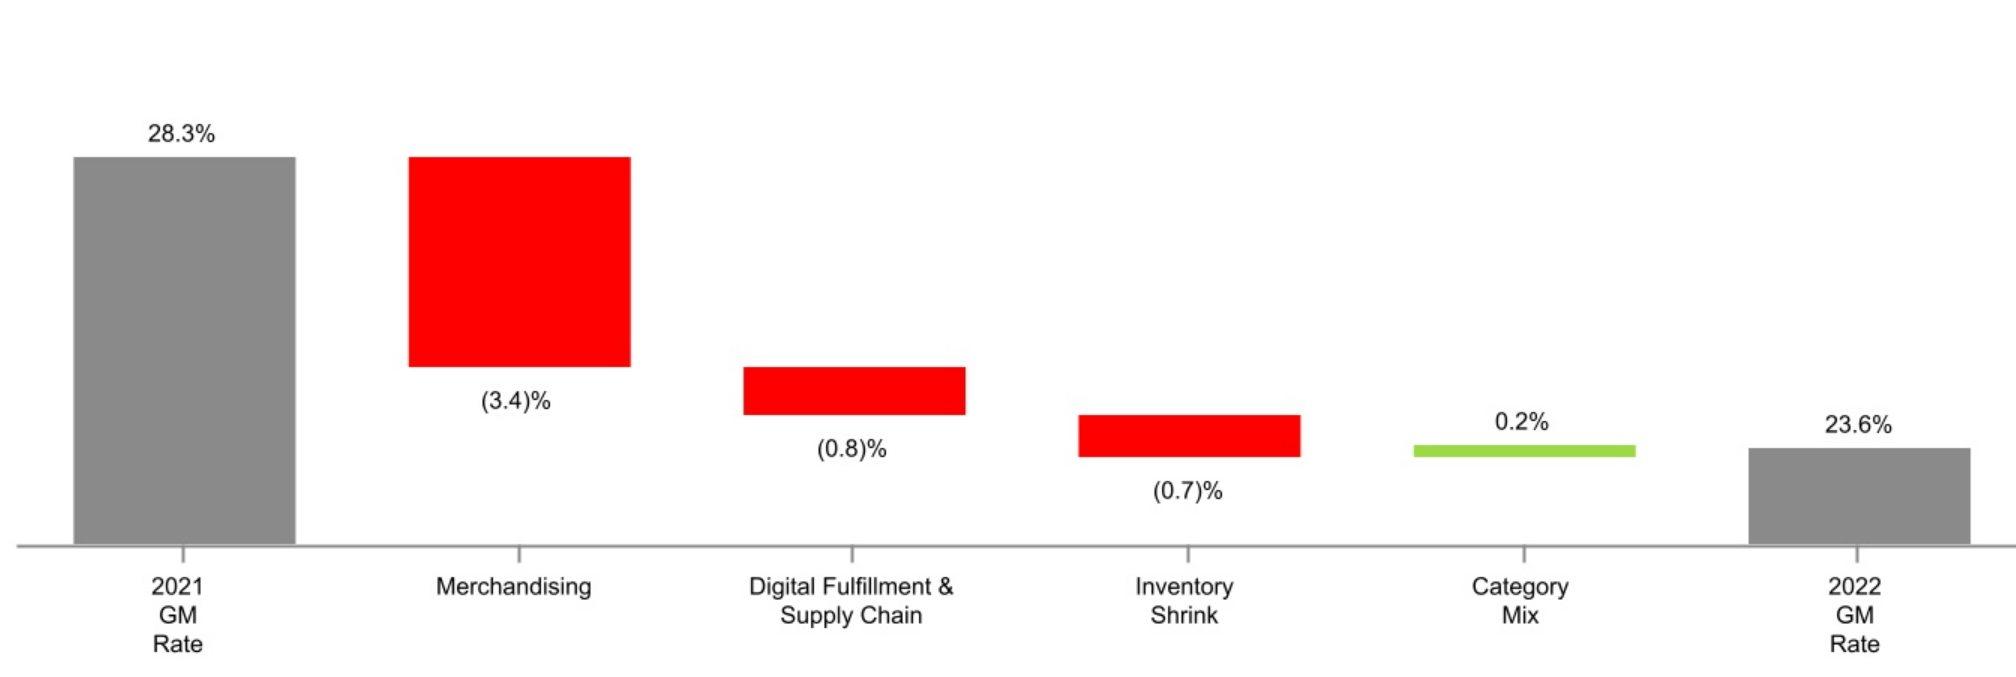
Moving on to the first quarter of 2023, TGT was able to better align its inventory levels with the sales trend and did not suffer from large scale markdowns as much. However, much of the benefit from this decrease in markdowns was offset by an increase in inventory shrink to 1%. According to the most recent transcript:
Theft and organized retail crime are increasingly urgent issues.
In response to this, TGT has implemented glass barriers in areas where inventory shrink is a problem. I would be interested to see the effect that this increased transaction friction has on overall sales. Obviously, the best case scenario for TGT would be for the shrink to be reduced without added friction to their stores. However, It seems that these mitigation efforts are the best option they have at the moment. Overall, the reduction in inventory discounts had a larger effect on gross margins than shrink, which is why profitability improved slightly in the first quarter of the year.
Q1 2023 10Q
Earnings Expectations
Seeking Alpha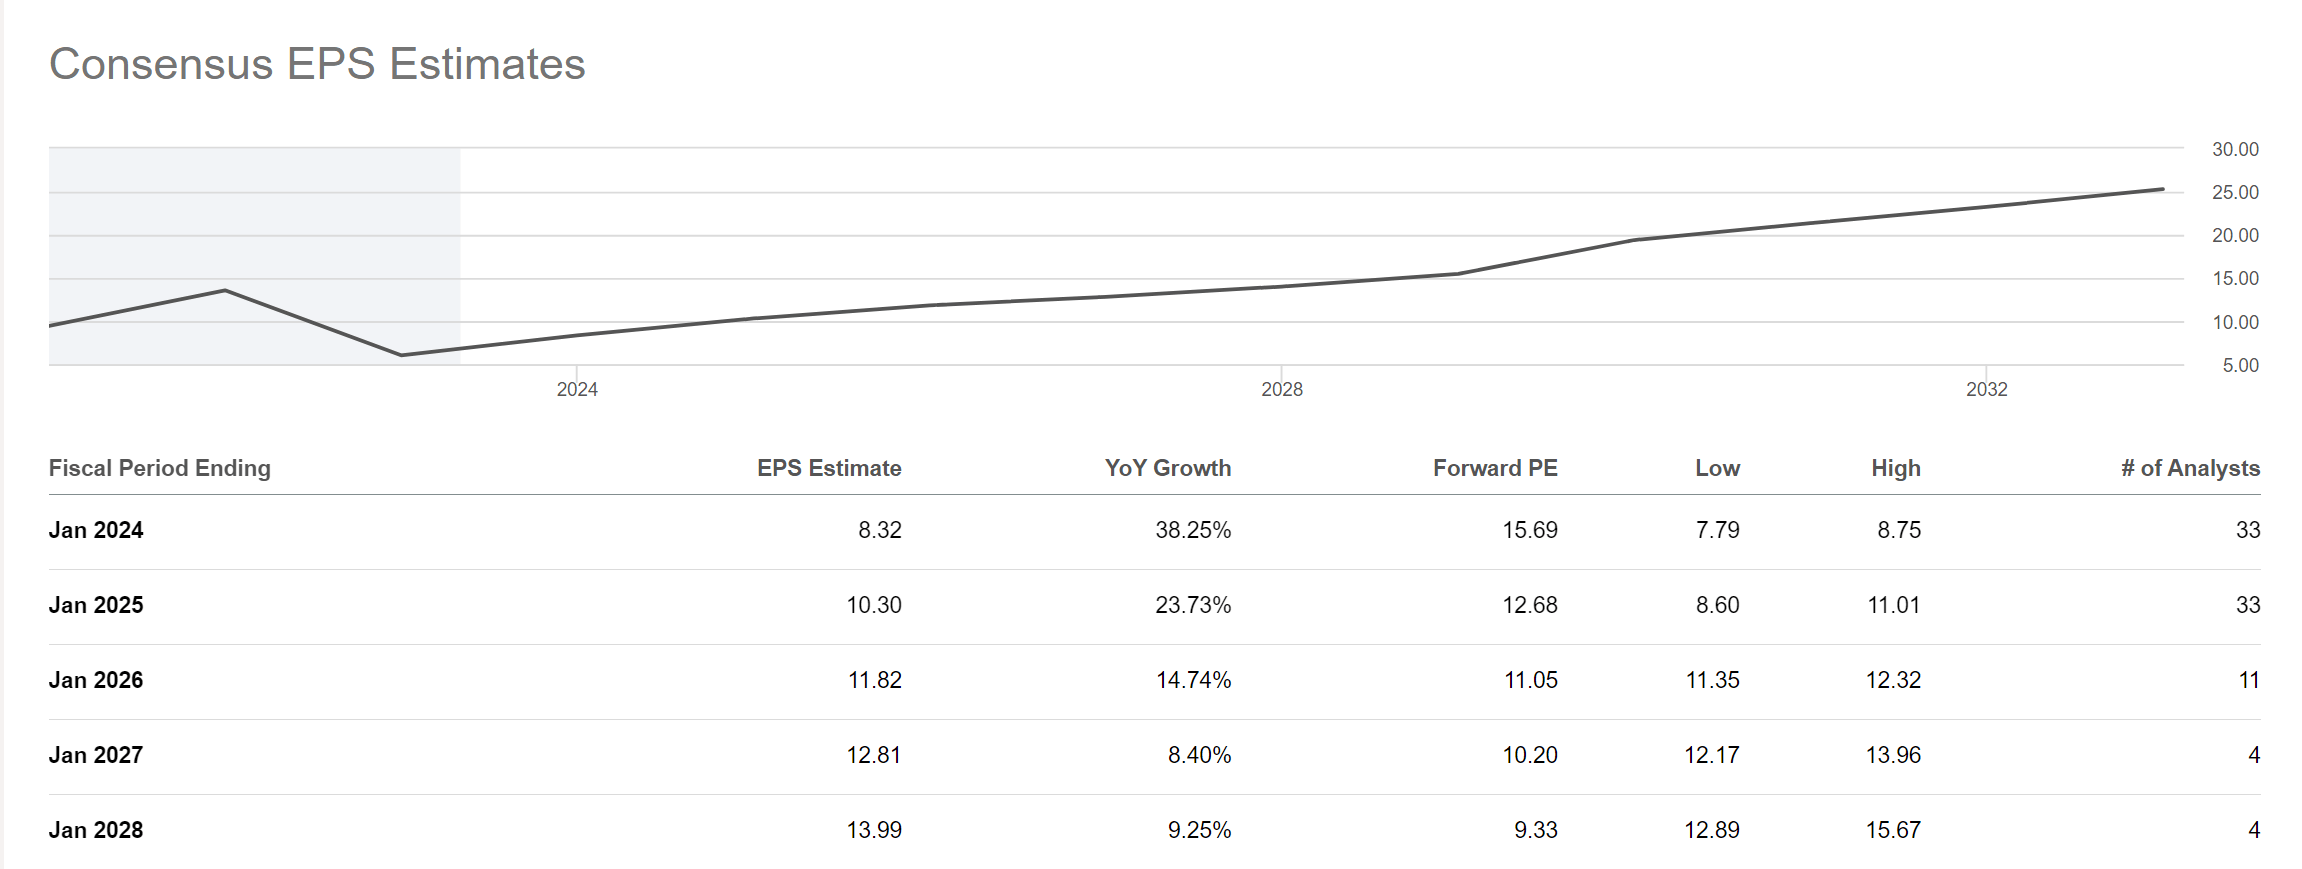
Before I dive into my scenario analysis, I will use this section to explain how I chose my growth assumptions. As we can see from the chart above, consensus expectations are for EPS to increase substantially in 2023 and continue to grow from there. Overall, the implied EPS CAGR from 2022 to 2027 is 18.37%. I will use 18% as the growth rate in my best case scenario, which is only assigned a probability of 10%. I will use a growth rate of 15% for my base case to be slightly below consensus.
Valuation & Scenario Analysis
Author's Representation
For all my calculations of value, I will be using a discount rate of 10%. 10% is my minimum required return because this has historically been the return you can expect if you decide to just put your money in an index fund that tracks the S&P 500. Lastly, keeping the discount rate the same allows for comparability between different investments.
Also, I assign a weight of 60% to my base case, 10% to the best case, and 30% to my worst-case scenario. With that out of the way, I will move to the individual scenarios.
Scenario 1 is my base case, which assumes 15% growth for the next 5 years with a terminal multiple of 17x. Discounting the 2027 sales price back to present value yields a fair value of $127.81 for an investor with a target return of 10%.
Scenario 2 is my best case, which assumes 18% growth for the next 5 years with a terminal multiple of 20x. Discounting the 2027 sales price back to present value yields a fair value of $171.03 for an investor with a target return of 10%.
Scenario 3 is my worst case, which assumes 12% growth for the next 5 years with a terminal multiple of 15x. Discounting the 2027 sales price back to present value yields a fair value of $98.81 for an investor with a target return of 10%.
The sum of the weighted PVs is $123.43, implying the stock is currently trading around fair value.
PEG Analysis
I like to use PEG analysis to compare what the market is pricing in and compare that to consensus estimates. Based on the chart from my earnings expectations section, the average EPS that TGT is expected to earn in the next five years is 11.48. Currently, TGT trades at 11.56x this number. However, consensus estimates imply that EPS will grow at ~18% over this same 5-year period. Based on these numbers, you could argue that TGT is undervalued due to the fact that its PEG ratio is below 1. However, I would side with the market on this one due to the headwinds that TGT is likely to experience in the near term and the potential for those estimates to be revised downwards.
Risks
Perception Risk
TGT took a hit recently due to controversy surrounding how they dealt with their pride month promotional product offerings. If TGT experiences a sustained decline in perception, it could cause consumers to shop at alternative stores.
Inventory Management
If TGT's inventory shrink continues to increase, profitability will take a hit. Inventory shrink continues to be a problem across the retail industry.
Inflation & Potential Recession
TGT has already started to see a slowdown in their discretionary categories. If we see long-term inflation and a recession, these categories could see further slowdowns.
Conclusion
Overall, I expect TGT's profitability to improve this year as many of the problems from last year have improved. However, I do believe the shares currently trade around fair value and would wait until there is stabilization in TGT's discretionary categories.
As a result, I rate TGT stock a hold.
This article was written by

Analyst’s Disclosure: I/we have no stock, option or similar derivative position in any of the companies mentioned, and no plans to initiate any such positions within the next 72 hours. I wrote this article myself, and it expresses my own opinions. I am not receiving compensation for it (other than from Seeking Alpha). I have no business relationship with any company whose stock is mentioned in this article.
Seeking Alpha's Disclosure: Past performance is no guarantee of future results. No recommendation or advice is being given as to whether any investment is suitable for a particular investor. Any views or opinions expressed above may not reflect those of Seeking Alpha as a whole. Seeking Alpha is not a licensed securities dealer, broker or US investment adviser or investment bank. Our analysts are third party authors that include both professional investors and individual investors who may not be licensed or certified by any institute or regulatory body.