COWZ Vs. BUL: One Is The Best Buffett-Style ETF You Can Buy

Summary
- My family's Dividend Kings ZEUS Income Growth Portfolio aims to deliver Buffett-like returns using the world's best ETFs and blue-chip stocks.
- So we're always looking for the best ETFs to challenge what we already own to ensure an all-star portfolio to help pay medical bills and fund charitable giving.
- Pacer has created a family of FCF/EV-based ETFs, representing the best Buffett-style ETFs available. Over the last 30 years, this strategy has averaged 16.2% annual returns vs. the S&P's 11%.
- This article compares COWZ, the current king of Buffett-style value ETFs, to BUL, the growth version of the same strategy.
- Find out whether combining growth with the purest form of value can generate even better returns, or whether COWZ maintains its crown and proves that there are a few sacred cows on Wall Street.
- Looking for a portfolio of ideas like this one? Members of The Dividend Kings get exclusive access to our subscriber-only portfolios. Learn More »
Nerthuz
This article was published on Dividend Kings on Monday, June 5th.
--------------------------------------------------------------------------
Warren Buffett is a living legend and for a good reason. His dedication to patient long-term buy-and-hold investing, when combined with 60% insurance float leverage, has helped him earn an incredible 20% annual returns for nearly 60 years.
The only capitalist I know of who might have a better claim to the greatest investor of all time is Cornelius Vanderbilt, who achieved 32% annual returns for 66 years.
- turned $2,500 (inflation-adjusted) into $200 billion
- though he didn't use just stocks but built a corporate empire
Without leverage, Buffett achieved 12.8% annual returns for almost 60 years. That's about 30% better returns than the market for a very long investing lifetime.
Today, Buffett admits that he won't be able to replicate those historical returns, but that doesn't mean that we can't use his time-tested investment strategies to try to achieve Buffett-like returns.
Dividend Kings ZEUS Income Growth Portfolio
Dividend Kings ZEUS Tracker 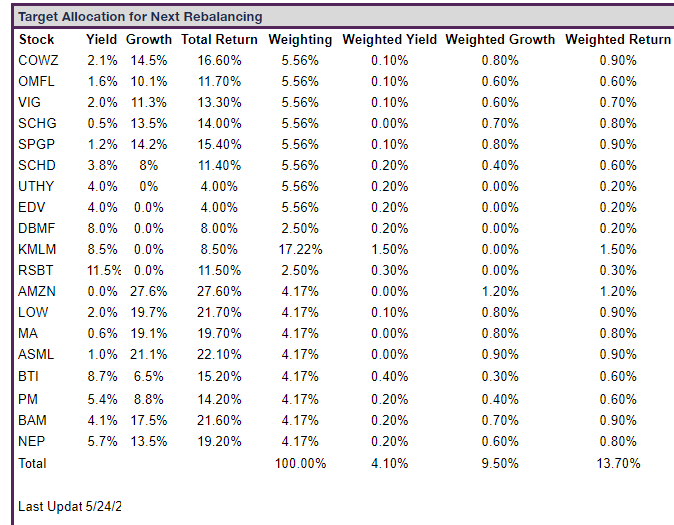
My family's Dividend Kings ZEUS Income Growth Portfolio was carefully constructed to deliver Buffett-like unlevered returns using the world's best ETFs and blue-chip stocks.
Wait a second? If the goal is 13+% long-term returns, which is Buffett's unlevered returns, can't you just buy something like Mastercard and Amazon? Sure, but there is one very important thing you have to keep in mind.
Advisor Perspectives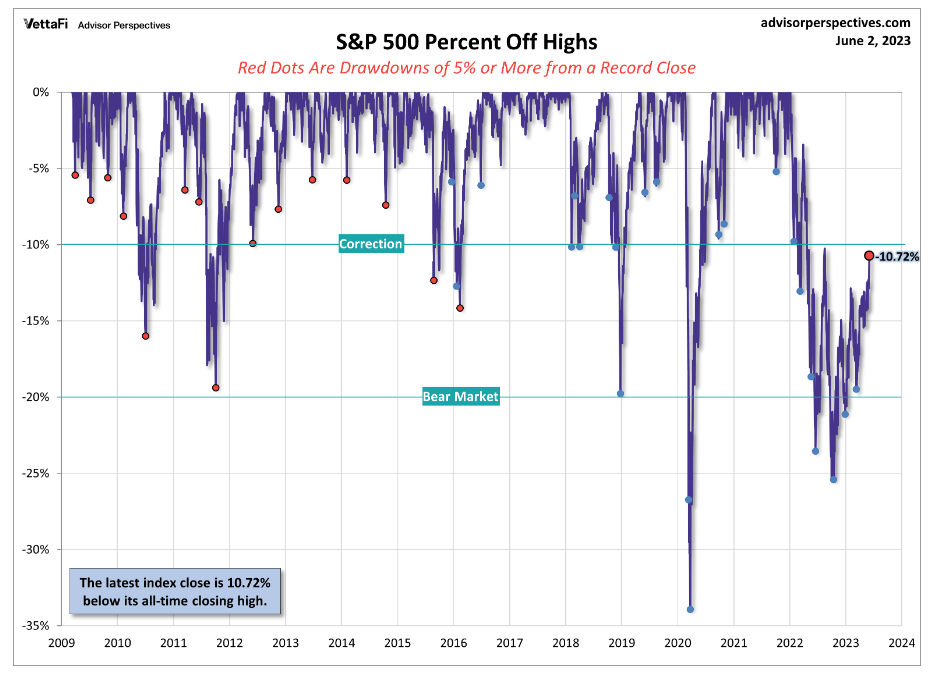
Stocks never just go straight up; there are plenty of corrections and bear markets along the way.
JPMorgan 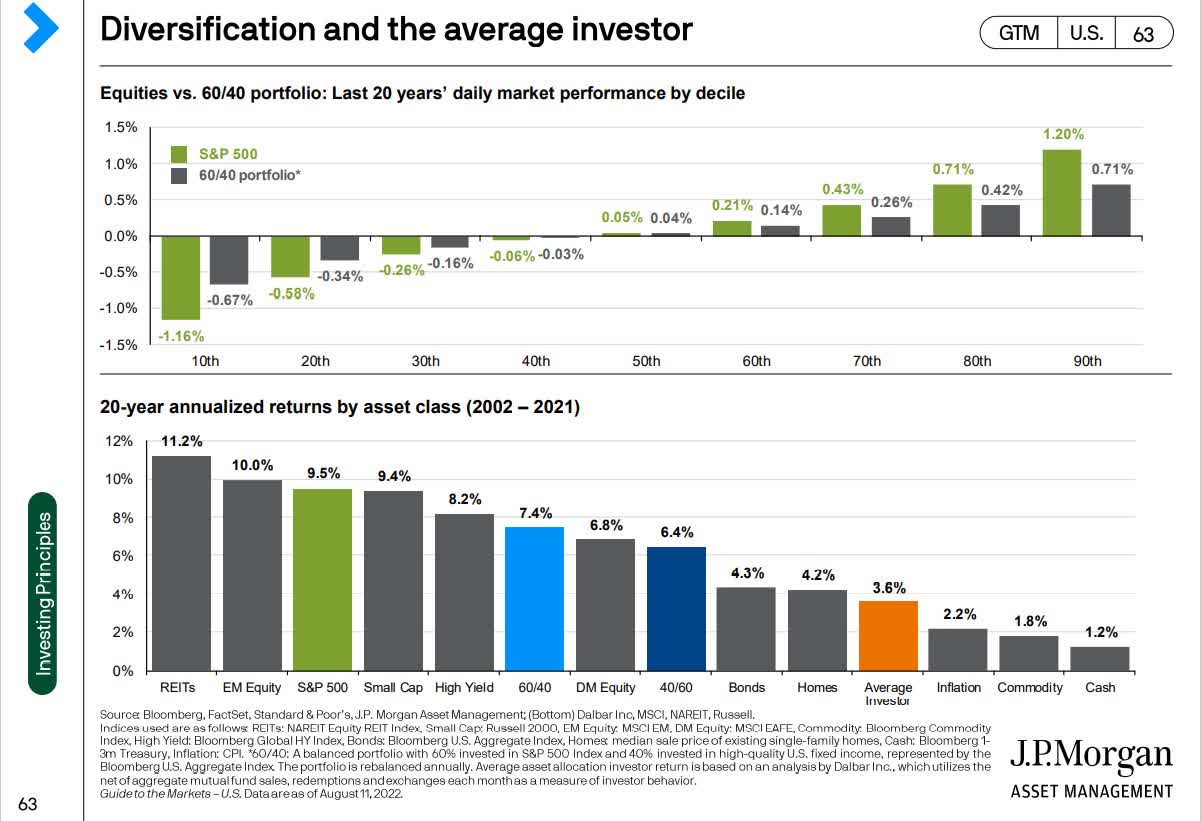
And that's why the average investor is lucky to get half the market's returns over the long-term.
If you aren't someone who can emotionally handle normal and healthy corrections, a diversified recession-optimized portfolio like ZEUS is a far better choice than swinging for the fences with a pure stock portfolio.
- It's better to be 80% perfect 100% of the time than 100% perfect 80% of the time.
Sleeping Well At Night In Even The Worst Market Crashes
| Bear Market | ZEUS Income Growth Peak Decline | 60/40 Peak Decline | S&P Peak Decline | Nasdaq Peak Decline |
| 2022 Stagflation | -11% | -21% | -28% | -35% |
| Pandemic Crash | -10% | -13% | -34% | -13% |
| 2018 Recession Scare | -13% | -9% | -21% | -17% |
| 2011 Debt Ceiling Crisis | -1% | -16% | -22% | -11% |
| Great Recession | -24% | -44% | -58% | -59% |
| Average | -12% | -21% | -33% | -27% |
| Median | -11% | -16% | -28% | -17% |
(Source: Portfolio Visualizer Premium)
Great yield, great Buffett-like returns, and volatility so low that you'll sleep well at night no matter how badly the market is crashing.
Why I Am Constantly Working To Perfect The ZEUS Income Growth Portfolio
Our family hedge fund isn't just about helping my family live our dreams.
- pay my grandparent's medical bills
- pay for my parent's retirement home
- pay for my sister's homes and kids' college education
- pay for my kid's college and philanthropy goals (charity GOAT)
It's a hedge fund built around the long-term dream of becoming a perpetual charitable trust and making a positive difference in the world.
The man who dies rich, dies disgraced." - Andrew Carnegie
givingwhatwecan
This fund will let my entire family grow rich together, save millions of lives, and even end global poverty by the year 2344.
Givingwhatwecan
Through June 5th, Helen Keller International is matching donations up to $100,000 1:1.
My family dug deep during this campaign to max out our annual giving, saving 26.33 children's lives.
No matter what happens the rest of the year, with the portfolio, economy, or even my Grandparent's health, 2023 will be a good year, possibly the greatest year ever for my family.
This brings me to today's topic, the best Buffett-style ETF you can buy.
What Is The Most Buffett-Like ETF?
Buffett started out as a Graham-style deep-value "cigar butt" investor. But when he met Charlie Munger, he switched to a "wonderful companies at a fair price" investor.
What if I told you there was a way to combine both investing styles into the ultimate Buffett-style ETF?
Deep value and high quality. It just requires the right valuation metric. One that represents the best single valuation metric of the last 30 years.
Buffett calls free cash flow "owner earnings" and considers it the purest form of intrinsic value.
- free cash flow is the money left over after running the business and investing in all future growth
- the "free" money the owner can spend sustainably
- what pays for dividends and buybacks
So free cash flow is the best valuation metric to use?
Actually, it's the 2nd best valuation metric. The best is free cash flow yield when we define it as FCF/enterprise value.
Enterprise value is market cap + net cash. It factors in debt. Think of enterprise value as the true cost of buying the entire company, including its debt.
Pacer 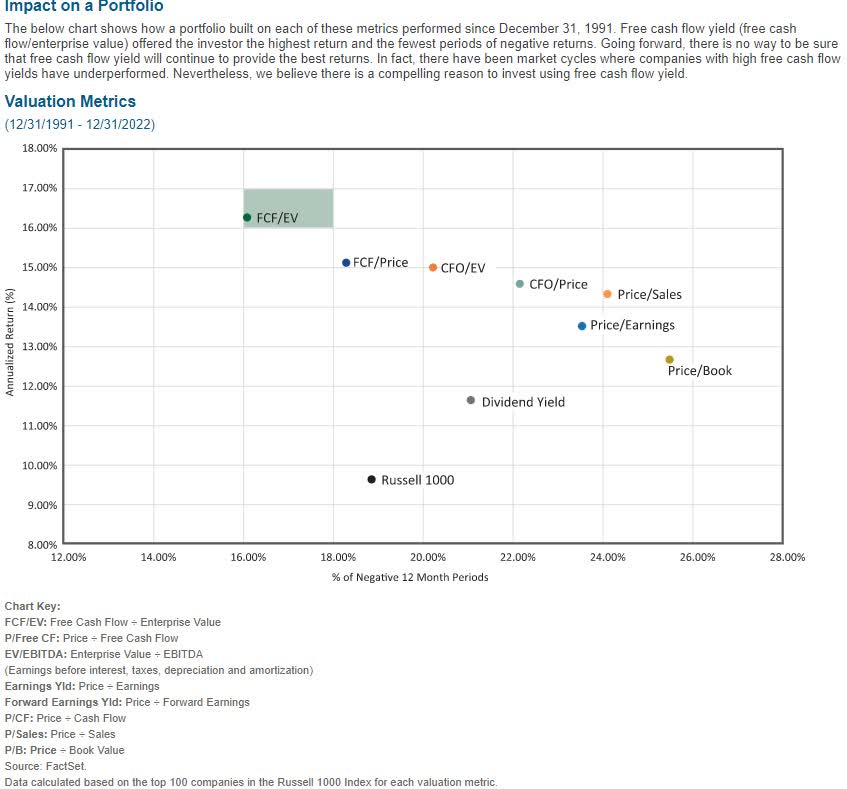
Since 1993, FCF/EV has been the most effective valuation metric you could have used, averaging 16.2% annual returns and generating positive returns in 84% of years.
That's compared to the S&P's 11.1% average annual returns and positive returns in 76% of all years.
Well, guess what? Pacer has created an entire family of FCF/EV-based ETFs, representing the best Buffett-style ETFs I've ever found.
I've already done a complete review of the Pacer US Cash Cows 100 ETF (BATS:COWZ), Pacer's flagship FCF yield-based ETF.
But now that we have our reigning champion, it's time to pit it against other value ETFs to ensure that my family and anyone who is investing in ZEUS Income Growth is entrusting their hard-earned savings to the best possible value ETF.
Enter BUL: The Challenger For The Buffett-Style Value ETF Crown
Pacer US Cash Cows Growth ETF (NYSEARCA:BUL) offers a lot of promise—the same super potential FCF yield-based approach to valuation but with a focus on growth.
If max long-term returns are the goal, this sounds like the best possible strategy, right?
"In God we trust. All others must bring data." - Edward Demings (US engineer and statistician)
Well, I'm not willing to invest my family's sovereign wealth fund into anything without first confirming with much data that it's the best option.
So let's see how BUL compares to COWZ in a head-to-head match-up for the ultimate Buffett-style value ETF crown.
Portfolio Strategy: Winner COWZ
Morningstar
COWZ is a 5-star silver-rated ETF meaning its historical returns are in the top 80% of its peers, and Morningstar is very confident it will continue outperforming over the long-term.
The 0.49% expense ratio is much higher than many popular Vanguard and Schwab ETFs, but it's well worth the extra cost, as you'll soon see.
The 2.2% yield basically matches the dividend aristocrats and is superior to the S&P's 1.7%.
Morningstar
COWZ has, over the last five years, achieved tax-adjusted returns of 9.9%, in the top 1% of mid-cap value funds.
- in the last three years, 0.81% of COWZ's gains were eaten up by taxes
Pacer 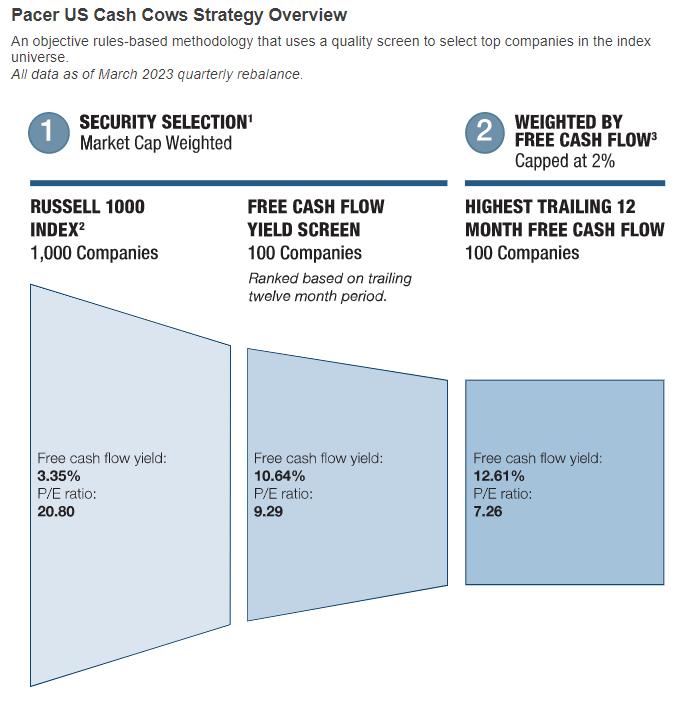
COWZ starts with the Russell 1000, the 1000 largest US companies, and then sort them by the highest 12-month trailing free cash flow yield.
It then weights the top 100 companies by free cash flow yield and applies a 2% max risk cap.
Every quarter COWZ rebalances (and so does BUL).
That's how it can achieve a deep value valuation that blows all other value ETFs out of the water.
For context, 7.3X earnings and 13% FCF/EV yield is half the valuation of private equity deals and about the same valuation as Shark Tank deals in the first ten seasons.
We're talking about anti-bubble blue-chips here. Truly Buffett-style table pounding great buys.
What about BUL?
Morningstar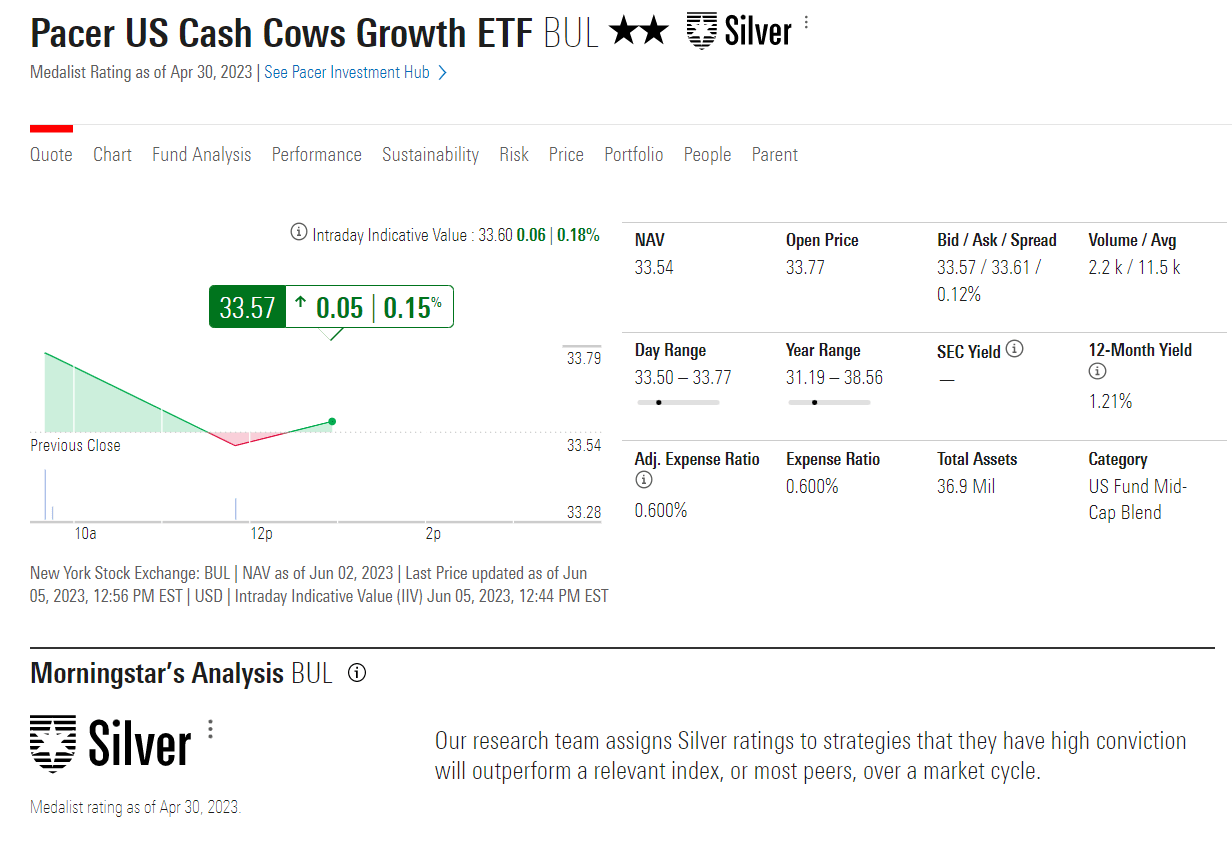
BUL is 2-star silver rated. The low star rating is likely due to when BUL launched and the poor returns growth stocks suffered in 2022.
The yield of 1.2% is about half that of COWZ and is what you'd expect from a growth ETF.
The 0.6% expense ratio is very high, 10X that of SCHG, Schwab's gold standard growth ETF.
However, if BUL can truly beat COWZ's historical strategy returns of 16% per year, then that 0.6% fee will be well worth it.
Morningstar is confident that BUL will beat mid-cap growth ETFs in the future.
Morningstar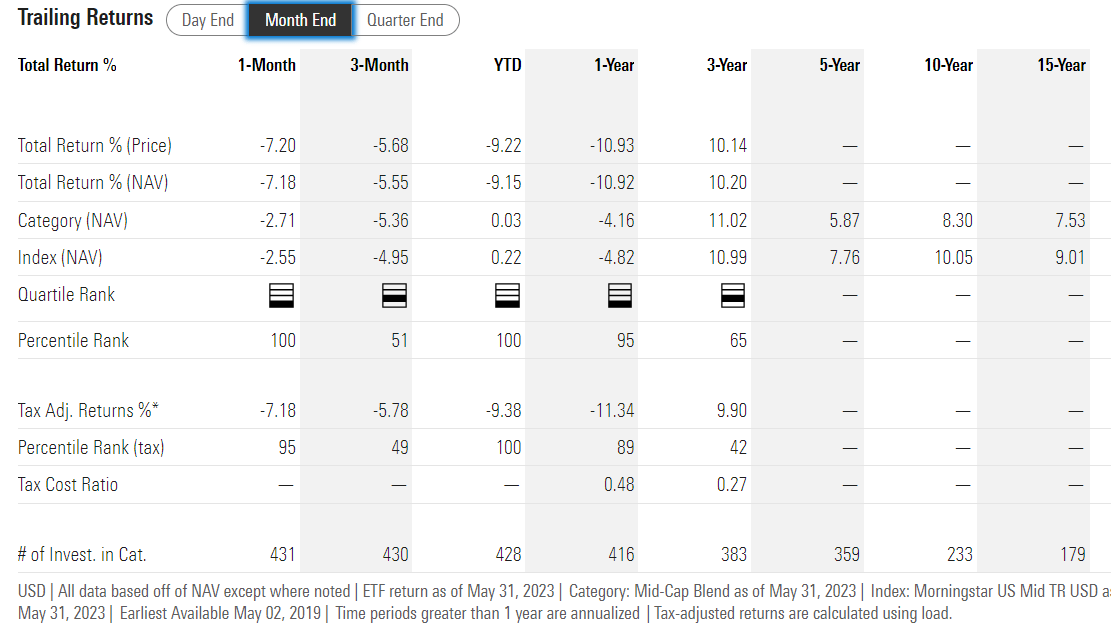
BUL launched in May of 2019 and delivered 9.9% annualized tax-adjusted returns. Note that this is less than COWZ's 20.5% tax-adjusted returns, though COWZ had an epic 2022 due to the energy stock boom.
- 0.27% tax cost ratio is about 3X better than COWZ's
Pacer 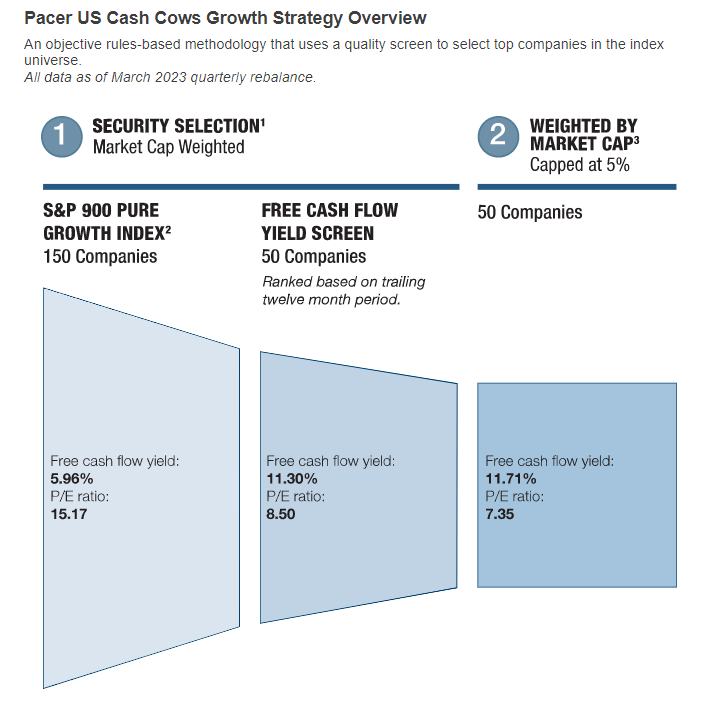
BUL starts with the S&P 900 pure growth index.
"We measure growth stocks using sales growth, the ratio of earnings change to price, and momentum. S&P Pure Growth Indices includes only those components of the parent index that exhibit strong growth characteristics and weights them by growth score. Constituents are drawn from the S&P 900, which combines the S&P 500 and S&P MidCap 400." - S&P
S&P 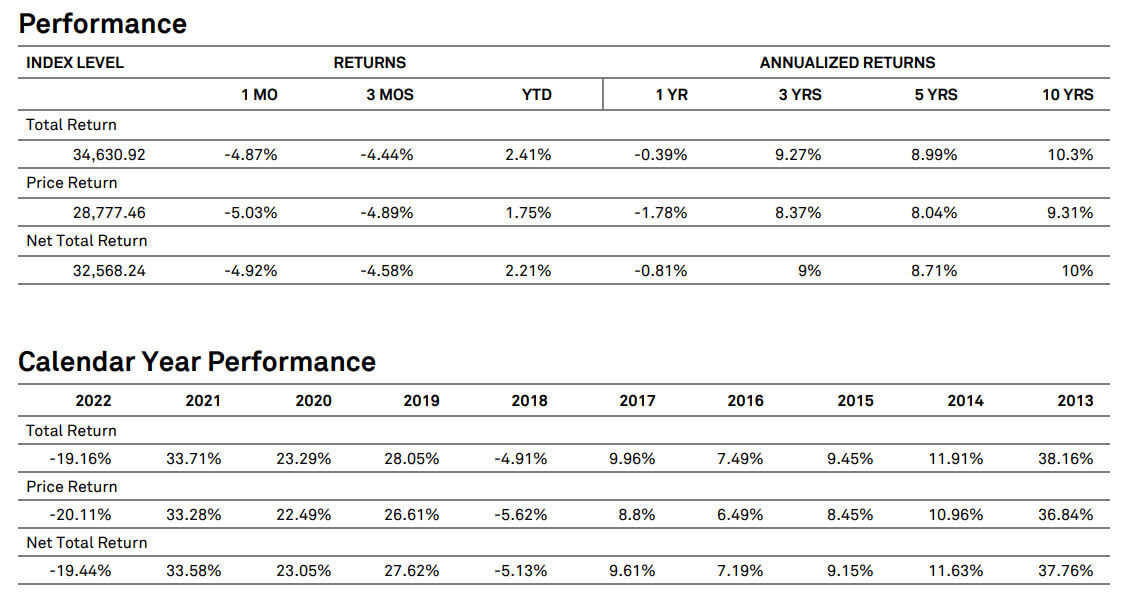
The S&P pure growth index has delivered OK returns over the long term but appears to have tripped itself up by using three growth screens that aren't actually based on growth.
- one is based on valuation
- one is based on momentum
S&P 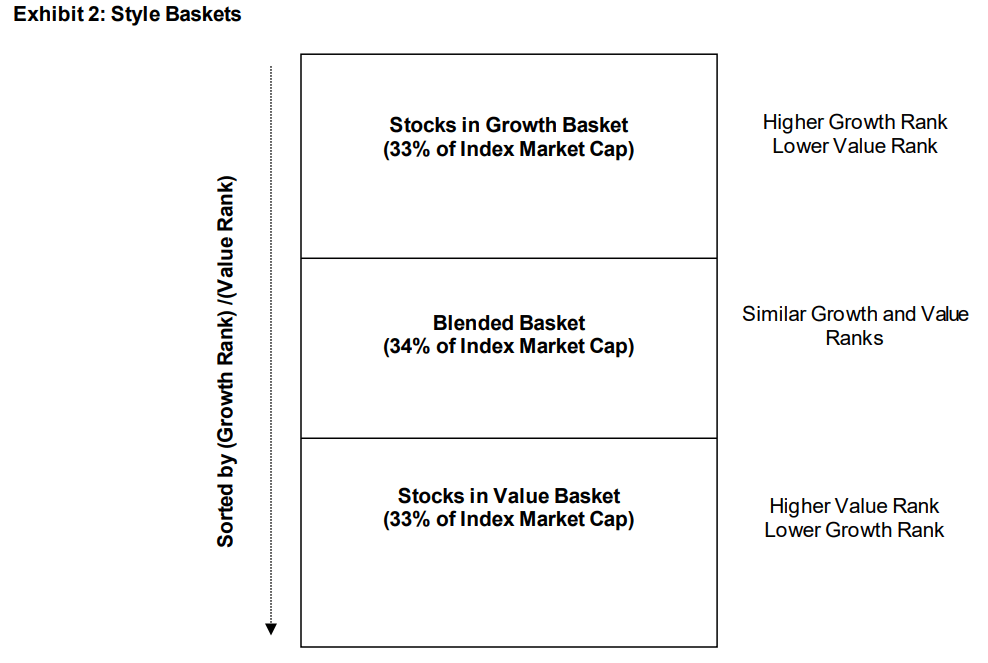
S&P wants its pure growth and pure value indexes to have no overlapping companies, which will create a problem.
- Because it screens for growth via two ways that have nothing to do with growth
In contrast, SCHG, the gold standard of growth ETFs, uses a far simpler and more effective screening process.
- 50% fastest growing S&P companies
BUL would have done better to take the SCHG index (Dow Jones U.S. Large-Cap Growth Total Stock Market Index) and then run its FCF yield screen on that.
SCHG Index Returns
S&P 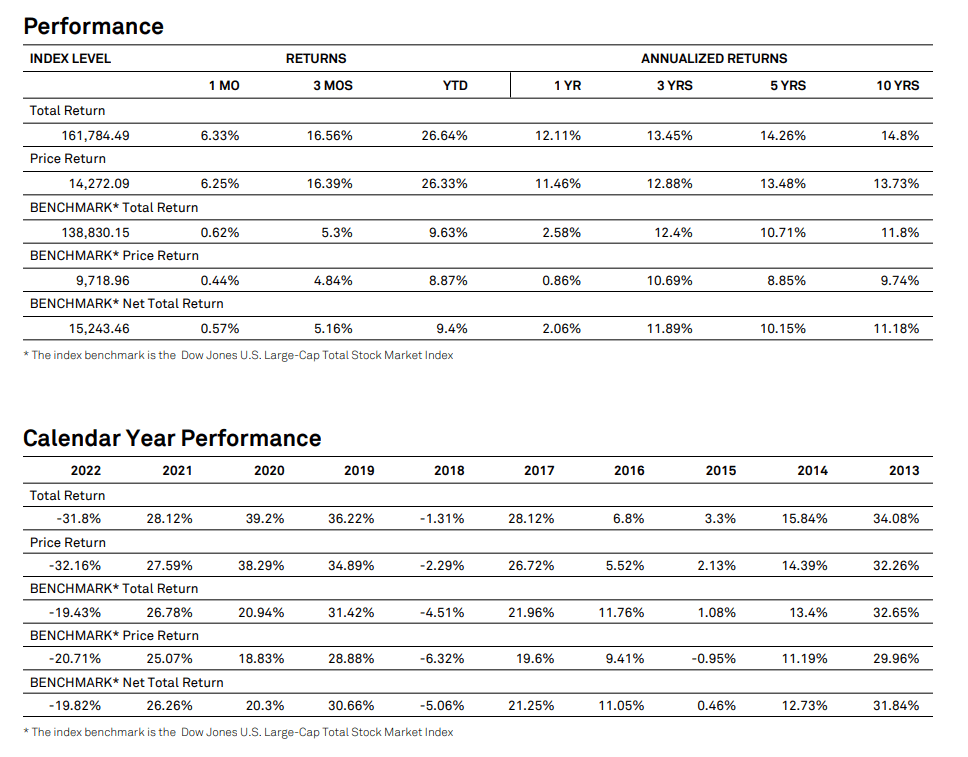
Note how SCHG's index returns have beaten BUL's by 3% annually for a decade.
- because SCHG's index is built around pure growth
- ironically the S&P pure growth index isn't built around pure growth
BUL is working with a smaller group of companies and so selects the top 50 and then weights by FCF yield with 5% max risk caps.
If those companies grow faster than the average COWZ company, a more concentrated deep-value growth portfolio should run circles around its long-term competition, including COWZ itself.
However, given that the Russell 1000 is a time-tested index and the S&P 900 Pure Growth portfolio is actually a rather lackluster growth index (due to not being purely growth screened), I must give COWZ the win in terms of strategy.
Diversification And Companies: Winner COWZ
So COWZ owns 100 stocks and BUL only 50, so naturally, COWZ is more diversified, but that doesn't necessarily mean that it wins this round.
After all, if the quality of the companies BUL owns is superior, then being more overweight, a portfolio of faster-growing and higher-quality companies could be beneficial.
In fact, BUL's tax cost ratio over the last three years is 0.27%, while COWZ's is 0.81%.
Top Holdings For COWZ And BUL
fundvisualizer fundvisualizer fundvisualizer fundvisualizer fundvisualizer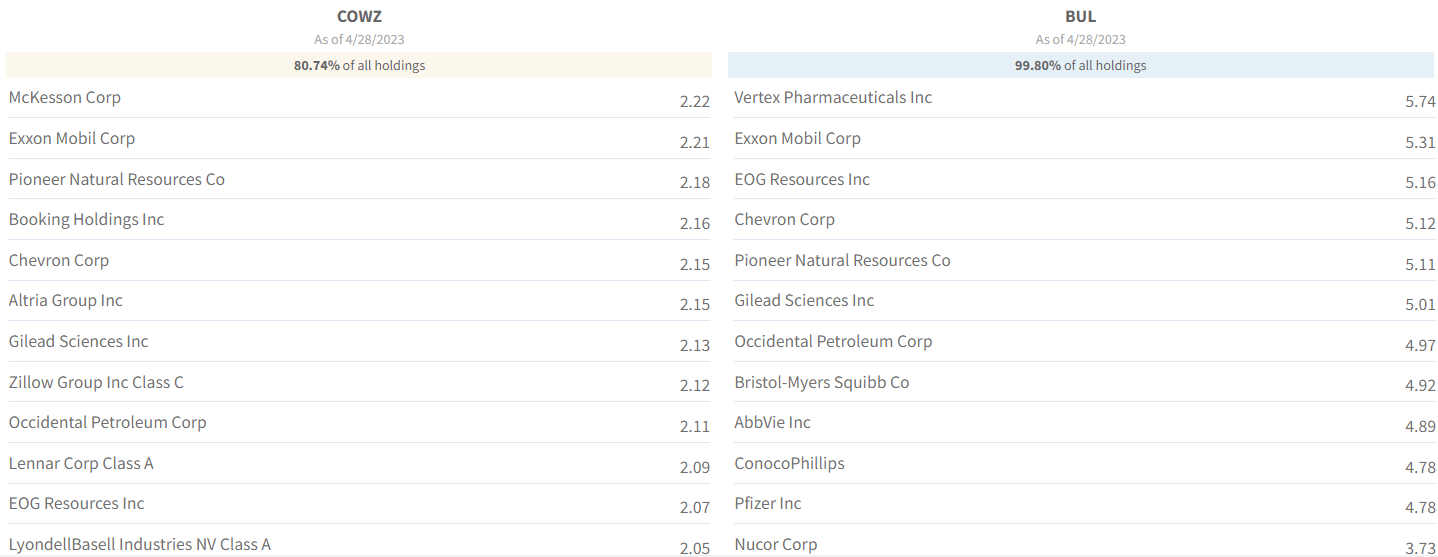
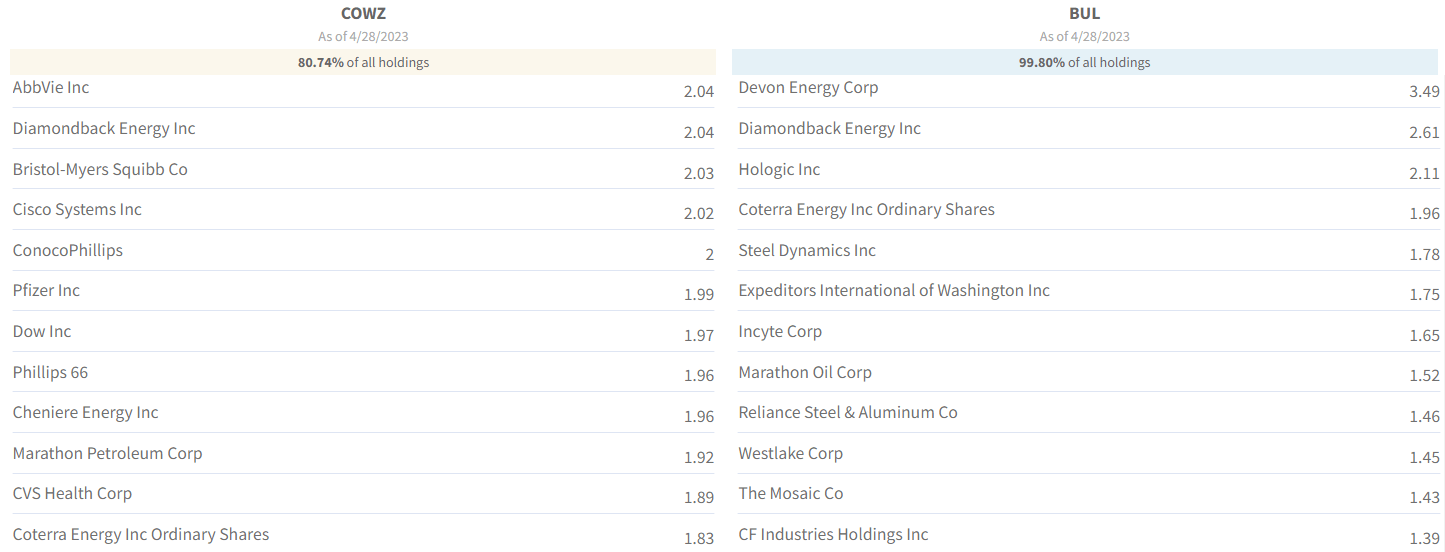
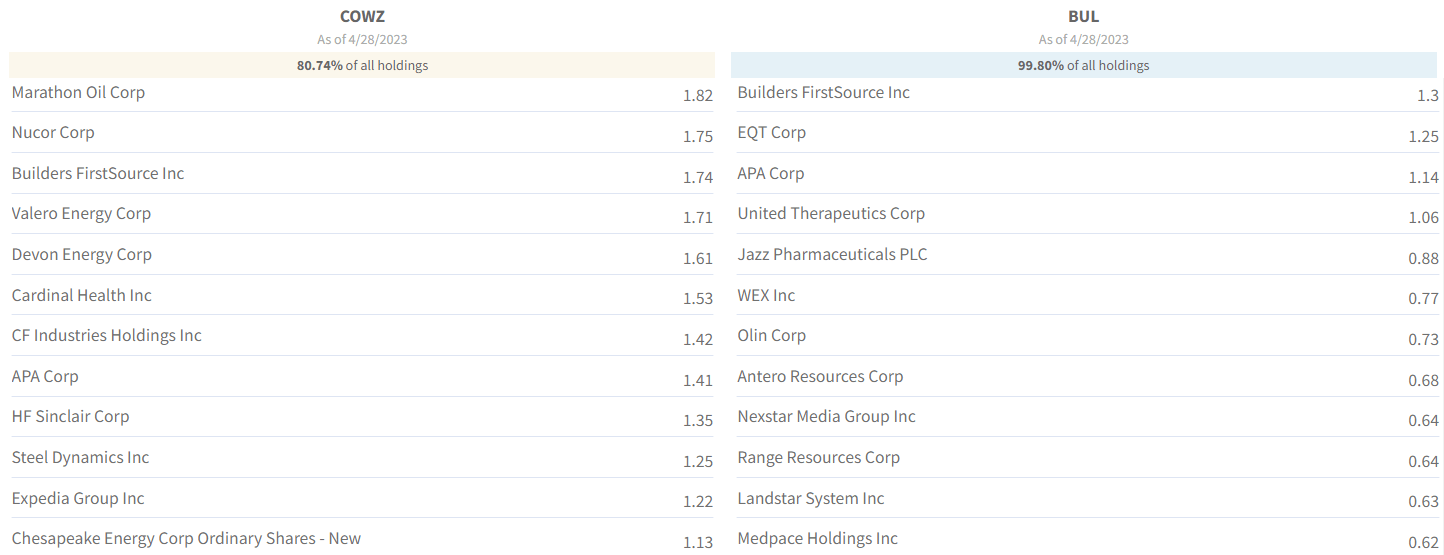

Note that both COWZ and BUL own many of the same companies, and both use a 12-month lookback.
This tells me that S&P's Pure Growth index is based on 12-month trailing sales growth, 12-month valuation, and 12-month momentum.
SCHG Index
S&P 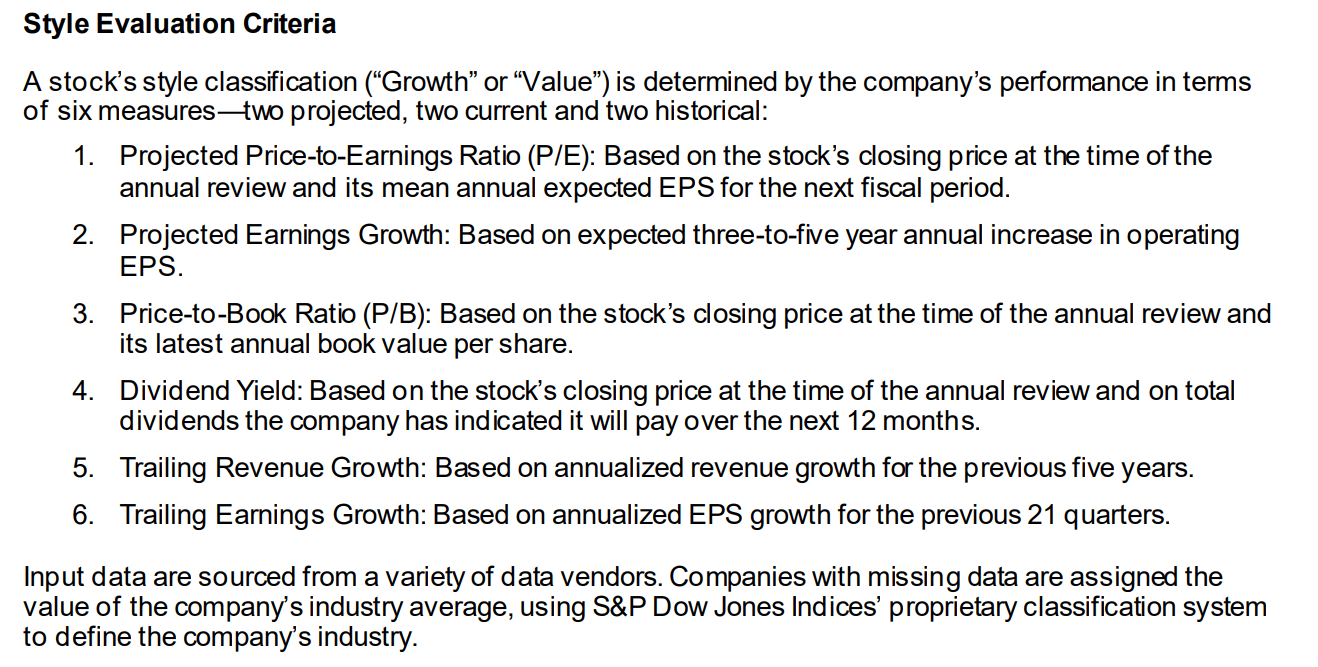
SCHG's index is built around S&P's estimate of 3- to 5-year future growth, not 12-month trailing sales growth plus 12-month momentum.
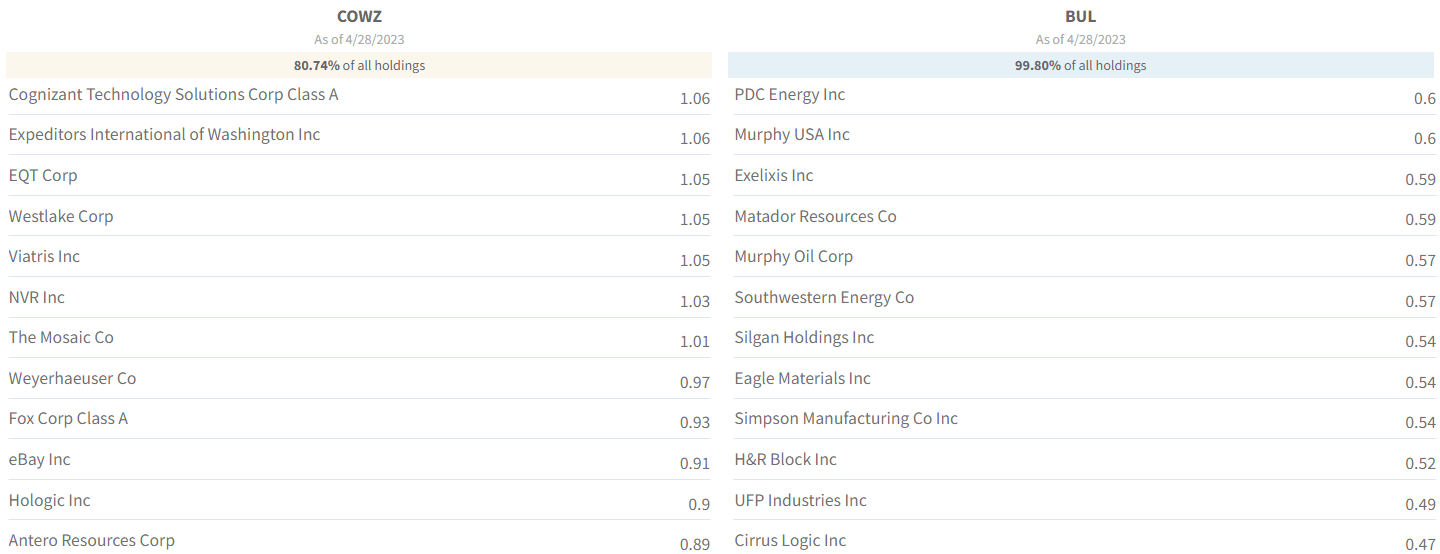
fundvisualizer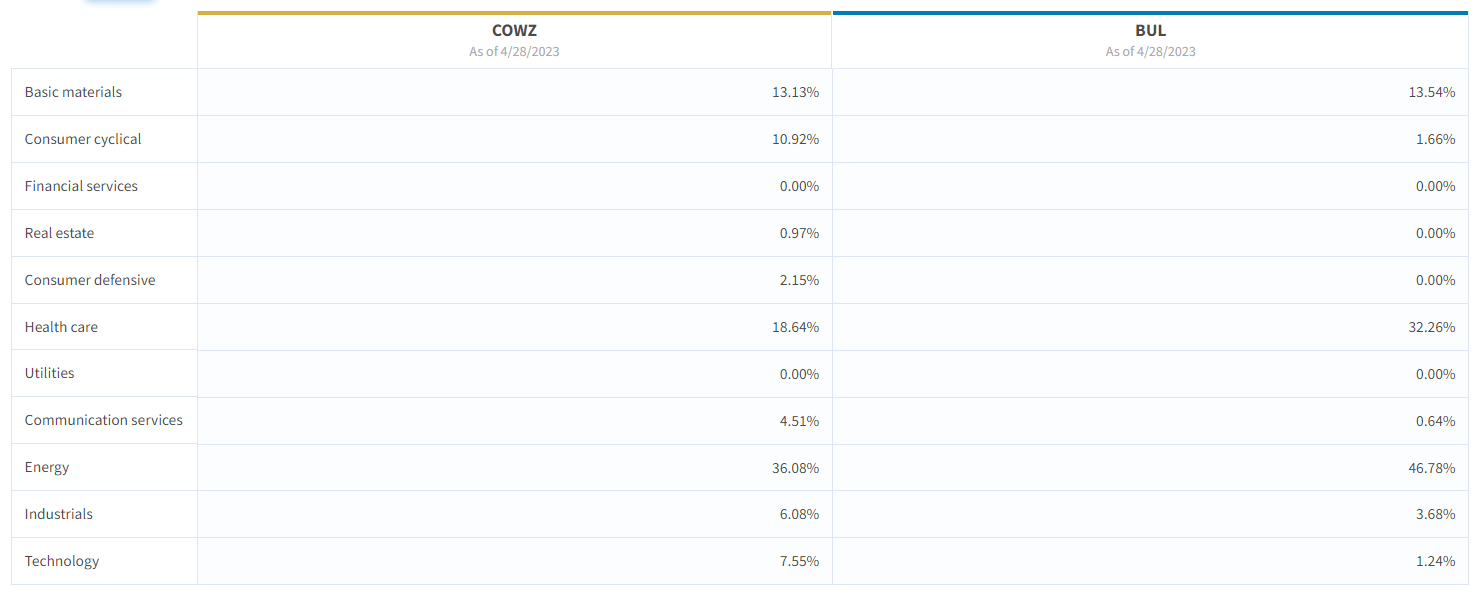
BUL has trouble in that FCF/yield screening will naturally select for fast growth over the last year.
That's the same time frame S&P uses for the Pure growth index.
Thus effectively, BUL is pretty much a more concentrated and slightly more expensive version of COWZ.
In fact, BUL is almost 50% energy, so it likely had a very bad May.
Wide Moat Research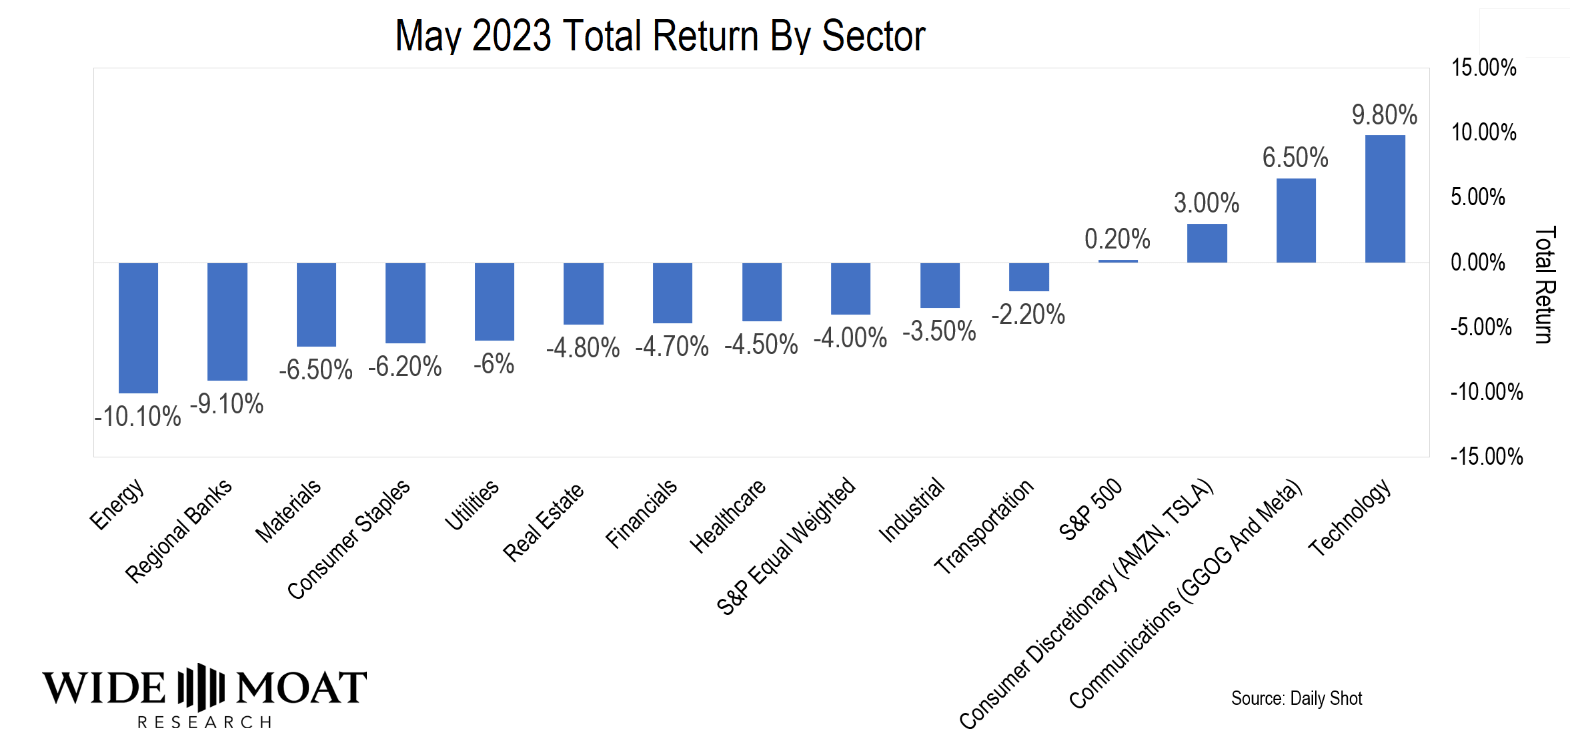
May was a house of horrors for almost every sector except for tech.
Ycharts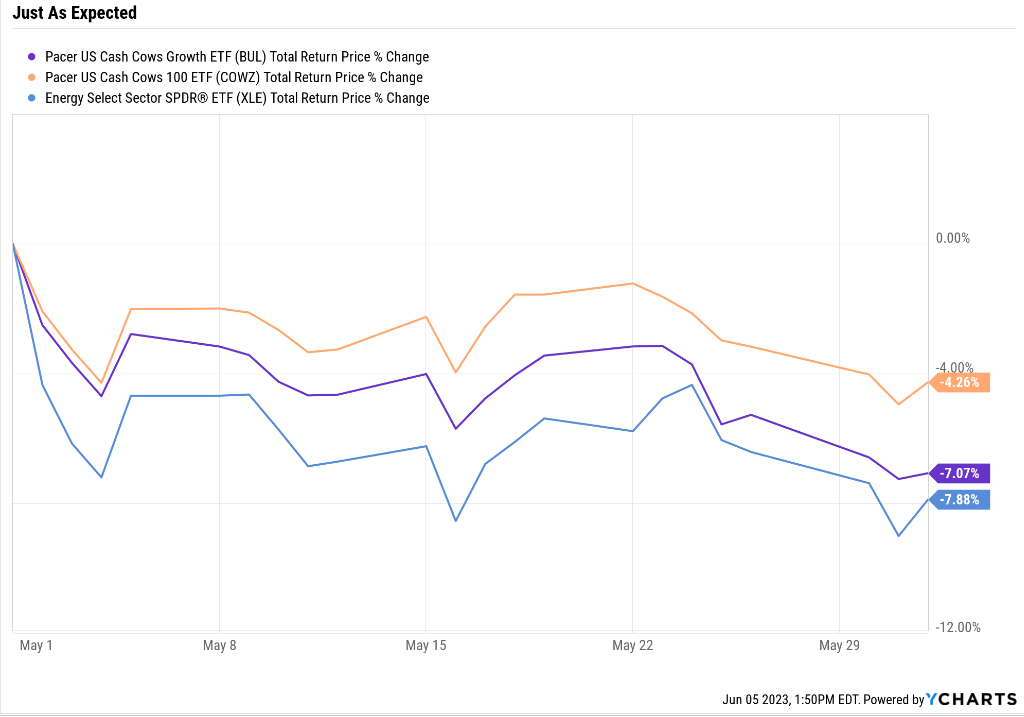
Just as expected, when energy got crushed, BUL went straight down with it.
COWZ benefited from 64% of the portfolio that wasn't energy, the single worst sector of May.
Company Quality: Winner BUL (By A Hair)
Both BUL and COWZ effectively own the same companies, but let's see how BUL's more concentrated approach does when it comes to quality.
BUL Quality
Morningstar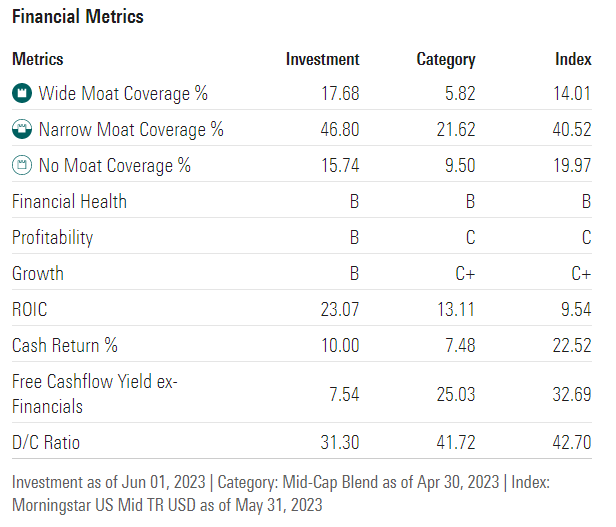
84% moaty companies with 23% returns on invested capital and solid financial health.
COWZ Quality
Morningstar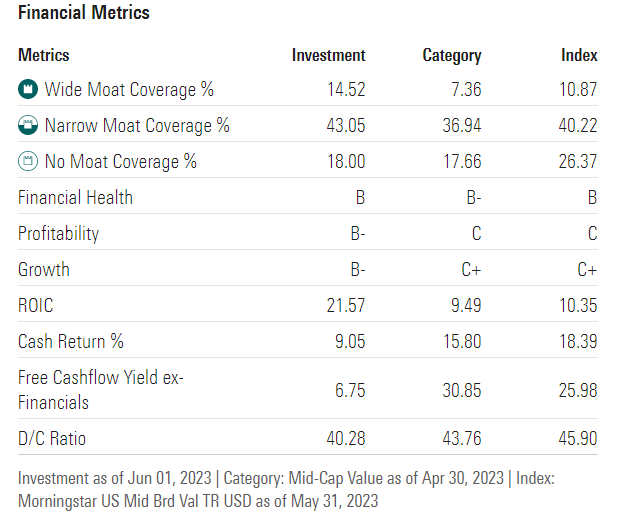
BUL's portfolio is slightly moatier (by 2%) and has just barely higher returns on capital and slightly better profitability and growth scores from Morningstar.
Effectively it owns the same companies, but the weighting is different, giving BUL the slightest of wins.
Consensus Future Return Potential: Winner BUL
Long-term returns are a function of starting yield and growth, with valuations canceling out over the very long-term.
Ritholtz Wealth Management 
Morningstar has dropped key fundamentals on ETFs (hopefully only temporarily), so I can't see how fast their analysts think each ETFs earnings will grow.
Fortunately, FactSet has forward growth forecasts for all ETFs so that we can use that as a proxy for long-term growth.
| Investment Strategy | Yield | LT Consensus Growth | LT Consensus Total Return Potential | Long-Term Risk-Adjusted Expected Return |
| BUL | 1.2% | 15.3% | 16.5% | 11.6% |
| COWZ | 2.2% | 12.0% | 14.2% | 9.9% |
| Vanguard Dividend Appreciation ETF | 1.9% | 10.7% | 12.6% | 8.8% |
| Nasdaq | 0.8% | 11.2% | 12.0% | 8.4% |
| Schwab US Dividend Equity ETF | 3.6% | 7.6% | 11.2% | 7.8% |
| Dividend Aristocrats | 1.9% | 8.5% | 10.4% | 7.3% |
| S&P 500 | 1.7% | 8.5% | 10.2% | 7.1% |
(Source: FactSet Research Terminal)
BUL's more concentrated approach to the same companies appears to potentially boost long-term growth by 3%, or 25%. However, the lower yield means that the actual superior return potential is a less impressive 1.7%.
Note that both ETFs are expected to deliver superior returns to any other major popular ETF and Buffett's historically unlevered 12.8% annual returns.
Given that the historical returns for this strategy are 16.2% annually, I consider these to be reasonable estimates.
OK, so it's now tied at 2-2, so let's break the tie by testing the theory with facts, historical returns, and income growth.
Historical Returns And Income Growth: Winner COWZ
Total Returns Since 2019
Portfolio Visualizer Premium 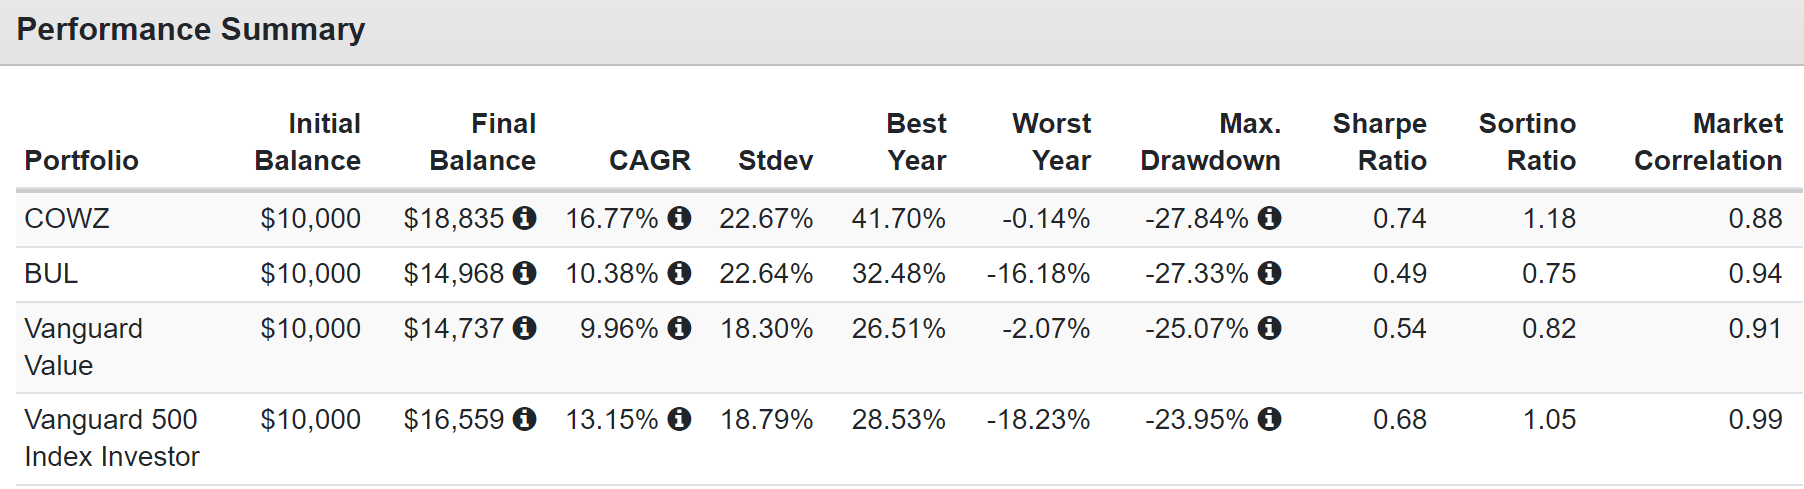
Note that these are more concentrated cyclical portfolios than VTV or the S&P and thus have higher volatility and similar peak declines in bear markets.
COWZ managed to beat BUL by a wide margin as well as the S&P 500.
How many value ETFs do you know that have beaten the tech-heavy S&P during a raging tech bull market? COWZ is one of just three I know of.
- I'll be writing about the other two in coming articles
Portfolio Visualizer Premium 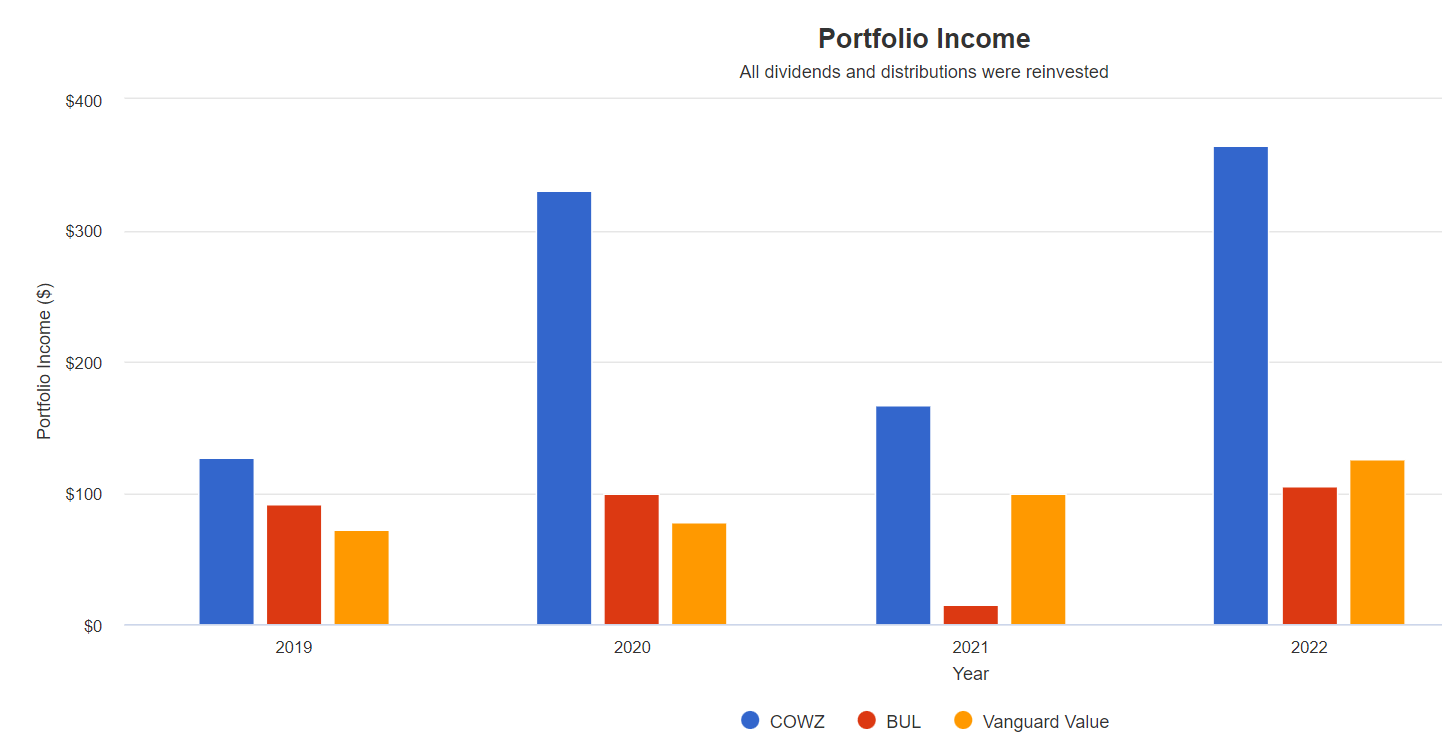
Both COWZ and BUL have cyclical dividends because of how often they rebalance and because they tend to own cyclical companies.
Since 2019 COWZ has delivered far superior income to BUL and VTV.
Here is how COWZ compares to VTV and the S&P since its inception on January 1st, 2017.
Portfolio Visualizer Premium 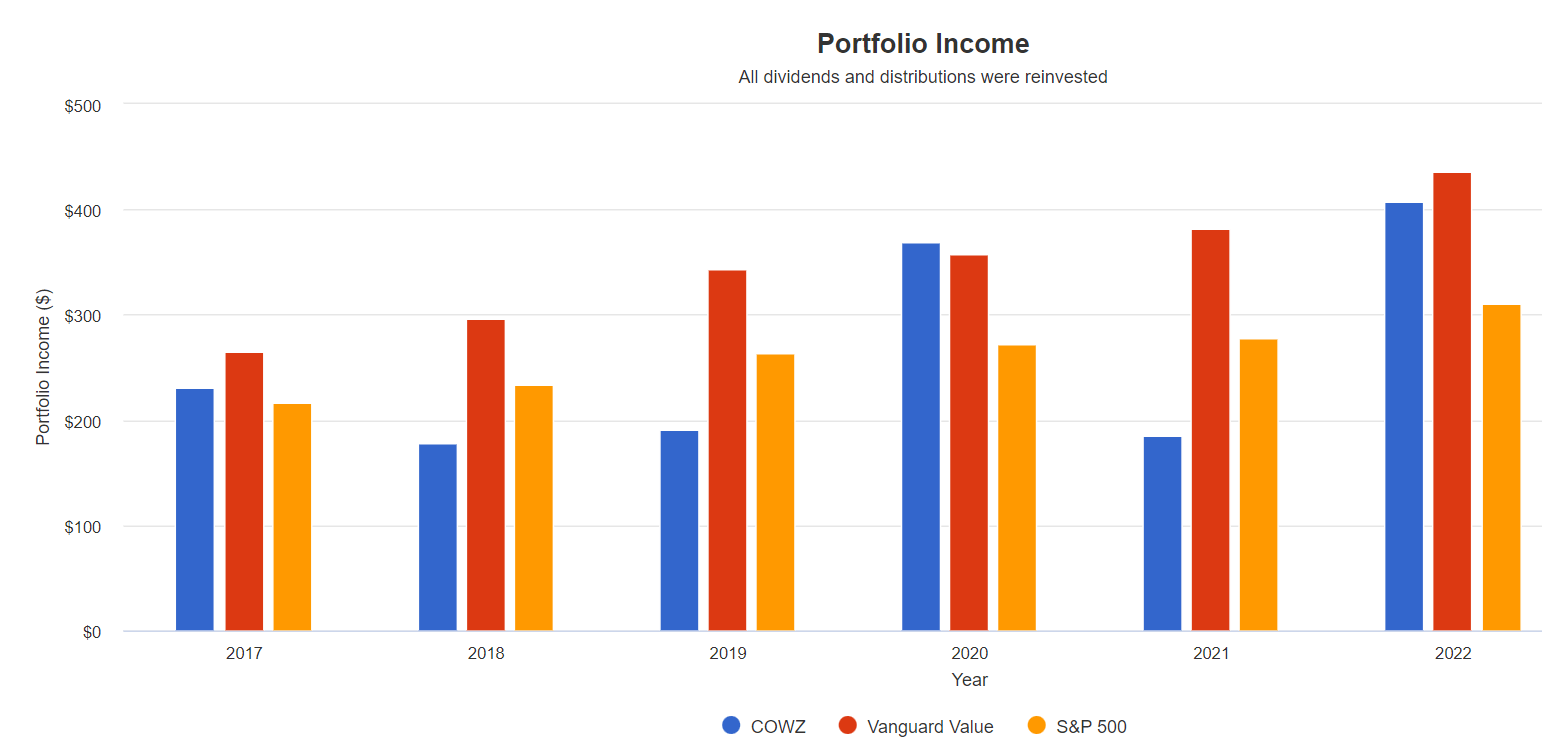
S&P 500 since 2017: 5.9% annual dividend growth
Vanguard Value since 2017: 9.2% annual dividend growth
COWZ since 2017: 10.1% annual dividend growth
COWZ might not have the most dependable income every year, but its historical income growth rate is one of the best of any dividend ETF I've seen.
- FactSet 14% long-term consensus income growth forecast
Risk Profile: Why These ETFs Aren't Right For Everyone
No ETF is perfect, and there are a few things you might not like about this ETF.
First, it uses trailing 12-month FCF yield and doesn't use forward-looking data. That means that cyclical sectors like energy can become heavily overweight for up to a year, even after they stop generating the best free cash flow yield.
Second, the turnover of these ETFs is going to be naturally higher than a core value ETF like VTV since it rebalances once per quarter.
COWZ
Morningstar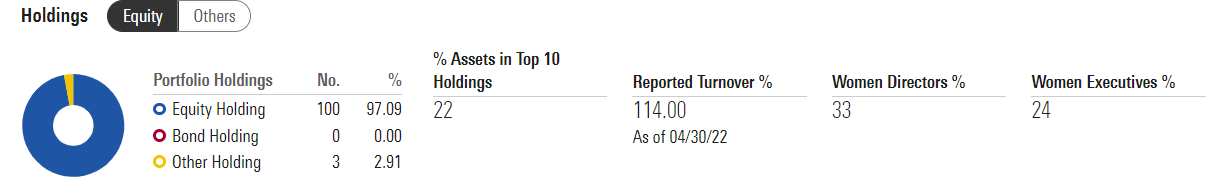
BUL
Morningstar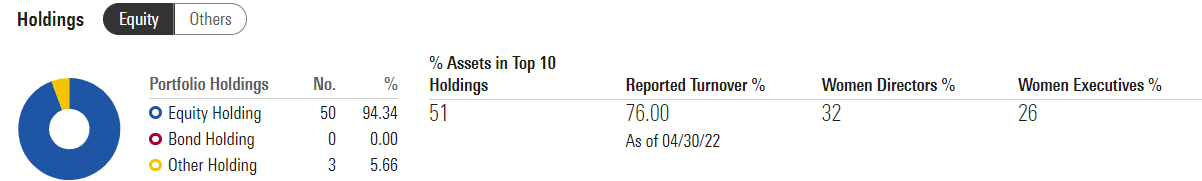
When you rebalance every quarter, the more concentrated portfolio will have a lower turnover rate and, thus small tax-cost ratio.
The biggest drawback to the Cash Cows FCF yield strategy is that you have to have strong confidence in the strategy because every quarter, there can be a significant change in the stocks these ETFs own.
In other words, it's not like owning VIG, SCHG, or SCHD, where you can be pretty sure what you own and that if the price falls, you can buy the same companies at a cheaper price.
These are pure value ETFs and are only appropriate for someone looking for the purest form of value ETF.
They will likely deliver outstanding returns over time but might underperform the S&P and Nasdaq by large amounts for long periods of time.
Bottom Line: COWZ Remains The Best Buffett-Style Value ETF You Can Buy
COWZ remains the king of Buffett-style value ETFs for two key reasons.
First, its underlying investable universe, the Russell 1000, represents most of what MSCI considers "world-beater blue-chips".
It then applies the purest and most effective valuation screen of the last 30 years to these world-beaters.
It then weights by FCF yield and applies prudent 2% risk caps.
Thus it creates the ultimate diversified FCF yield-based portfolio. And that's why it's historically delivered 16.2% average annual returns, running circles around the S&P and even the Nasdaq.
- 11% S&P
- 13.5% Nasdaq
The downsides of COWZ are similar to the main downside of any value ETF; for long periods of time, value could underperform.
So far, COWZ hasn't, but anyone owning it must be prepared for some "market envy" that might last several years.
That's where the promise of BUL, a deep value growth version of COWZ, comes in. However, while the theory behind BUL is brilliant, the execution leaves a lot to be desired.
BUL's index is fundamentally inferior to SCHG's gold standard growth index (top 50% of S&P companies by 3- to 5-year expected growth).
What's more, because Pacer rebalances quarterly, even if it were using SCHG's index and selecting superior companies, it would own those coiled spring hyper-growth stocks for just a few months.
In other words, while BUL is a very solid value ETF and theoretically will outperform COWZ over time, I am personally not adding it to my family's ZEUS Income Growth portfolio.
For one thing, it's significantly more expensive than COWZ and, thus far, has yet to prove that its more concentrated approach will actually deliver superior results.
If you want to own BUL? God bless it's a great ETF. But remember that I'm seeking the best of the best. And in those terms, one thing is clear.
In the pasture of ETF investing, COWZ truly stands as the bovine monarch, embodying the quintessence of Buffett-style value investing.
It grazes amidst the regal blue-chip companies, its regalia gleaming under the sun of superior returns.
So, investors, don your crowns and embrace COWZ as your sovereign of choice, for in this royal court of funds, COWZ is clearly no BUL - it is indeed the king and one sacred cow I can endorse owning.
----------------------------------------------------------------------------------------

Dividend Kings helps you determine the best safe dividend stocks to buy via our Automated Investment Decision Tool, Zen Research Terminal, Correction Planning Tool, and Daily Blue-Chip Deal Videos.
Membership also includes
Access to our 13 model portfolios (all of which are beating the market in this correction)
my correction watchlist
- my $2.5 million family hedge fund
50% discount to iREIT (our REIT-focused sister service)
real-time chatroom support
real-time email notifications of all my retirement portfolio buys
numerous valuable investing tools
Click here for a two-week free trial, so we can help you achieve better long-term total returns and your financial dreams.
This article was written by

Adam Galas is a co-founder of Wide Moat Research ("WMR"), a subscription-based publisher of financial information, serving over 5,000 investors around the world. WMR has a team of experienced multi-disciplined analysts covering all dividend categories, including REITs, MLPs, BDCs, and traditional C-Corps.
The WMR brands include: (1) The Intelligent REIT Investor (newsletter), (2) The Intelligent Dividend Investor (newsletter), (3) iREIT on Alpha (Seeking Alpha), and (4) The Dividend Kings (Seeking Alpha).
I'm a proud Army veteran and have seven years of experience as an analyst/investment writer for Dividend Kings, iREIT, The Intelligent Dividend Investor, The Motley Fool, Simply Safe Dividends, Seeking Alpha, and the Adam Mesh Trading Group. I'm proud to be one of the founders of The Dividend Kings, joining forces with Brad Thomas, Chuck Carnevale, and other leading income writers to offer the best premium service on Seeking Alpha's Market Place.
My goal is to help all people learn how to harness the awesome power of dividend growth investing to achieve their financial dreams and enrich their lives.
With 24 years of investing experience, I've learned what works and more importantly, what doesn't, when it comes to building long-term wealth and safe and dependable income streams in all economic and market conditions.
Analyst’s Disclosure: I/we have no stock, option or similar derivative position in any of the companies mentioned, and no plans to initiate any such positions within the next 72 hours. I wrote this article myself, and it expresses my own opinions. I am not receiving compensation for it (other than from Seeking Alpha). I have no business relationship with any company whose stock is mentioned in this article.
I will be adding COWZ to my family portfolio at the next rebalancing.
Seeking Alpha's Disclosure: Past performance is no guarantee of future results. No recommendation or advice is being given as to whether any investment is suitable for a particular investor. Any views or opinions expressed above may not reflect those of Seeking Alpha as a whole. Seeking Alpha is not a licensed securities dealer, broker or US investment adviser or investment bank. Our analysts are third party authors that include both professional investors and individual investors who may not be licensed or certified by any institute or regulatory body.