Where's Your Carbon Gone? How The S&P PACT Indices Decarbonize

Summary
- Between February 2021 and February 2023, the S&P 500 Net Zero 2050 Paris-Aligned ESG Index reduced its carbon intensity by 24.1%.
- We run a carbon attribution analysis on the maintained positions to see that’s driving their net growth in carbon intensity.
- Carbon attribution analysis can be a powerful tool for market participants looking to reduce the carbon footprint of their investments, and it can be used to help maintain their decarbonization.
Sakorn Sukkasemsakorn
By Kieran Trevor
As the world aims to decarbonize toward a net zero future, the importance of tracking the carbon footprint of portfolios is becoming a primary focus for many investors; specifically, to measure and understand whether portfolios emulate the emission reduction targets needed globally to help mitigate the impacts of climate change.
For investors, tracking an EU Paris-Aligned Benchmark, such as S&P 500 Net Zero 2050 Paris-Aligned ESG Index, may provide a way to avoid the hassle, as the index embeds an initial 50% greenhouse gas (GHG) reduction and a minimum 7% year-over-year decarbonization rate in its construction, while historically maintaining similar performance characteristics to the benchmark index.1

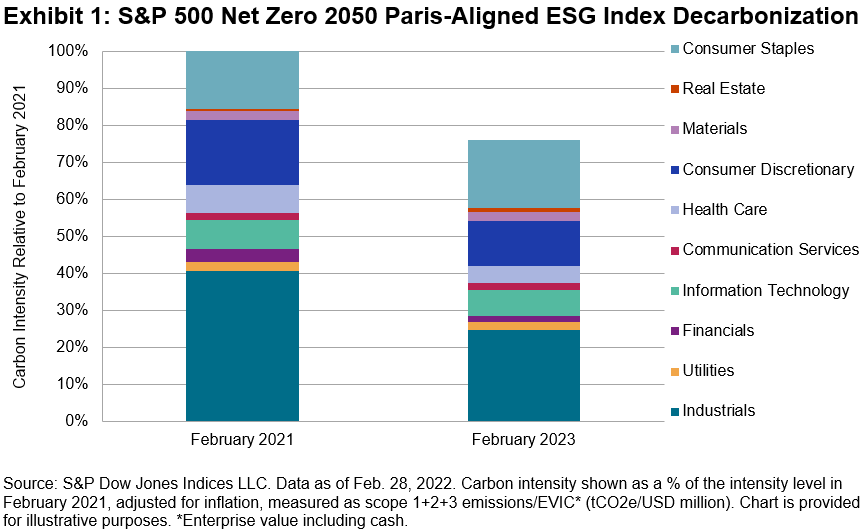
Between February 2021 and February 2023, the S&P 500 Net Zero 2050 Paris-Aligned ESG Index reduced its carbon intensity by 24.1%, beating its minimum required decarbonization of 13.5% in that same period. The Industrials, Financials, Health Care and Consumer Discretionary sectors all decarbonized by over 30%, with carbon intensity increases observed in Consumer Staples, Real Estate and Communication Services. All Energy stocks were excluded from the index throughout due to the index construction.
But how has this decarbonization been achieved? We break this down to uncover the real drivers of the changes in carbon footprint within the index.
Carbon Attribution
First, we split the index into three separate groups:
- Incoming Positions: Representing constituents that only joined the index after February 2021;
- Outgoing Positions: Representing constituents that were removed from the index between the February 2021 and February 2023; and
- Maintained Positions: Representing constituents that were present in the index since February 2021.
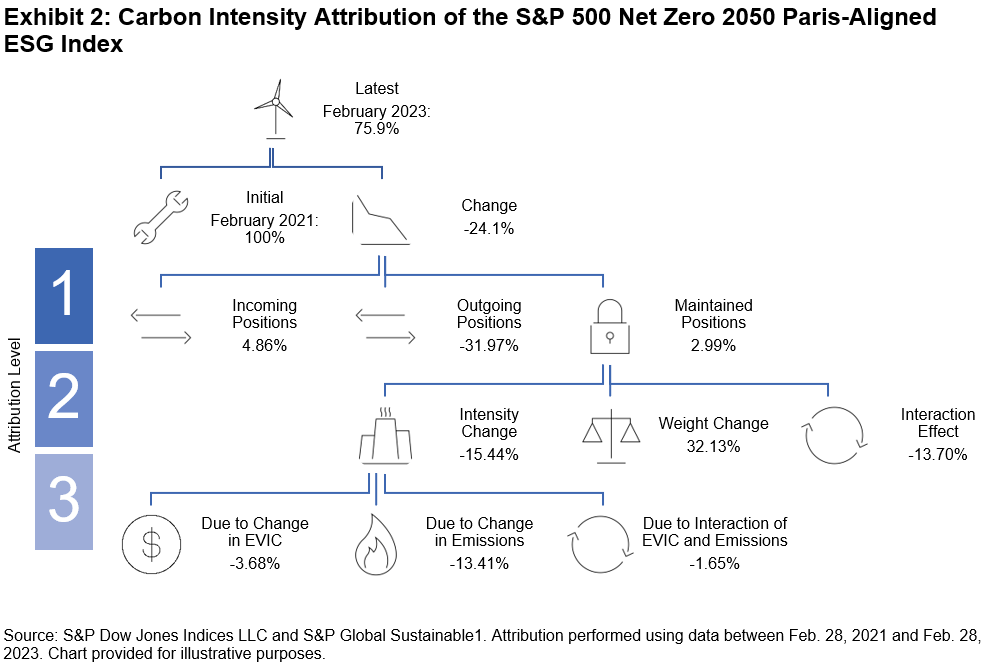
Splitting the index into distinct periods allows us to more accurately attribute how carbon came into the index and how it has been removed. In this case, a large proportion of carbon has been removed through divestment of companies from the index, which accounted for a decarbonization of 32% (see Exhibit 2) relative to the base-level carbon intensity. Meanwhile, new companies entering the index increased carbon intensity by 4.9%, and companies that maintained their position in the index in both periods were responsible for a rise of 3%.

Next, we run a carbon attribution analysis on the maintained positions to see what’s driving their net growth in carbon intensity. We observe that this was driven entirely by weighting within the index, which given the reduced count of overall companies in the index during this time from 358 to 313, makes intuitive sense. The interaction effect between a company’s weight and its carbon intensity also helped reduce the index-level carbon footprint. Company behavior, represented by the actual carbon intensity change of companies in the index, had a reductive impact on overall intensity by over 15%.
Finally, breaking this promising trend down further by attributing the intensity change, we observe that this effect was driven in part by market conditions (EVIC), but mostly by emission reductions of these companies, while the interaction effect between these two was minimal.
Carbon attribution analysis can be a powerful tool for market participants looking to reduce the carbon footprint of their investments, and it can be used to help maintain their decarbonization. Luckily, the S&P PACT™ (S&P Paris-Aligned & Climate Transition Indices may provide a way to make this easier, embedding a 7% year-over-year decarbonization rate by design and aligning with a net zero future.
1 See S&P Paris-Aligned & Climate Transition (PACT) Indices Methodology for more information.
Disclosure: Copyright © 2022 S&P Dow Jones Indices LLC, a division of S&P Global. All rights reserved. This material is reproduced with the prior written consent of S&P DJI. For more information on S&P DJI please visit S&P Dow Jones Indices. For full terms of use and disclosures please visit Terms of Use.
Editor's Note: The summary bullets for this article were chosen by Seeking Alpha editors.
This article was written by
