MTUM: Lacks Momentum Much Of The Time

Summary
- The iShares MSCI USA Momentum Factor ETF is not recommended due to factor decay, which refers to the length of time it takes for a stock to lose its properties.
- Momentum has the fastest decay, with an optimal rebalance for the momentum factor at 3 months, while MTUM's rebalance frequency is 6 months.
- Due to factor decay, MTUM should rebalance every 3 months to maintain its position in the momentum premium; it is only recommended for the first few months following rebalance.

Momentum is like a rocket ship. Be careful it doesn't come back down on you.
tiero/iStock via Getty Images
Momentum is one of the most well-studied premiums in academic literature. The basic concept is this: what out-performs continues to out-perform.
So why are we reluctant to recommend the iShares MSCI USA Momentum Factor ETF (BATS:MTUM)? It boils down to one reason – factor decay.
But before we explain that concept, let’s have a general overview of MTUM and how it is constructed.
Momentum Factors
There are numerous ways to design a momentum filter. The most basic approach is to look for stocks with the highest trailing performance over the past 3, 6, 9 or 12 months. Many practitioners will also remove the most recent month’s performance since short-term returns tend to be contrarian signals and work directly against momentum. What does this mean?
- A stock which steadily goes up 100% in a year may have momentum which means more upwards price action.
- A stock which is flat all year but then goes up 100% in one month is likely to go down short-term.
MTUM uses a different approach than what is described above and which is exceedingly close to a modified Sharpe Ratio. While they use the 6-month and 12-month trailing price performance, they divide this by the annualized standard deviation of weekly returns from the past 3 years. Come again?
To illustrate, suppose we have two stocks.
- Stock A went up 100%
- Stock B went up 50%
Traditional momentum measures would have us buying stock A. But what is the average volatility of those stocks? Suppose stock A had annualized volatility of 40% while stock B had annualized volatility of 17%. With this we can compute the custom momentum score.
- Stock A has a momentum score of 100 / 40 = 2.5
- Stock B has a momentum score of 50 / 17 = 2.94
In this scenario, stock B had a higher risk-adjusted momentum score even though the returns of stock A were higher. Like I said earlier, it is basically a modified Sharpe Ratio of returns over volatility. There is a little more to it than that - but this is the main thrust of the fund.
I don’t consider their approach to momentum to be good or bad – just note the difference of how they determine momentum from the classical definition.
Factor Decay
But the real reason why I don’t recommend buying MTUM is due to factor decay. What is factor decay? This refers to the length of time it takes for a stock to lose its properties. What is momentum today might not be momentum in a year from now. The properties of a stock change over time.
A recent paper looked into how fast factor information decays on a global scale. They considered the factor styles of value, quality, low volatility, investment, and momentum. What they found is that momentum has the fastest decay.
- The optimal rebalance for the momentum factor? 3 months
- The rebalance frequency of MTUM? 6 months
This means that depending on when you purchase MTUM, you may not be investing in the momentum premium at all.
Let’s test this.
Reconstructing the MTUM Strategy
Using the tools at Portfolio123.com I recreated MTUM's momentum ranking system. Because this fund invests in mid-cap to large-cap stocks I will use the Russell 1000 as my base universe.
Next, I go to the iShares website and I look up what the holdings were as of December. I import those into Portfolio123 and analyze the average momentum ranking as of December 1st compared to the Russell 1000 index. It is no surprise that the average rank is over 87 out of 100.
Just remember that a momentum rank of 50 is neutral and means there is no momentum at all. A rank above 50 means positive momentum and a rank below 50 is negative momentum.
Let’s fast-forward to the end of May 2023 when we are due for our next rebalance. The average rank has now fallen to 57 out of 100.
To illustrate, look at CVS. The 6 month chart will show the momentum ranking (green dotted line) and the price of CVS (red line). What started as very high momentum soon crashed.
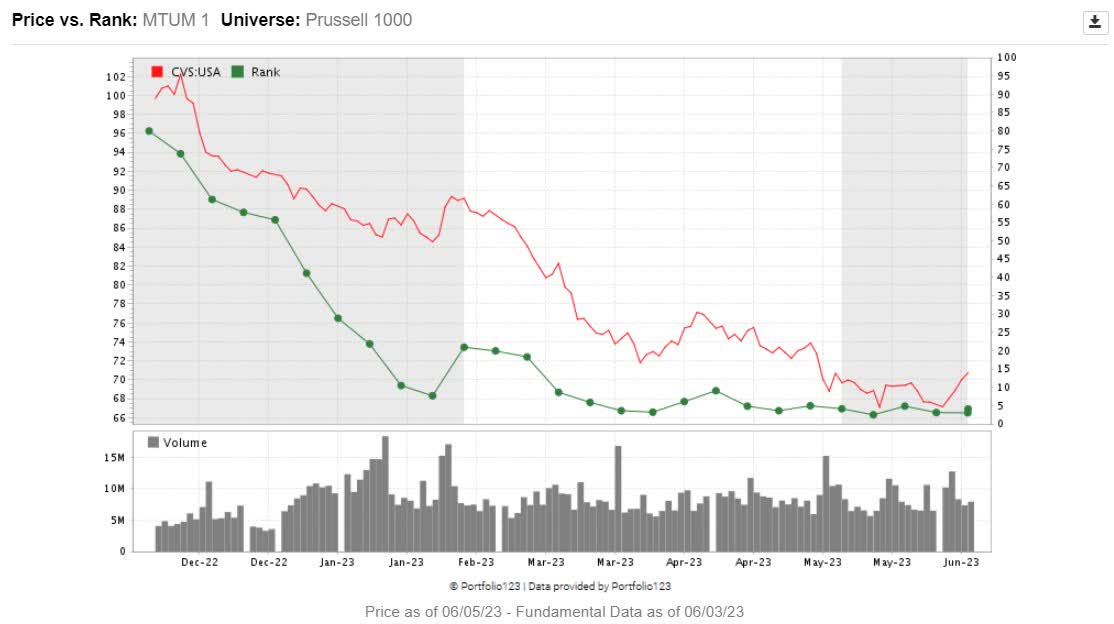
CVS Momentum Ranks (portfolio123.com)
This makes me think about NVDA’s rapid climb and high momentum. Will the recent purchase of NVDA favor the momentum premium or might it revert back down to some longer-term average? MTUM will re-examine this in another 6 months which seems far too long in my opinion.

NVDA Rising Momentum (portfolio123.com)
This final chart shows you the equal-weight average momentum score of MTUM between rebalance points. The ETF went from moderately high momentum to almost being completely momentum neutral.
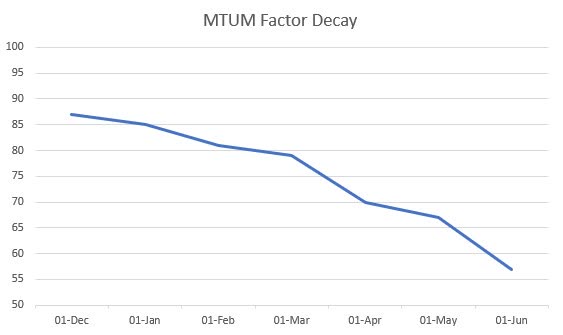
MTUM Momentum Score (Portfolio123.com)
Summary
MTUM is a momentum factor tilt fund with one major flaw - it rebalances too infrequently. Due to factor decay, MTUM should rebalance every 3 months to keep the fund well placed in the middle of the momentum premium. As such, we recommend holding MTUM only for the first few months following rebalance. After that, it really isn’t a great momentum fund until the start of the next rebalance.
This article was written by

Analyst’s Disclosure: I/we have no stock, option or similar derivative position in any of the companies mentioned, and no plans to initiate any such positions within the next 72 hours. I wrote this article myself, and it expresses my own opinions. I am not receiving compensation for it (other than from Seeking Alpha). I have no business relationship with any company whose stock is mentioned in this article.
Seeking Alpha's Disclosure: Past performance is no guarantee of future results. No recommendation or advice is being given as to whether any investment is suitable for a particular investor. Any views or opinions expressed above may not reflect those of Seeking Alpha as a whole. Seeking Alpha is not a licensed securities dealer, broker or US investment adviser or investment bank. Our analysts are third party authors that include both professional investors and individual investors who may not be licensed or certified by any institute or regulatory body.