Marathon Oil: Strong Headwinds Ahead

Summary
- Marathon Oil Corporation first quarter revenues were $1,680 million, down 4.2% from the same quarter a year ago and down 3.1% sequentially.
- Production of oil equivalent was 396K Boep/d in 1Q23.
- I recommend buying Marathon Oil stock between $22.15 and $21.5, with potential lower support at $20.7.
- Looking for a helping hand in the market? Members of The Gold And Oil Corner get exclusive ideas and guidance to navigate any climate. Learn More »
imaginima
Part I - Introduction
Texas-based energy explorer Marathon Oil Corporation (NYSE:MRO) released its first-quarter 2023 results on May 3, 2023. It is time to analyze the quarter's results and try to guess how the near future will affect the stock price.
Note: This article updates my April 12, 2023, article. I have followed MRO on Seeking Alpha since Dec. 2020.
The company owns a multi-basin portfolio in the USA. Furthermore, MRO is also producing oil from Equatorial Guinea, West Africa.
The company expects significant financial uplift in Equatorial Guinea in 2024 from increasing global LNG exposure due to legacy Henry Hub contracts expiration.
Note: MRO owns a 63% operated working interest under a production sharing contract in the Alba field and an 80% operated working interest in Block D. Also, MRO owns a 52% interest in Alba Plant LLC, accounted for as an equity method investment, which uses an onshore LPG processing plant located on Bioko Island.
MRO Map Assets (MRO Presentation)
Furthermore, on November 2, 2022, Marathon Oil acquired the Eagle Ford assets of Ensign Natural Resources (a private company) for total cash consideration of $3.0 billion.
1 - 1Q23 Results Snapshot
Marathon Oil Corporation reported a first-quarter 2023 adjusted net income per share of $0.67, which beat analysts' expectations compared to $1.02 a year ago. The decrease was due to weaker oil realizations in the USA and higher overall costs.
The company reported revenues of $1.680 billion, down 4.2% from the year-ago sales of $1.753 billion. The company used the excess cash from this favorable environment to maintain a quarterly dividend of $0.10 per share and execute $334 million in share repurchases in the first quarter.
Marathon Oil's domestic production of 396K Boep/d compared to 341K Boep/d last year. Free cash flow in 1Q23 was $333 million.
MRO 1Q23 Highlights (MRO May Presentation)
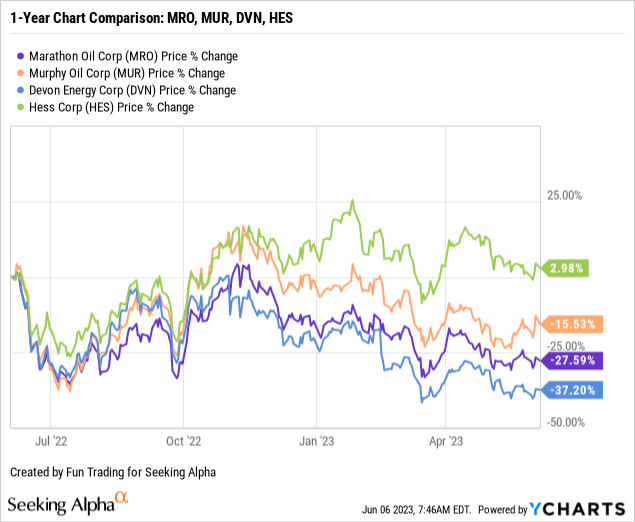
2 - Stock performance
A quick one-year comparison with a few E&P (primarily domestic) shows that MRO underperformed the industry and is down 28% on a one-year basis.
3 - Investment thesis
Marathon Oil is an attractive E&P company and a significant U.S. E&P producer. 86.1% of the total oil equivalent production in 1Q23 comes from the USA (with 51.6% oil) and provides solid support for the company's long-term outlook.
The stock price is highly correlated to oil and gas prices.
Unfortunately, natural gas prices collapsed in 1Q23, and the market has not factored this new component into the Marathon Oil Corporation stock price yet. Brent oil is down nearly 8%, and NG is down 60% in the past six months.
Thus, waiting for the next stock leg down is prudent before considering accumulating the stock for the long term.
MRO 6-month Brent and NG price (Fun Trading StockCharts)
I recommend trading LIFO for about 45-50% of your position to take advantage of those fluctuations while keeping a core long-term position. This dual strategy is what I am suggesting in my marketplace, "The Gold and Oil Corner."
CEO Lee Tillman said in the conference call:
we reported another very strong quarter, both financially and operationally that is fully consistent with the guidance we provided back in February and further built on our track record of delivery. We continue to execute against our differentiated cash flow driven return of capital framework, again exceeding our commitment to return at least 40% of our cash flow from operations to shareholders and industry-leading commitment.
Marathon Oil - Financial Table 1Q23 - The Raw Numbers
| Marathon Oil | 1Q22 | 2Q22 | 3Q22 | 4Q22 | 1Q23 |
| Revenues from contracts in $ million | 1,761 | 2,168 | 2,008 | 1,603 | 1,567 |
| Revenues and others in $ Million | 1,753 | 2,303 | 2,247 | 1,733 | 1,680 |
| Net Income in $ Million | 1,304 | 966 | 817 | 525 | 417 |
| EBITDA $ Million | 1,244 | 1,608 | 1,333 | 1,574 | 1,025 |
| EPS diluted in $/share | 1.78 | 1.37 | 1.22 | 0.82 | 0.66 |
| Operating cash flow in $ Million | 1,067 | 1,678 | 1,556 | 1,127 | 865 |
| CapEx in $ Million | 332 | 355 | 430 | 333 | 532 |
| Free cash flow in $ Million | 735 | 1,323 | 1,126 | 794 | 333 |
| Total cash $ million | 681 | 1,162 | 1,109 | 334 | 178 |
| Long-Term Debt in $ million | 4,014 | 3,982 | 3,981 | 5,923 | 5,854 |
| Dividend per share in $/share | 0.08 | 0.08 | 0.09 | 0.10 | 0.10 |
| Shares outstanding (diluted) in Million | 732 | 705 | 672 | 639 | 629 |
| Oil Production | 1Q22 | 2Q22 | 3Q22 | 4Q22 | 1Q23 |
| Oil Equivalent Production in K Boe/d | 341 | 343 | 352 | 333 | 396 |
| US Onshore Crude oil price ($/b) | 94.43 | 110.10 | 93.67 | 84.29 | 74.69 |
Sources: Marathon Oil release.
Part II - Analysis: Revenues, Earnings Details, Free Cash Flow, Debt, and Oil and Gas Production
1 - Total revenues were $1,680 million in 1Q23
MRO Quarterly Revenues History (Fun Trading)
The first quarter's revenues were $1,680 million, down 4.2% from the same quarter a year ago and down 3.1% sequentially.
Total costs in 1Q23 were $1,075 million, $327 million higher than the prior-year period. Marathon Oil reported a CFO of $865 million for the first quarter, down slightly from $1,067 million a year ago.
2 - Generic free cash flow was down to $333 million in 1Q23
MRO Quarterly Free Cash Flow History (Fun Trading)
Note: The generic free cash flow is cash from operating activities minus CapEx.
Trailing twelve-month free cash flow was $3,576 million, with a 1Q23 free cash flow of $333 million. It was down from expectations, and the company said in the conference call:
The entirety of the variance in our cash flow and free cash flow versus consensus can be explained by the fact that we reported $80 million of E.G. equity income, but did not receive any E.G. cash dividends.
This quarter, the quarterly dividend stays at $0.10 per share, which means a yearly cash expense of $256 million, easily covered by free cash flow.
3 - Production of oil equivalent was 396K Boep/d in 1Q23
MRO Quarterly Production History (Fun Trading)
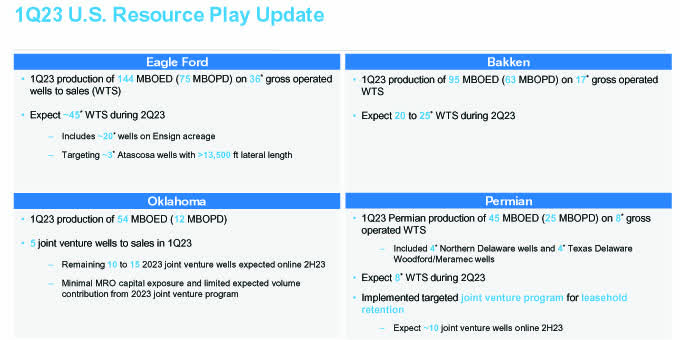
3.1 - U.S. segment
This U.S. upstream segment reported an income of $425 million, down significantly from $661 million in the year-ago period due to lower oil realizations and higher costs, partly counterbalanced by stronger production.
Total U.S. output (341K Boep/d) comprised approximately 52% oil or 176K Bop/d. Significantly higher year-over-year production from Eagle Ford was partly lowered by lower volumes from the Bakken area.
The Eagle Ford basin production was 144K Boep/d, up 80% from the first quarter of 2022, whereas the output from Bakken was 94K Boep/d compared with 118K Boep/d last year. Finally, Oklahoma's production came in at 54K Boep/d.
U.S. unit production costs were $5.82 per boe for the first quarter.
- Marathon Oil's average realized liquids prices (crude oil and condensate) of $74.69 per barrel were down from the year-earlier level of $94.43.
- Average realized natural gas prices were down 38.4% year-over-year to $2.95 per Mcf.
- Natural gas liquids average price realizations decreased by 35% to $24.27 a barrel.
MRO Production 4Q22 versus 1Q23 (Fun Trading) MRO 1Q23 Summary production per segment (MRO Presentation)
3.2 - Equatorial Guinea
Marathon Oil reported earnings of $89 million compared with $115 million in the year-ago period due to weaker output.
Production was 55K Boep/d in 1Q23, up from 64K Boep/d last year.
Marathon’s average realized liquids prices were $58.57 per barrel, down 1.8% from the year-earlier quarter. Natural gas and natural gas liquids’ average price realizations came in at $0.24 per thousand cubic feet and $1 a barrel, unchanged from a year ago.
On March 30, 2023, Marathon Oil signed an HOA with Chevron (CVX) and the Republic of Equatorial Guinea to progress the following phases (Phases II and III) in the development of the Equatorial Guinea Regional Gas Mega Hub (GMH).
3.3 - Oil and gas prices
Marathon Oil's average realized liquids prices (crude oil and condensate) of $74.69 per barrel were above the year-earlier $94.43.
Natural gas liquids' average price realization was $24.27 a barrel.
Also, the average realized natural gas prices were $2.95 per thousand cubic feet in 1Q23.
MRO Quarterly Price oil, NG Price History (Fun Trading)
4 - Net debt was $5.68 billion in 1Q23
MRO Quarterly Cash versus Debt History (Fun Trading)
As of March 31, 2022, MRO had cash and cash equivalents worth $178 million and long-term debt of 5.854 billion, including current.
Marathon Oil ended the first quarter with total liquidity of $2.4 billion. Available borrowings on the Company's revolving credit facility have been extended to 2027.
The debt-to-capitalization ratio of the company was 33.4.
5 - 2023 Guidance
Marathon Oil announced a $1.9 to $2.0 billion capital expenditure budget for 2023.
Marathon Oil expects to deliver maintenance-level total Company oil production of 190K net bop/d at the midpoint of its 2023 guidance range.
Total Company oil-equivalent production is expected to be 395K net boe/d at the guidance's midpoint, including downtime associated with a planned second-quarter Equatorial Guinea turnaround.
Furthermore, Marathon expects oil volumes in the band of 185K-195K barrels daily.
MRO 2023 Guidance (MRO Presentation)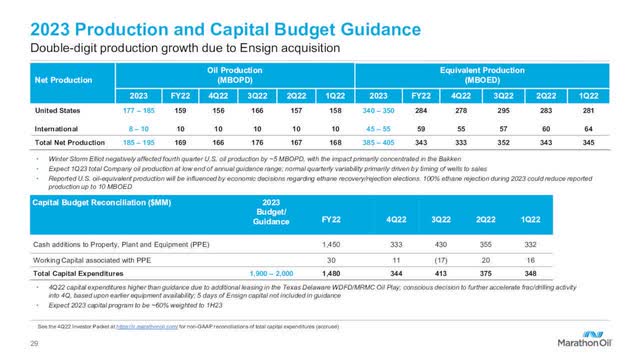
Technical Analysis (Short Term) and Commentary
MRO TA Chart Short-Term (Fun Trading StockCharts)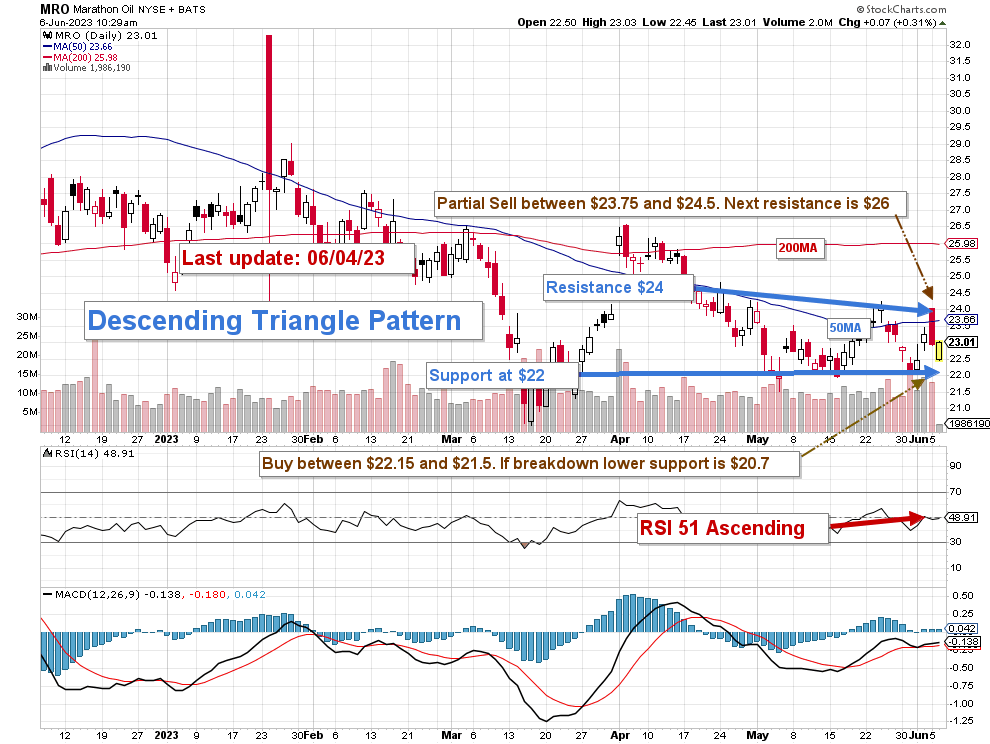
Note: The graph is adjusted for the dividend.
MRO stock prices form a descending triangle pattern with resistance at $24 and support at $22.
The descending triangle pattern is a popular bearish continuation pattern that is created by drawing a horizontal line that connects low points and a trend line that connects lower highs. Sometimes the pattern occurs in a reverse during an upward trend as well.
The trading strategy is to sell about 45-50% of your MRO position between $23.75 and $24.50, with possible higher resistance at $26 if oil prices turn bullish, which is not likely, in my opinion.
Conversely, I recommend buying MRO stock between $22.15 and $21.5, with potential lower support at $20.7.
Watch oil and gas prices like a hawk.
Warning: The TA chart must be updated frequently to be relevant. It is what I am doing in my stock tracker. The chart above has a possible validity of about a week. Remember, the TA chart is a tool only to help you adopt the right strategy. It is not a way to foresee the future. No one and nothing can.

Join my "Gold and Oil Corner" today, and discuss ideas and strategies freely in my private chat room. Click here to subscribe now.
You will have access to 57+ stocks at your fingertips with my exclusive Fun Trading's stock tracker. Do not be alone and enjoy an honest exchange with a veteran trader with more than thirty years of experience.
"It's not only moving that creates new starting points. Sometimes all it takes is a subtle shift in perspective," Kristin Armstrong.
Fun Trading has been writing since 2014, and you will have total access to his 1,988 articles and counting.
This article was written by

I am a former test & measurement doctor engineer (geodetic metrology). I was interested in quantum metrology for a while.
I live mostly in Sweden with my loving wife.
I have also managed an old and broad private family Portfolio successfully -- now officially retired but still active -- and trade personally a medium-size portfolio for over 40 years.
“Logic will get you from A to B. Imagination will take you everywhere.” Einstein.
Note: I am not a financial advisor. All articles are my honest opinion. It is your responsibility to conduct your own due diligence before investing or trading.
Analyst’s Disclosure: I/we have no stock, option or similar derivative position in any of the companies mentioned, and no plans to initiate any such positions within the next 72 hours. I wrote this article myself, and it expresses my own opinions. I am not receiving compensation for it (other than from Seeking Alpha). I have no business relationship with any company whose stock is mentioned in this article.
I trade short-term MRO occasionally.
Seeking Alpha's Disclosure: Past performance is no guarantee of future results. No recommendation or advice is being given as to whether any investment is suitable for a particular investor. Any views or opinions expressed above may not reflect those of Seeking Alpha as a whole. Seeking Alpha is not a licensed securities dealer, broker or US investment adviser or investment bank. Our analysts are third party authors that include both professional investors and individual investors who may not be licensed or certified by any institute or regulatory body.