KOLD: Natural Gas Could Test The 2020 Lows

Summary
- Natural gas prices have experienced significant volatility, with US NYMEX natural gas futures reaching a high of over $10 per MMBtu in August 2022 before falling 80.6% to a low of $1.946 per MMBtu in April 2023.
- Bullish factors supporting natural gas prices include ongoing tensions between Russia and the US/Europe, reduced production due to low prices, and potential increased demand during the summer cooling season.
- Bearish factors include a continued downward trend in natural gas futures markets, a glut of European natural gas, and potential economic weakness limiting demand for energy commodities.
- Looking for more investing ideas like this one? Get them exclusively at Hecht Commodity Report. Learn More »
posteriori
Trading natural gas is not for the faint of heart. Over the past years, the price action has gone from implosive to explosive back to implosive.
After falling to a quarter-of-a-century low at around $1.44 per MMBtu in June 2020, the price exploded higher, reaching a $10.028 per MMBtu high in August 2022. The war in Ukraine supported the rally as supply concerns pushed European prices to record highs. The twenty-five-year low led to a fourteen-year high. After trading at the highest price since 2008, nearby NYMEX natural gas futures ran out of upside steam, turned lower, and tanked. In April, the selling took the energy commodity to its most recent low, below $2 per MMBtu. At near the $2.30 level on June 6, July NYMEX natural gas futures are sitting near the low and consolidating around the $2 per MMBtu level.
The ProShares UltraShort Bloomberg Natural Gas ETF (NYSEARCA:KOLD) is a leveraged exchange-traded fund ("ETF") product that appreciates when NYMEX natural gas futures decline.
Natural gas prices have declined
Nearby U.S. NYMEX natural gas futures for delivery at the Henry Hub pipeline in Erath, Louisiana, reached a nearly decade-and-a-half high at just over $10 in August 2022.
Five-Year NYMEX Natural Gas Futures Chart (Barchart)
The chart highlights the significant and implosive selloff in the natural gas futures arena that made lower highs and lower lows throughout the winter peak demand season in late 2022 and early 2023. The futures fell 80.6% from the high, reaching a $1.946 per MMBtu low in April 2023, the beginning of the off-season for natural gas requirements. The continuous NYMEX futures have been trading near the $2 per MMBtu level over the past months and have not traded above $2.70 since early March.
U.S. natural gas prices exploded to highs last August as supply fears gripped Europe. Since U.S. LNG travels the world by ocean vessels to regions with much higher prices, the U.S. prices rose in sympathy with European prices that reached record peaks because of dependence on Russian natural gas supplies. The war in Ukraine caused explosive price moves, but a warm winter reducing natural gas demands limited the war and sanctions' impact on prices across the Atlantic.
European prices have declined more
U.S. natural gas prices tanked by 80.6% from the August 2022 high to the April 2023 low. European futures prices rose more than U.S. prices during the rally and fell more during the correction.
Chart of U.K. Natural Gas Futures (Barchart)
The nearby U.K. natural gas futures chart illustrates the plunge from 800 in March 2020 to the 59.43 level on June 6, 2023, a 92.6% decline.
Chart of Dutch Natural Gas Futures (Barchart)
Natural gas prices for delivery in the Netherlands fell 92.8%, dropping from the 345-record peak to 24.96 on June 6.
The bullish case
The following factors support U.S. and U.K. natural gas prices at the current price levels:
- The war in Ukraine continues to rage, and tensions between Russia and the U.S./Europe remain at the worst level in years. If European natural gas demand begins to rise and Russia punishes Western Europe with supply bans, the price could suddenly spike higher.
- The low level of U.S. and European prices will curtail production, as the cure for low commodity prices is always low prices.
- U.S. natural gas futures prices have been consolidating around the $2 per MMBtu level over the past weeks and could be building a base during the offseason.
- The U.S. energy policy that supports alternative and renewable fuels while inhibiting fossil fuels weighs on production. As of June 2, the number of natural gas rigs operating in the U.S. was fourteen lower than at the same time in 2022 at 137 rigs.
- The summer cooling season could increase the demand for natural gas if temperatures rise to higher levels than in past years.
- The 2023/2024 peak season begins in the late fall, and rising seasonal demand tends to push prices higher as the winter approaches.
Historical risk-reward factors favor the upside at the $2 per level in the U.S. and current prices in the U.K. and the Netherlands.
The bearish case
The bearish factors weighing on natural gas prices include:
- The trend is all markets are always your best friend, and it remains bearish in the U.S. and European natural gas futures markets.
- U.K. and Dutch natural gas futures have moved from record highs to pre-Ukraine war prices. While supply fears over Russian exports may continue to lurk in the background, the current supply-demand fundamentals indicate a glut of European natural gas.
- As the Fed has tightened credit at an unprecedented pace to battle inflation, a recession or economic weakness could limit the demand for all energy commodities, and natural gas is no exception.
- U.S. natural gas inventories are considerably above last year's level and the five-year average.
U.S. Natural Gas Inventories in Storage as of May 26, 2023 (EIA)
The chart shows at 2.446 trillion cubic feet for the week ending on May 26, natural gas in storage across the United States was 29.5% higher than in late May 2022 and 16.6% above the five-year average. The 2022/2023 peak demand season ended in the spring with 1.83 trillion cubic feet in storage, the highest level since 2020 when the price fell to a twenty-five-year low under $1.50 per MMBtu.
KOLD is the leveraged bearish natural gas ETF product
While the U.S. natural gas futures price continues to consolidate around $2 per MMBtu, selling rallies have been the optimal approach to the futures over the past year. At $2.30 per MMBtu on June 6, natural gas would have to move above the $2.685 level to break the bearish pattern and over $3.027, the late February high, to move into a bullish trend.
The most direct route for risk positions in U.S. natural gas is the CME's NYMEX division, leveraged and highly volatile futures and futures options contracts. A bearish product that offers leverage is available for stock market accounts and has been a star performer over the past year is the ProShares UltraShort Bloomberg Natural Gas ETF. KOLD's fund profile states:
KOLD Fund Profile (Seeking Alpha)
The most recent top holdings include:
Top Holdings of the KOLD ETF Product (Seeking Alpha)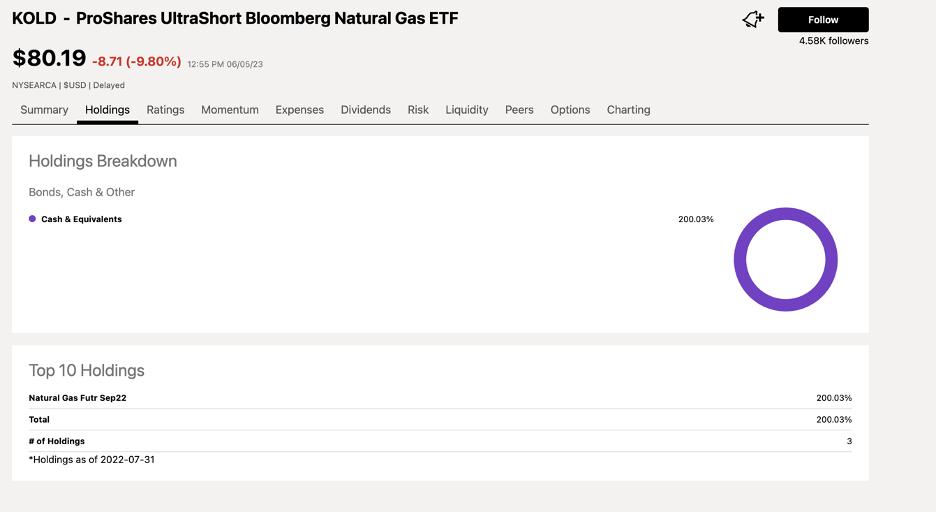
The chart shows that KOLD holds a 200% short position in September 2022 NYMEX natural gas futures contracts. At around the $80 per share level on June 6, KOLD had over $93.4 million in assets under management. The average daily volume is around two million shares, and the management fee is at the 1% level.
Natural gas futures fell 80.6% from the August 2022 high to the April 2023 low.
Chart of the Bearish KOLD ETF Product (Barchart)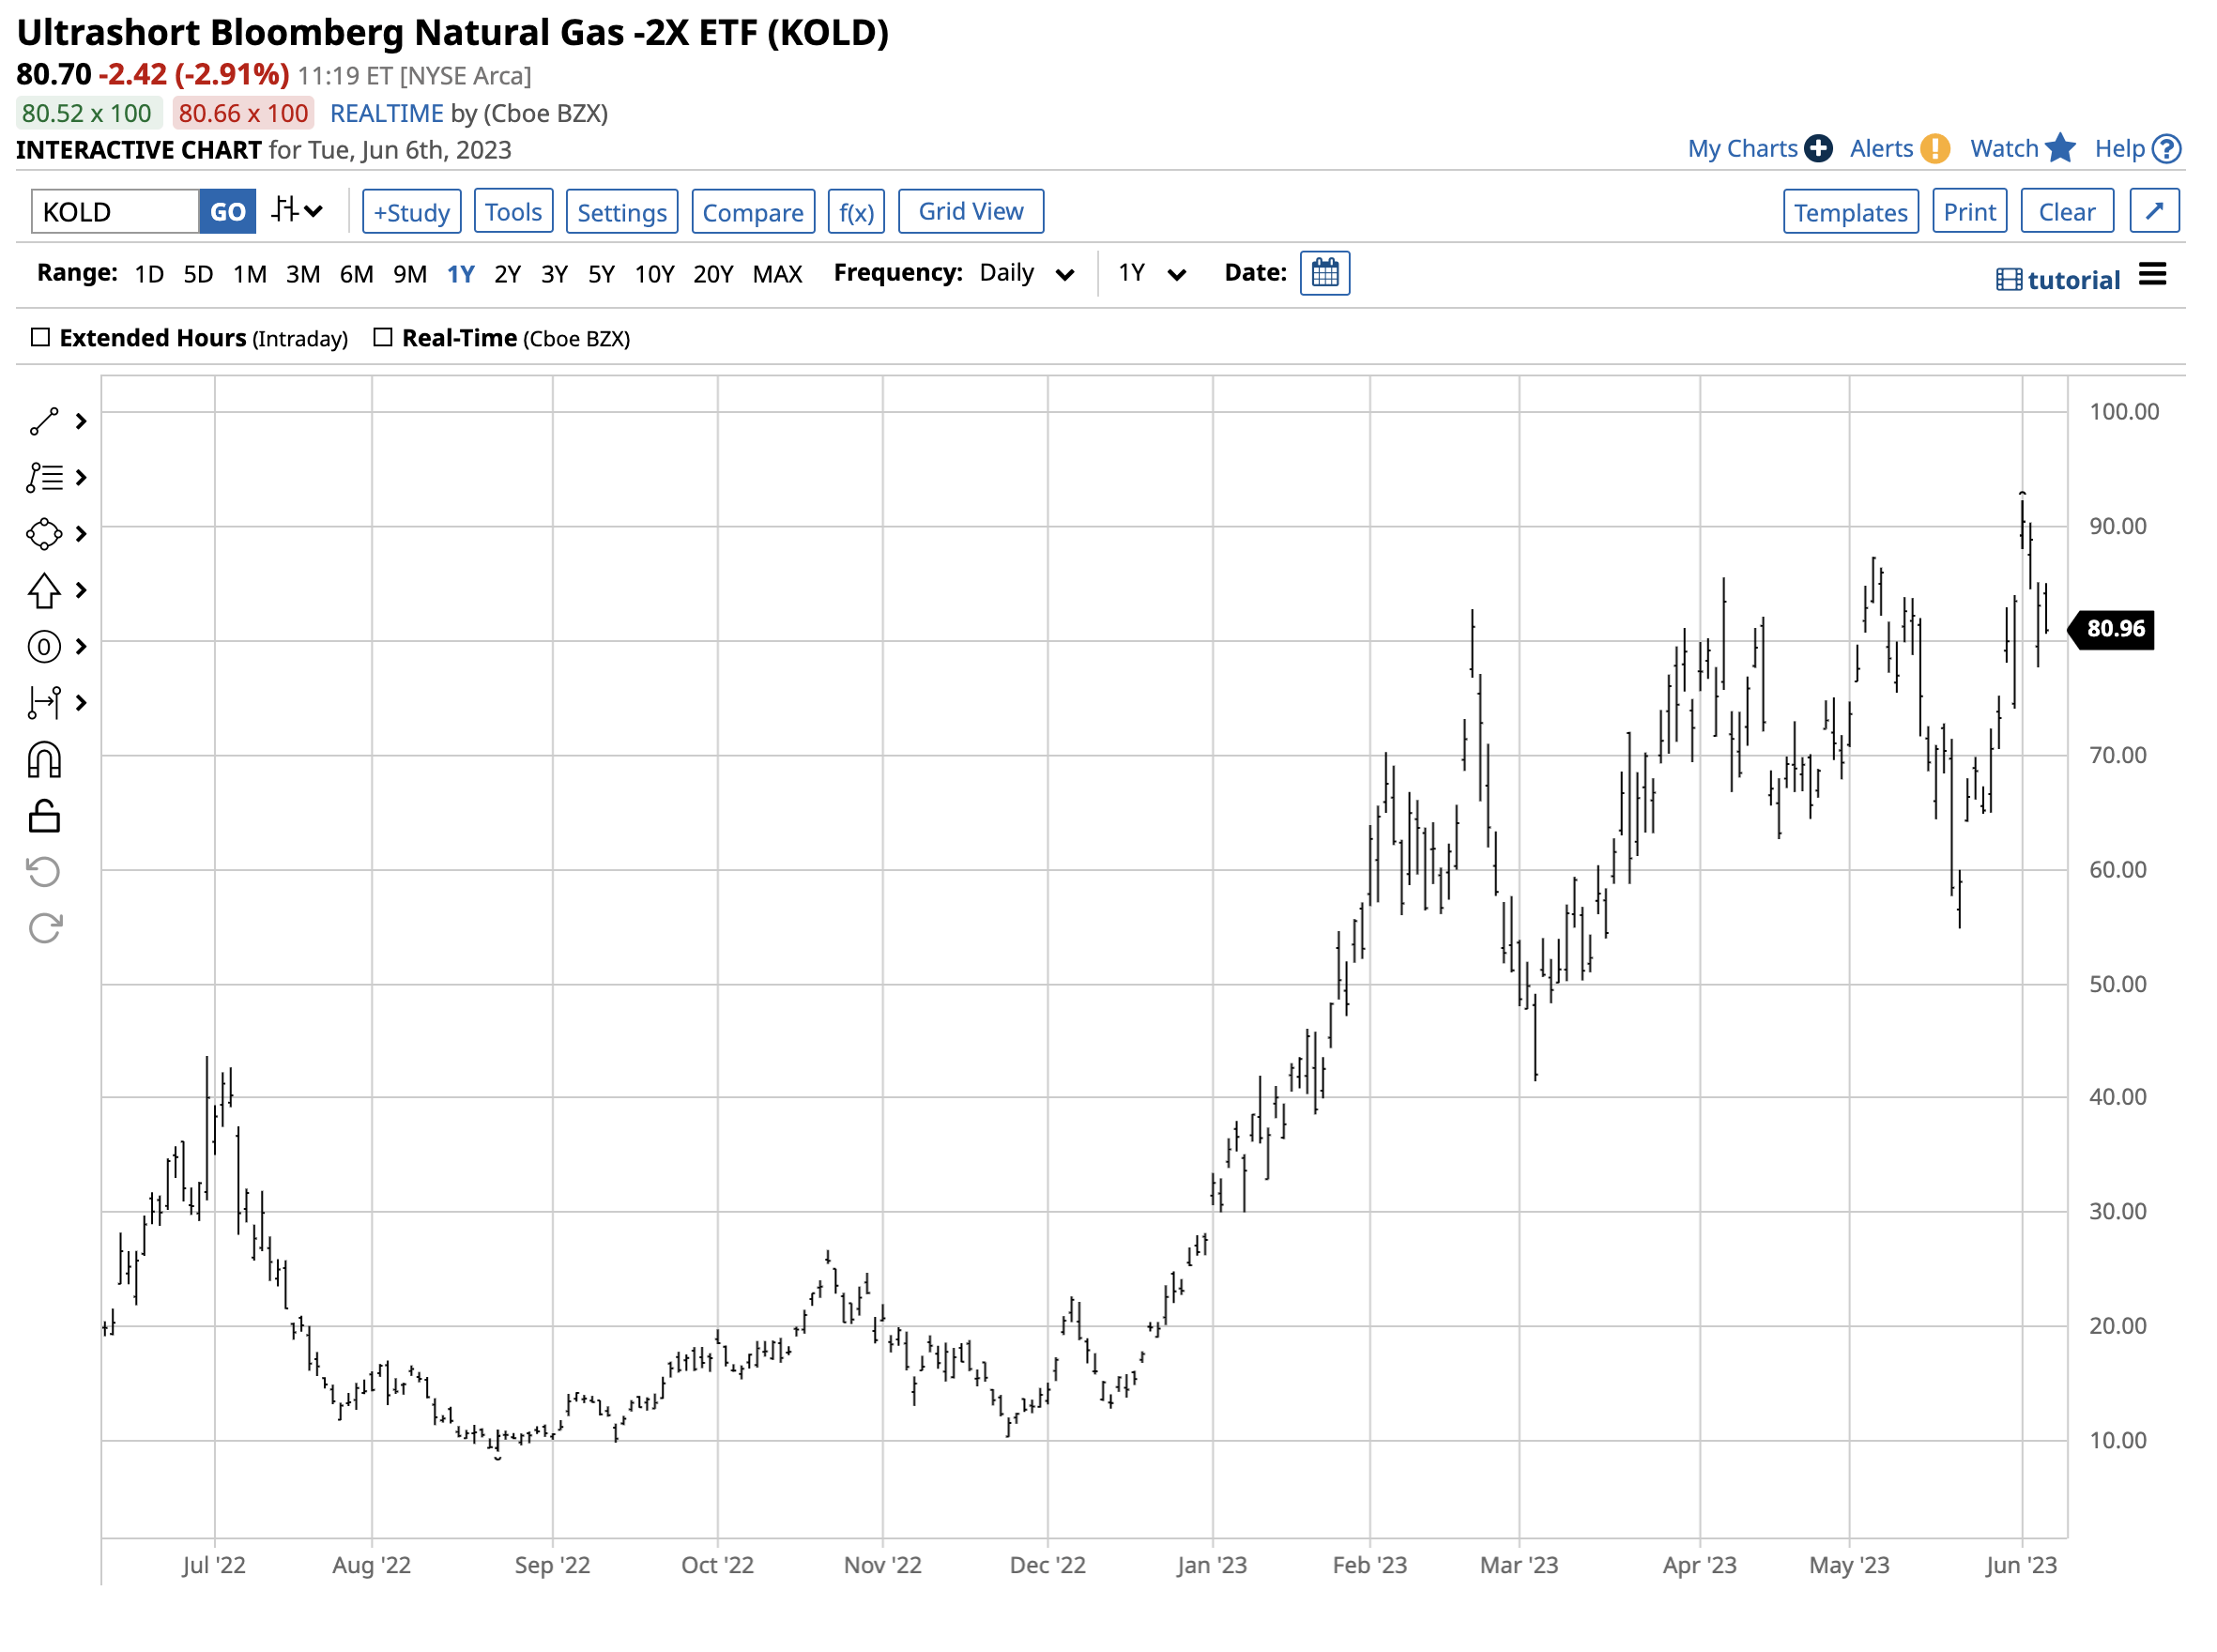
The chart shows the rise from $9.06 to $92.35 per share, or over 919% over the past year. Leveraged returns come at a price, as time decay or price action contrary to expectations can cause KOLD and other turbocharged products to lose value quickly. The ETF's high cost could mean a share split is on the horizon. A daring approach for natural gas bulls could be to short KOLD, but a short approach requires tight risk-reward dynamics and discipline.
Meanwhile, for natural gas bears, the potential for a challenge of the 2020 $1.44 low could be in the cards, and KOLD will likely continue to post gains as the energy commodity's price declines.
The Hecht Commodity Report is one of the most comprehensive commodities reports available today from a top-ranked author in commodities, forex, and precious metals. My weekly report covers the market movements of over 29 different commodities and provides bullish, bearish, and neutral calls, directional trading recommendations, and actionable ideas for traders. I am offering a free trial and discount to new subscribers for a limited time.
This article was written by

Andy spent nearly 35 years on Wall Street, including two decades on the trading desk of Phillip Brothers, which became Salomon Brothers and ultimately part of Citigroup.
Over the past two decades, he has researched, structured and executed some of the largest trades ever made, involving massive quantities of precious metals and bulk commodities.Andy understands the market in a way many traders can’t imagine. He’s booked vessels, armored cars, and trains to transport and store a broad range of commodities. And he’s worked directly with The United Nations and the legendary trading group Phibro.
Today, Andy remains in close contact with sources around the world and his network of traders.
“I have a vast Rolodex of information in my head… so many bull and bear markets. When something happens, I don’t have to think. I just react. History does tend to repeat itself over and over.”
His friends and mentors include highly regarded energy and precious metals traders, supply line specialists and international shipping companies that give him vast insight into the market.
Andy’s writing and analysis are on many market-based websites including CQG. Andy lectures at colleges and Universities. He also contributes to Traders Magazine. He consults for companies involved in producing and consuming commodities. Andy’s first book How to Make Money with Commodities, published by McGraw-Hill was released in 2013 and has received excellent reviews. Andy held a Series 3 and Series 30 license from the National Futures Association and a collaborator and strategist with hedge funds. Andy is the commodity expert for the website about.com and blogs on his own site dynamiccommodities.com. He is a frequent contributor on Stock News- https://stocknews.com/authors/?author=andrew-hecht
Analyst’s Disclosure: I/we have no stock, option or similar derivative position in any of the companies mentioned, and no plans to initiate any such positions within the next 72 hours. I wrote this article myself, and it expresses my own opinions. I am not receiving compensation for it (other than from Seeking Alpha). I have no business relationship with any company whose stock is mentioned in this article.
The author always has positions in commodities markets in futures, options, ETF/ETN products, and commodity equities. These long and short positions tend to change on an intraday basis.
Seeking Alpha's Disclosure: Past performance is no guarantee of future results. No recommendation or advice is being given as to whether any investment is suitable for a particular investor. Any views or opinions expressed above may not reflect those of Seeking Alpha as a whole. Seeking Alpha is not a licensed securities dealer, broker or US investment adviser or investment bank. Our analysts are third party authors that include both professional investors and individual investors who may not be licensed or certified by any institute or regulatory body.