REGL: Excellent Dividend Growth, Average Value And Return

Summary
- ProShares S&P MidCap 400 Dividend Aristocrats ETF holds 50 mid-cap stocks with dividends increasing for at least 15 years.
- It is well-diversified across holdings and top sectors.
- The dividend growth rate is excellent.
- However, valuation, quality, and past performance are average.
- Quantitative Risk & Value members get exclusive access to our real-world portfolio. See all our investments here »
RomoloTavani
This article series aims at evaluating ETFs (exchange-traded funds) regarding the relative past performance of their strategies and metrics of their current portfolios. Reviews with updated data are posted when necessary.
REGL strategy and portfolio
ProShares S&P MidCap 400 Dividend Aristocrats ETF (BATS:REGL) started investing operations on 2/03/2015 and tracks the S&P MidCap 400 Dividend Aristocrats Index. It has 50 holdings, a 12-month distribution yield of 2.40% and a total expense ratio of 0.40%. Distributions are paid quarterly.
As described by ProShares in the prospectus, eligible companies must be in the S&P Midcap 400 index and have increased dividend payments every year for at least 15 years. The index contains a minimum of 40 stocks, equally weighted with a limit of 30% for any sector. If fewer than 40 stocks pass the rules, companies with shorter dividend growth histories may be included. The index is reconstituted once a year and rebalanced quarterly.
The fund invest exclusively in U.S. based companies, 42% in mid-caps and 58% in small caps (per Fidelity classification). The heaviest sector is financials (23.9% of asset value), followed by utilities (22.1%) , industrials (21.1%) and materials (14.8%). Other sectors are below 7% individually and about 18% in aggregate. Compared to the parent index and mid-cap benchmark S&P 400 (MDY, IJH, IVOO, SPMD), REGL massively overweights financials, utilities and materials. It underweights consumer discretionary, healthcare, real estate, and ignores energy and technology.
Sector breakdown ( chart: author; data: ProShares)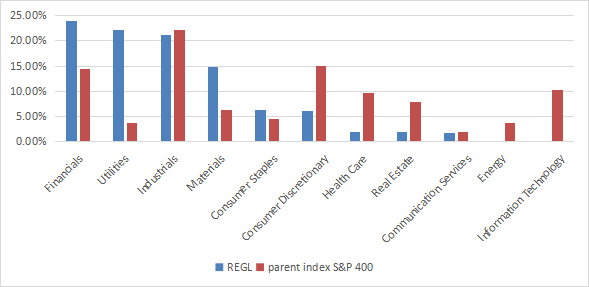
Positions are equal-weighted at every rebalancing, but they may drift with price action. The current top 10 holdings, listed below, represent 24.6% of assets. These are the constituents with the best momentum since the last rebalancing. The largest position weighs 2.58%, so risks related to individual companies are low.
Ticker | Name | Weight | EPS growth %TTM | P/E TTM | P/E fwd | Yield% |
Hubbell, Inc. | 2.58% | 10.40 | 29.10 | 21.44 | 1.52 | |
Lincoln Electric Holdings, Inc. | 2.30% | 45.41 | 22.73 | 20.22 | 1.41 | |
Graco, Inc. | 2.27% | 14.11 | 28.09 | 25.96 | 1.18 | |
MSA Safety, Inc. | 2.21% | -138.23 | N/A | 23.74 | 1.32 | |
UMB Financial Corp. | 2.21% | 14.34 | 7.41 | 8.23 | 2.39 | |
Bank OZK | 2.20% | 13.35 | 7.80 | 6.81 | 3.64 | |
Regal Rexnord Corp. | 2.19% | -1.21 | 26.17 | 13.09 | 1.00 | |
Polaris Inc. | 2.15% | 54.79 | 10.85 | 11.47 | 2.24 | |
Southwest Gas Holdings, Inc. | 2.11% | -227.69 | N/A | 18.41 | 4.14 | |
Carlisle Cos., Inc. | 2.09% | 53.71 | 14.25 | 12.51 | 1.33 |
Performance
Since inception in February 2015, REGL has outperformed the mid-cap benchmark in return and risk-adjusted performance (Sharpe ratio in the next table).
Total Return | Annual Return | Drawdown | Sharpe ratio | Volatility | |
REGL | 108.18% | 9.22% | -33.36% | 0.55 | 15.25% |
S&P 400 MidCap | 92.27% | 8.18% | -42.18% | 0.42 | 18.68% |
The next chart compares the 5-year total returns of REGL and four popular dividend-growth ETFs, more oriented to large cap stocks:
- Vanguard Dividend Appreciation Index Fund (VIG)
- ProShares S&P 500 Dividend Aristocrats ETF (NOBL)
- iShares Core Dividend Growth ETF (DGRO)
- WisdomTree U.S. Quality Dividend Growth Fund (DGRW)
REGL has lagged all of them.
REGL vs competitors 5-year return (Seeking Alpha)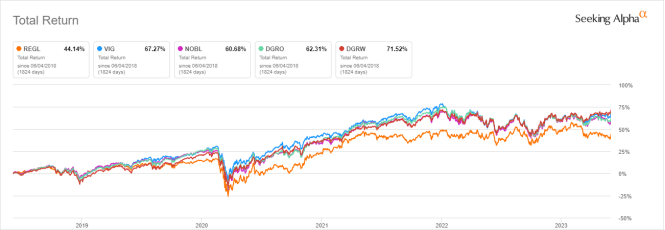
It is also the worst performer in the last 12 months:
REGL vs competitors, last 12 months (Seeking Alpha)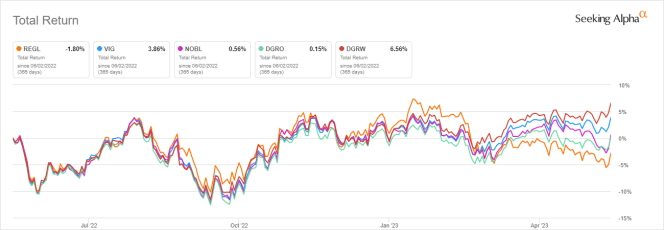
The sum of annual distributions has increased from $0.65 to $1.66 per share between 2015 and 2022. It is a growth of 155%, whereas the cumulative inflation has been about 25% in the same time. The annualized dividend growth rate on this period is 14.3%, which is excellent. For instance, VIG shows an annualized dividend growth rate of 7.3% in the same time.
REGL distribution history (Seeking Alpha)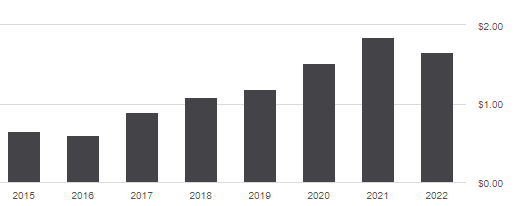
Comparing REGL with a reference strategy based on dividend and quality
In previous articles, I have shown how three factors may help cut the risk in a dividend portfolio: Return on Assets, Piotroski F-score, and Altman Z-score.
The next table compares REGL since inception with a subset of the S&P 500: stocks with a dividend yield above the average of their respective indexes, an above-average ROA, a good Altman Z-score, a good Piotroski F-score and a sustainable payout ratio. It is rebalanced annually to make it comparable with a passive index.
Total Return | Annual Return | Drawdown | Sharpe ratio | Volatility | |
REGL | 108.18% | 9.22% | -33.36% | 0.55 | 15.25% |
Dividend quality subset | 112.43% | 9.48% | -36.33% | 0.53 | 16.28% |
Past performance is not a guarantee of future returns. Data Source: Portfolio123
REGL is close to my dividend quality benchmark, which is a good point for the fund. My core portfolio holds 14 stocks selected in this subset (more info at the end of this post).
Valuation and quality
REGL is slightly more expensive than its parent index regarding valuation ratios:
REGL | MDY | |
Price/Earnings TTM | 15.97 | 13.7 |
Price/Book | 2.21 | 2.14 |
Price/Sales | 1.57 | 1.14 |
Price/Cash Flow | 12.72 | 9.96 |
Data: Fidelity
Among the 50 stocks held by the fund, 7 are risky regarding my metrics. In my portfolio reviews, risky stocks are companies with at least two red flags among: bad Piotroski score, negative ROA, unsustainable payout ratio, bad or dubious Altman Z-score, excluding financials and real estate where these metrics are unreliable. Here, risky stocks weigh 13.7% of asset value, which is acceptable, but not really good.
According to my calculation of aggregate metrics reported in the next table, quality is close to the benchmark.
REGL | MDY | |
Atman Z-score | 2.94 | 3.05 |
Piotroski F-score | 5.69 | 5.65 |
ROA % TTM | 6.15 | 5.48 |
Takeaway
ProShares S&P MidCap 400 Dividend Aristocrats ETF implements a dividend-growth strategy with an equal-weight methodology. It holds stocks of the S&P Midcap 400 index with dividends increasing every year for at least 15 years. It used to be overweight in financials, but now the top 3 sectors are quite balanced: financials, industrials and utilities are between 21% and 24% of asset value. The fund is more expensive than its parent index S&P Midcap 400 regarding valuation ratios, and close to it in quality. It has outperformed the mid-cap benchmark since inception, and shows a lower risk measured in maximum drawdown and historical volatility. Furthermore, its annualized dividend growth rate is excellent. However, it has lagged dividend growth ETFs including large cap companies. In summary, REGL is a good dividend growth fund for investors seeking diversification outside the large cap universe. It has two downsides: historical return and trading volumes are weak relative to VIG, NOBL, DGRO and DGRW.
Editor's Note: This article discusses one or more securities that do not trade on a major U.S. exchange. Please be aware of the risks associated with these stocks.
Quantitative Risk & Value (QRV) features data-driven strategies in stocks and closed-end funds outperforming their benchmarks since inception. Get started with a two-week free trial now.

This article was written by

Step up your investing experience: try Quantitative Risk & Value for free now (limited offer).
I am an individual investor and an IT professional, not a finance professional. My writings are data analysis and opinions, not investment advice. They may contain inaccurate information, despite all the effort I put in them. Readers are responsible for all consequences of using information included in my work, and are encouraged to do their own research from various sources.
Analyst’s Disclosure: I/we have no stock, option or similar derivative position in any of the companies mentioned, and no plans to initiate any such positions within the next 72 hours. I wrote this article myself, and it expresses my own opinions. I am not receiving compensation for it (other than from Seeking Alpha). I have no business relationship with any company whose stock is mentioned in this article.
Seeking Alpha's Disclosure: Past performance is no guarantee of future results. No recommendation or advice is being given as to whether any investment is suitable for a particular investor. Any views or opinions expressed above may not reflect those of Seeking Alpha as a whole. Seeking Alpha is not a licensed securities dealer, broker or US investment adviser or investment bank. Our analysts are third party authors that include both professional investors and individual investors who may not be licensed or certified by any institute or regulatory body.