Safety Insurance Group: A Healthier Mercury Group?

Summary
- Safety Insurance Group outperforms Mercury General in terms of underwriting performance and market performance.
- Safety Insurance has maintained a stable dividend and has a healthier financial position compared to Mercury General.
- Despite its better performance, Safety Insurance is fairly-valued and may not be the best investment choice compared to other insurance companies like Allstate, Chubb, or Progressive.
- Looking for more investing ideas like this one? Get them exclusively at Cash Flow Club. Learn More »

Wipada Wipawin
Executive Summary
I recently wrote an article about Mercury General (MCY), a listed insurance company that was obliged to cut its dividend in 2022 to maintain its financial solvency, losing its dividend aristocrat status. One of my readers asked me if Safety Insurance Group (NASDAQ:SAFT) was better than Mercury Group.
Following this question, I started to analyze Safety Insurance Group deeper to overview this listed insurer better. Surprisingly, I have seen similarities between both companies. Nonetheless, Safety Insurance seems to be a healthier insurance group than Mercury.
Similarities between Mercury Group and Safety Insurance Group
The first thing that puzzled me was the similar business position between insurance groups.
Mercury Group is a leader in the California insurance market, providing motor and home insurance coverages. The company increased its footprint in other states over the last few years. The company offers insurance products in several states, including California, Arizona, Florida, Georgia, Illinois, Nevada, New Jersey, New York, Oklahoma, Texas, and Virginia. However, the weight of premiums from these states is still in the minority, as circa 15% of the total written policies are outside California.
Safety Insurance Group, Inc. primarily provides private passenger automobile insurance. Its primary focus is on offering insurance coverage for personal vehicles, including cars, trucks, and motorcycles.
The company underwrites and issues insurance policies through its subsidiaries, such as Safety Insurance Company, Safety Indemnity Insurance Company, and Safety Property and Casualty Insurance Company. These subsidiaries handle the day-to-day operations of the insurance business, including policy issuance, premium collection, claims processing, and customer service.
In addition to private passenger automobile insurance, Safety Insurance Group may offer other insurance products, such as homeowners insurance, dwelling fire insurance, and commercial automobile insurance. However, the bulk of its business and expertise lies in the personal auto insurance market.
Safety Insurance Group primarily operates in the state of Massachusetts, where it is headquartered. It serves individuals and businesses in Massachusetts and neighboring states like New Hampshire and Maine.
Safety Insurance Group is the fifth largest private passenger automobile carrier and the second largest commercial automobile carrier in Massachusetts, capturing an approximate 7.7% and 12.6% share, respectively, of the Massachusetts private passenger and commercial automobile markets in 2022, according to statistics compiled by Commonwealth Automobile Reinsurers ("CAR"). Furthermore, the insurer is Massachusetts's third largest homeowners insurance carrier, with a 6.5% market share (based on 2021 statistics). Similarly, Safety Insurance Group began writing insurance in New Hampshire in 2008 and Maine in 2016.
Nonetheless, premiums written in New Hampshire and Maine represented less than 5% of the total written premiums.
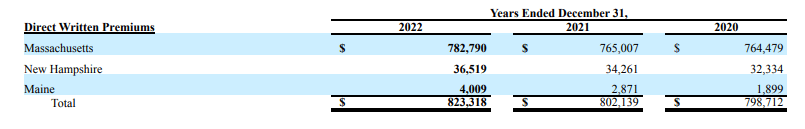
2022 Annual Report - Safety Insurance Group
Both companies are the market leader in their local market and have decided to diversify their activities by expanding their footprint in other states. At first glance, Mercury General and Safety Insurance could be seen as "siblings" with the same pattern in terms of business development. However, Safety Insurance's underwriting expertise has outperformed Mercury's.
A Weak Performer vs. A Reliable Insurer
The combined ratio is the most common metric to compare property and casualty insurers' underwriting performance.
The combined ratio is a key financial metric used in the insurance industry to assess the profitability of an insurance company's underwriting operations. It is expressed as a percentage and calculated by adding the company's loss and expense ratios.
The loss ratio represents the percentage of insurance claims and loss adjustment expenses incurred by the company compared to the premiums earned. It is calculated by dividing the total incurred losses and loss adjustment expenses by the total earned premiums.
The expense ratio represents the percentage of underwriting expenses, such as commissions, operating, and administrative expenses, compared to the premiums earned. It is calculated by dividing the total underwriting expenses by the total earned premiums.
The combined ratio is calculated by adding the loss ratio and expense ratio. A combined ratio below 100% indicates that the insurance company's underwriting operations are profitable, as the premiums earned are sufficient to cover the incurred losses and expenses. Conversely, a combined ratio above 100% indicates an underwriting loss, as the company is paying out more in claims and expenses than it is earning in premiums.
Insurance companies strive to maintain a combined ratio below 100% to achieve profitability in their underwriting operations. However, it's worth noting that investment income and other non-underwriting factors can also contribute to an insurance company's overall profitability.
Mercury General has struggled to deliver a combined ratio below 100% over the last ten years.
2020 was a breath of fresh air for the group due to COVID-19. The government restrictions reduced claims experience and thus improved the profitability of Mercury's portfolio.
However, this improvement in portfolio profitability was a sham. With the decrease in restrictions, the loss ratio went up sharply, also impacted by an increase in inflation.
Unlike Mercury General, Safety Insurance has been used to deliver reliable underwriting performance. For the last ten years, the average combined ratio was 96.6%, peaking in 2015 with a combined ratio of 112%. Compared to bigger peers, like GEICO (BRK.A)(BRK.B), Progressive Corporation (PGR), or Allstate (ALL), Safety Insurance performs well.
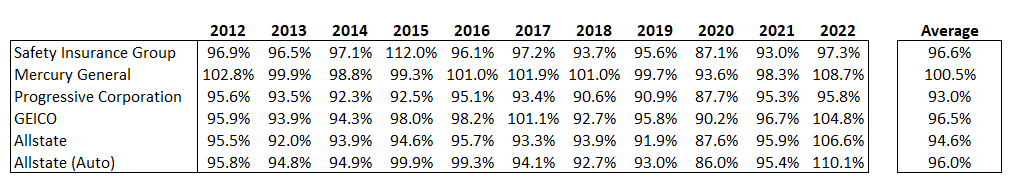
Annual Reports from the different listed companies (gathered by the Author)
Like other non-life insurers, Safety Insurance has suffered from claims inflation. For the year's first quarter, the company recorded a combined ratio of 118.5%, resulting in an underwriting loss of circa $35.5mn vs. an underwriting income of $2.4mn in 03M2022. The combined ratio deterioration was driven by the increased cost of catastrophe reinsurance and continuing inflationary pressure on private passenger auto severity. Mercury General's underwriting performance was slightly better, with a combined ratio of 115.8% in Q1 2023.
Although Safety Insurance recorded loss-making results for the first quarter of the year, the insurance company seems better equipped than Mercury to deliver recurring underwriting gains over the cycle.
A Prudent Company In Terms Of Capital Excess Distribution
Mercury used to be a dividend aristocrat stock. Nonetheless, the California-based insurer was obliged to cut its dividend in 2022 to maintain its financial solvency, losing its dividend aristocrat status. The situation was untenable due to an anemic operational performance. Despite a favorable business position in California, Mercury could not deliver sustainable and recurring operating performance.
For Safety Insurance, the situation is slightly different. The insurer company keeps its dividend the same every year. The $0.90 per share quarterly dividend has remained stable since the second quarter of 2019.
Although the dividend has remained unchanged since the middle of 2019, the earnings cover the dividend. In 2020, 2021, and 2022, the payout was 71.3%, 50.4%, and 41.7%, respectively. An adverse effect from the unrealized equity gains largely drove the increase in the payout in 2022, causing a pre-tax impact of $44.4mn.
Final Thoughts
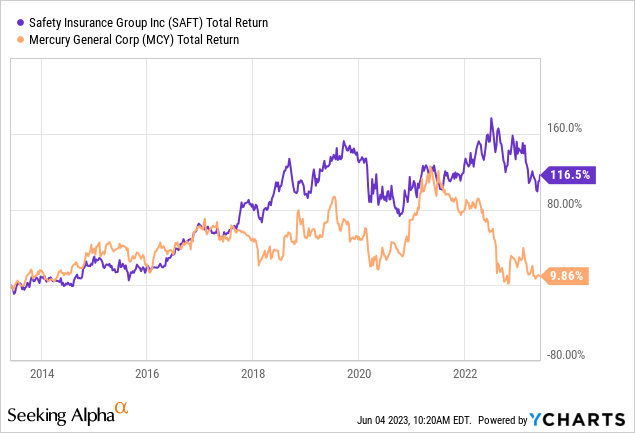
Figures prove that Safety Insurance outperforms Mercury in terms of underwriting performance. Regarding market performance, Safety Insurance has also beaten Mercury, with a 116.5% total return vs. a 9.9% total return for Mercury.
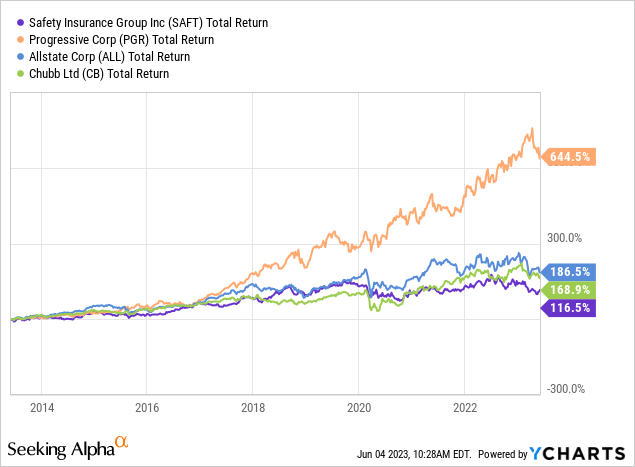
However, investing in Allstate, Chubb (CB), or Progressive would have been a better investment, as the total return of the three stocks was better than Safety Insurance's.
With a current price-to-book of 1.38, Safety Insurance is fairly-valued, despite poor first-quarter results. At the current price, I would not be interested in investing in Safety Insurance Group. Nonetheless, if I had to choose between Mercury and Safety, my choice would be easy: I would invest in Safety.
Is This an Income Stream Which Induces Fear?
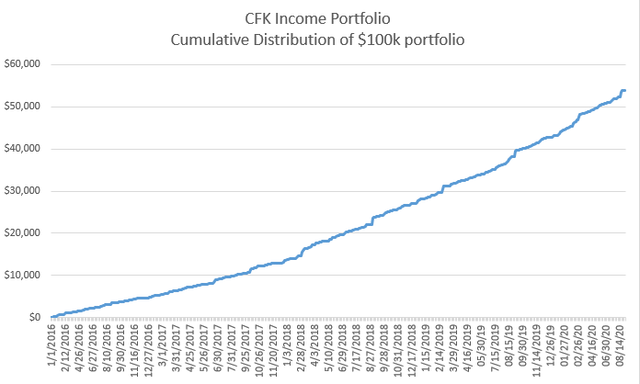
The primary goal of the Cash Flow Kingdom Income Portfolio is to produce an overall yield in the 7% - 10% range. We accomplish this by combining several different income streams to form an attractive, steady portfolio payout. The portfolio's price can fluctuate, the income stream not so much. Start your free two-week trial today!
This article was written by

I am a mid-30-ish-old man working as an actuary for an insurance company. Hence, I started to analyze insurance and reinsurance companies, primarily in non-life insurance markets. I invest in the USA, Canada, Scandinavia, France, and the UK.
Certainly, one of the rarest Frenchies in Seeking Alpha.
I am currently contributing articles to Darren McCammon's service Cash Flow Club, the investment community where your "Cash Flow is King"
Analyst’s Disclosure: I/we have no stock, option or similar derivative position in any of the companies mentioned, and no plans to initiate any such positions within the next 72 hours. I wrote this article myself, and it expresses my own opinions. I am not receiving compensation for it (other than from Seeking Alpha). I have no business relationship with any company whose stock is mentioned in this article.
Seeking Alpha's Disclosure: Past performance is no guarantee of future results. No recommendation or advice is being given as to whether any investment is suitable for a particular investor. Any views or opinions expressed above may not reflect those of Seeking Alpha as a whole. Seeking Alpha is not a licensed securities dealer, broker or US investment adviser or investment bank. Our analysts are third party authors that include both professional investors and individual investors who may not be licensed or certified by any institute or regulatory body.