IJR: Small Cap Recovery Has Begun

Summary
- Small-cap US stocks, particularly the iShares Core S&P Small-Cap ETF, are poised for significant gains and outperformance against large-cap stocks.
- The IJR's undervaluation is supported by its price-to-sales ratio, P/E ratio, and dividend yield compared to the S&P 500.
- Despite risks from small-cap bank stocks, the IJR offers investors cheap exposure to the US market with the potential for 10% annual outperformance over the next decade.
syahrir maulana
Friday's strong and broad-based rally in US stocks, combined with the move lower in the VIX and credit spreads suggests further gains are likely in the near term. Small cap stocks in particular look poised to outperform, supported by a recovery in regional banks, and I remain long the iShares Core S&P Small-Cap ETF (NYSEARCA:IJR). I put out a buy recommendation on the ETF in early April (see 'IJR: Small Caps Offer Excellent Relative Value') arguing that the relative value case was compelling, and a sustainable bottom was not far off. Friday's rally suggests the recovery has now begun, and the market's relative undervaluation suggests major outperformance versus US large caps.
The IJR ETF
The IJR tracks a market-cap-weighted index of primarily small-cap US stocks. The S&P Committee selects 600 stocks representing about 3% of the publicly available market. The ETF has a significantly lower exposure to technology stocks and higher exposure to financial stocks when compared with large cap stock indices, which largely explains its recent underperformance. The IJR is often compared with the Russell 2000 ETF (IWM), which until recently was larger in terms of assets under management. However, the IJR has outperformed the Russell 2000 index over time, reflecting the stricter criteria regarding the profitability of firms included in the index. This also explains why the trailing PE on the Russell 2000 is double that of the S&P 600. The IJR also has a lower expense ratio of 0.06% versus the IWM's 0.19%. The dividend yields are similar at around 1.5%, although we should see the yield on the IJR move higher as the underlying index trades at a dividend yield of 2.0%.
IJR ETF And IJR/SPX Ratio (Bloomberg)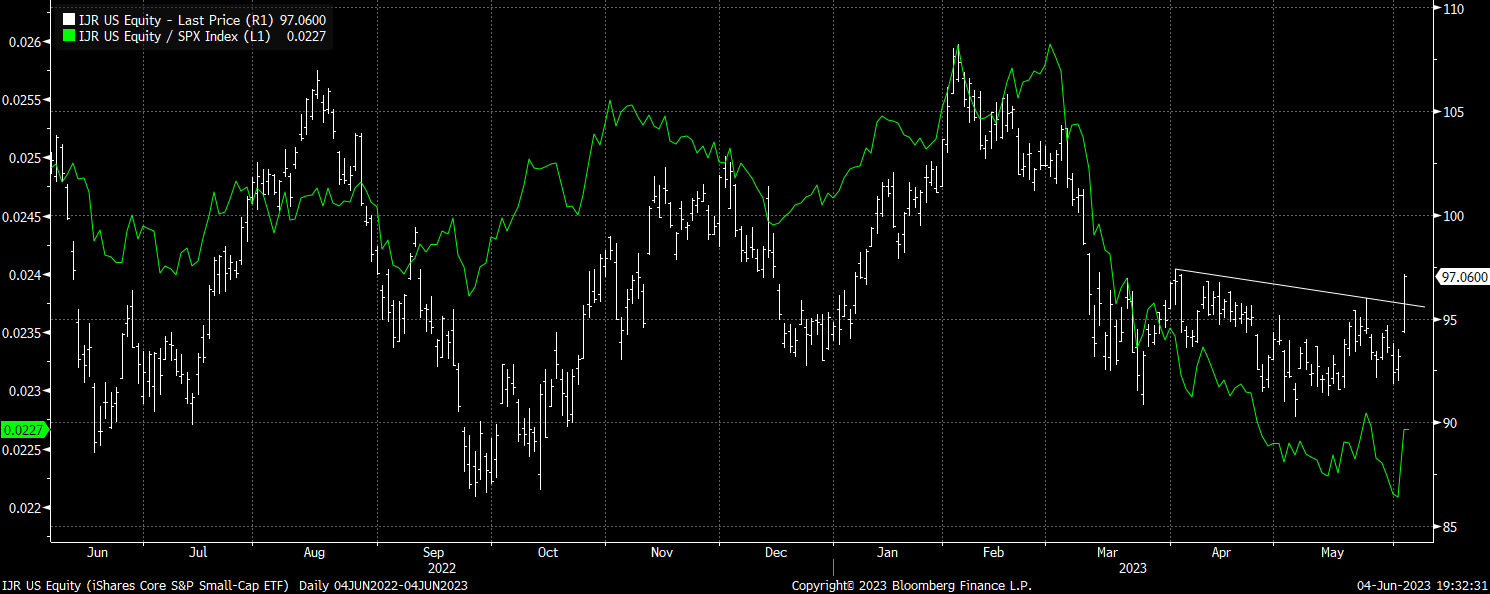
There are two things worth noting about the recent price action in the IJR. The first is the break above short-term resistance from the April high, which has established a new local high. The second is the outperformance seen relative to large cap stocks. After a brutal period of underperformance rivaling that seen in the Covid crash, the IJR finally clawed back some relative gains with the help of a recovery in the financial sector.
iShares Regional Banks ETF (Bloomberg)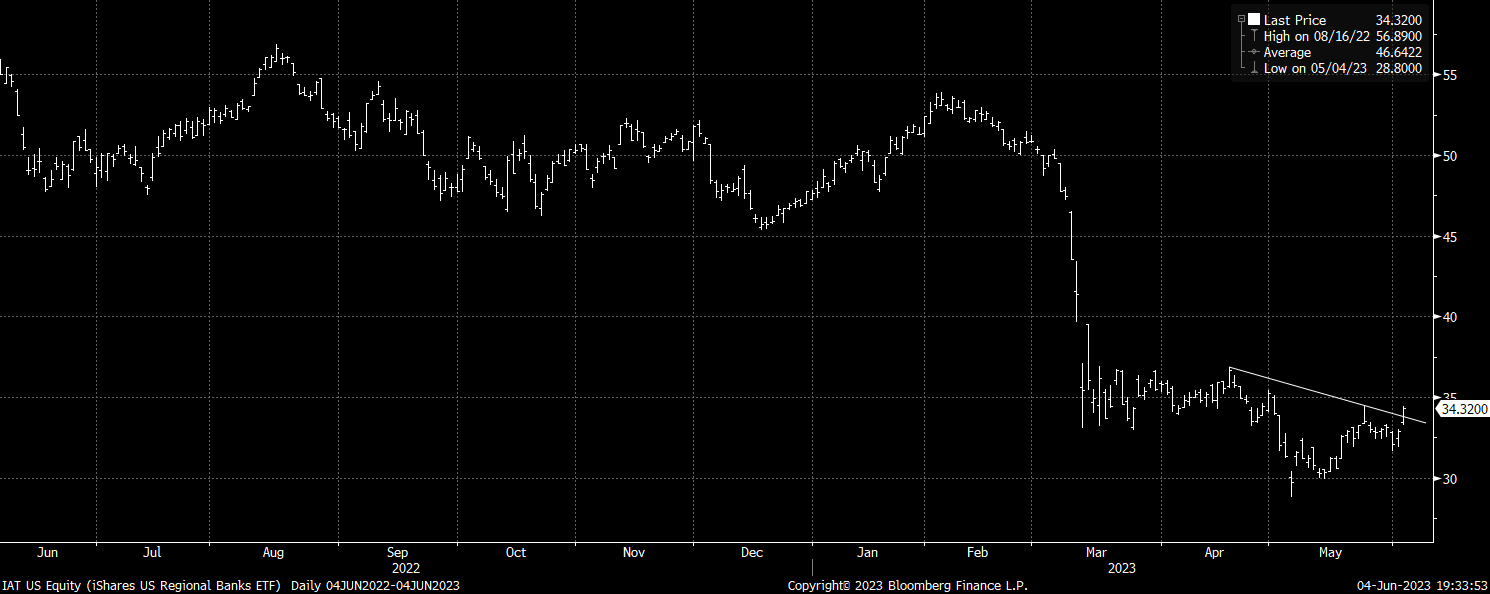
The iShares U.S. Regional Banks ETF (IAT) was up over 4% on Friday, and from a technical perspective is on the cusp of a significant reversal pattern. Notably, this rally is coming in spite of renewed upside pressure in US interest rate expectations and Treasury yields suggesting that rising yields are no longer seen as posing a risk to financial stability.
Further gains in the IJR are supported by the price action in other risk assets. The S&P 500 followed the Nasdaq to new recovery highs, while the VIX closed at its lowest level since before the Covid crash. The VIX tends to bottom out slightly before the S&P 500 tops out, suggesting there is some further upside to come. Meanwhile, corporate credit spreads contracted across the board, with high yield spreads down 30bps on the day.
The Relative Value Case Has Become Even More Compelling
Over the past two months the S&P 600 Small Cap index' discount to the S&P 500 has grown even more attractive. The price-to-sales ratio on the small cap index is now 40% and 2 standard deviations below its 20-year average relative to large caps as the chart below shows.
S&P 600 Small Caps Vs S&P 500 Price-to-Sales Ratio (Bloomberg)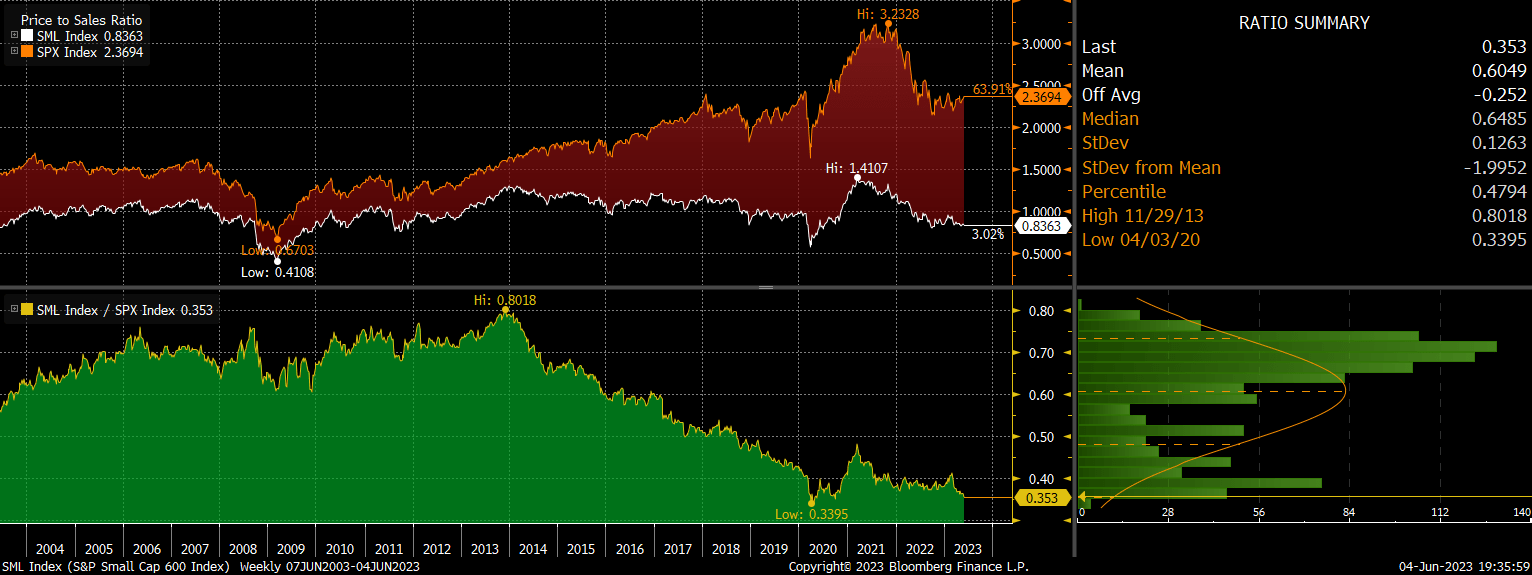
The extreme valuation discount on the basis of the price-to-sales ratio is surprising as unlike during the height of the Covid crash small cap profit margins are near record highs. At 15.0x, the S&P 600 Small Cap index trades at a 27% discount to the S&P 500 on a P/E basis, compared to an average premium of 32% over the past 20-years.
S&P 600 Small Caps Vs S&P 500 P/E Ratio (Bloomberg)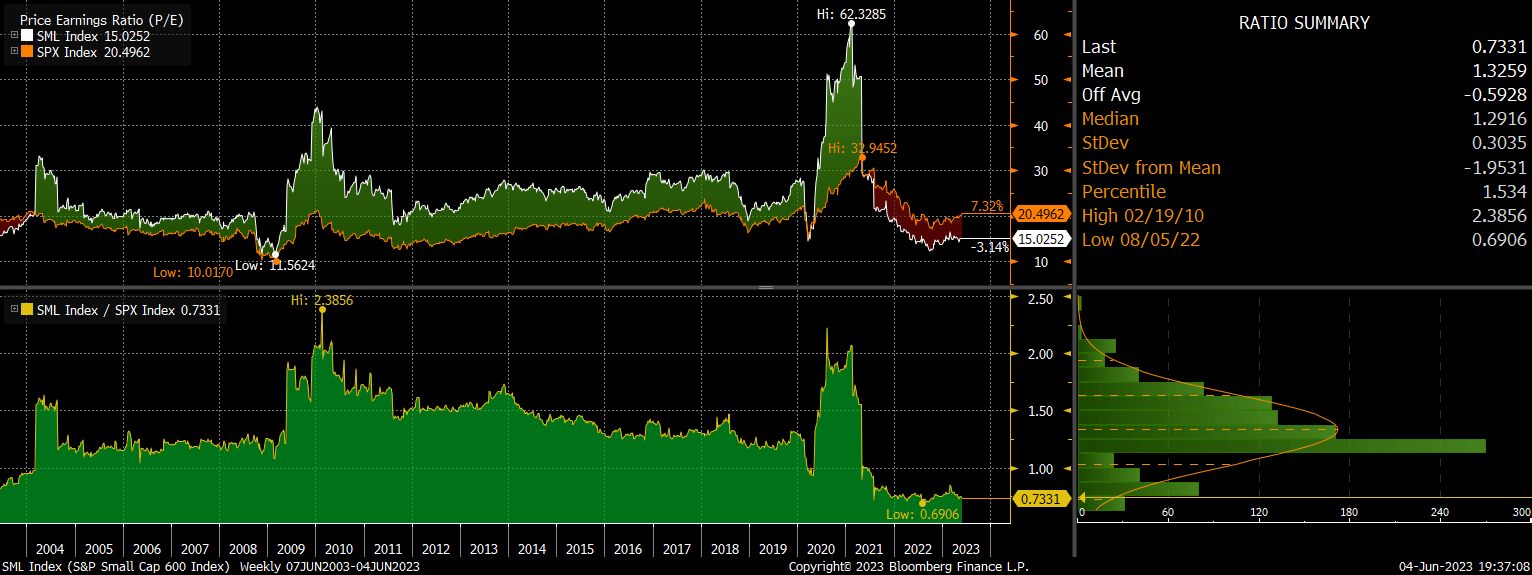
The S&P 600's undervaluation is also reflected in its dividend yield, which is now 20% above the S&P 500, compared to an average of 35% below over the past 30 years. While the yield remains only 2%, the buyback yield is an additional 2.7%. Net buybacks have contributed 3.2% annually to IJR returns over the past two decades and continue to make use of cheap valuations to reward shareholders.
IJR Could Outperform The S&P 500 By 10% Annually Over The Next Decade
The undervaluation of the S&P 600 Small Cap index contrasts with its track record of faster growth in sales and earnings over the long term when compared to the S&P 500. Sales per share have risen by an impressive 8.6% over the past two decades, outperforming the S&P 500 by 3.2% annually, largely due to more aggressive net buybacks afforded by cheaper valuations.
If the S&P 600 Small Cap index can maintain this outperformance over the next decade, we should see it resume its long-term outperformance relative to the S&P 500. Even if valuations remained at current levels, the S&P 600 Small Cap index should outperform by around 4% annually when the higher dividend yield is factored in. If we also factor in a gradual reduction in the small cap valuation discount to its long-term average over the next decade, this could add at least another 6pp to annual outperformance.
The main risk comes from renewed weakness in small cap bank stocks, which have a 16% weighting in the IJR and despite their nominally cheap valuations, remain heavily exposed to a financial crisis. With interest rates continuing to rise and money supply contracting at its fastest pace since the Great Depression, the fundamental backdrop for risk assets continues to deteriorate. That said, with the recent technical breakout and relative undervaluation, the IJR is a good bet for investors looking for cheap exposure to the US market.
This article was written by

Analyst’s Disclosure: I/we have a beneficial long position in the shares of IJR either through stock ownership, options, or other derivatives. I wrote this article myself, and it expresses my own opinions. I am not receiving compensation for it (other than from Seeking Alpha). I have no business relationship with any company whose stock is mentioned in this article.
Seeking Alpha's Disclosure: Past performance is no guarantee of future results. No recommendation or advice is being given as to whether any investment is suitable for a particular investor. Any views or opinions expressed above may not reflect those of Seeking Alpha as a whole. Seeking Alpha is not a licensed securities dealer, broker or US investment adviser or investment bank. Our analysts are third party authors that include both professional investors and individual investors who may not be licensed or certified by any institute or regulatory body.