U.S. Housing Is A Dead Man Walking (Update 2023)

Summary
- Buying a home in the U.S. is extremely unaffordable as housing, adjusted for inflation and mortgage rates, is the most expensive in four decades.
- Home prices are down 1-4% over the past year.
- There is not a “shortage” of housing.
- The unprecedented expansion of the money stock ignited the strong rise in home prices.
- Our research concludes that single digit declines in home prices are probable over the next 18 months.
fstop123
If you appreciate this article please like, comment, and share. Thank you.
Last year we wrote an article on housing titled U.S. Housing Is A Dead Man Walking. In it, our analysis identified risks to the U.S. housing market with this concluding thought:
The U.S. Housing Market is really screwed up. Everyone is trying to buy and first time homebuyers have been left in the dust. In any market, when everyone is bullish that is a good sign the top is near.
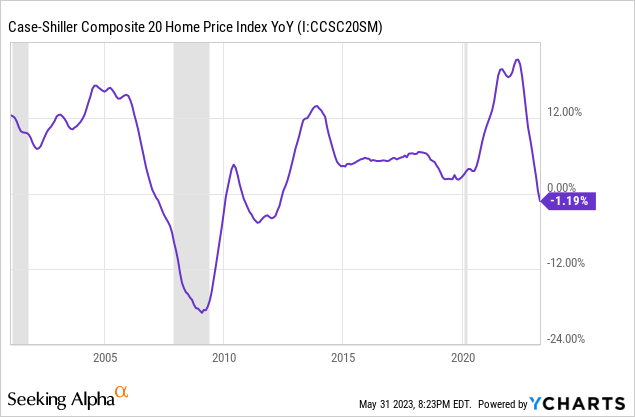
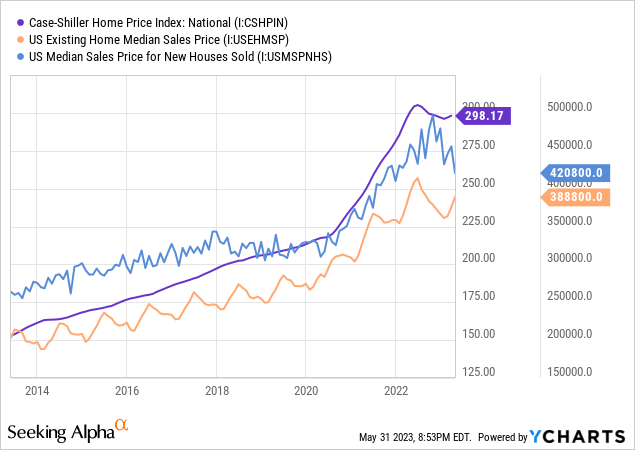
Since then, the housing market has peaked as the Case-Shiller Composite Home Price Index has now fallen to -1.19% year over year. The value of U.S. homes has declined by an estimated $2.3 trillion in 2022.
With the top clearly behind us, it's time for an updated take on the U.S. housing market. Is it still a "dead man walking" or is the bottom in?
Our overall assessment is that the U.S. housing market is deeply distorted. Affordability is abysmal. The real mortgage price index by John Wake shows just how bad it is. The average monthly mortgage payment, adjusted for inflation and interest rates, is still near all time highs across the U.S. Some of the priciest cities, including Phoenix and Miami, are just below their all time highs set in 2006.
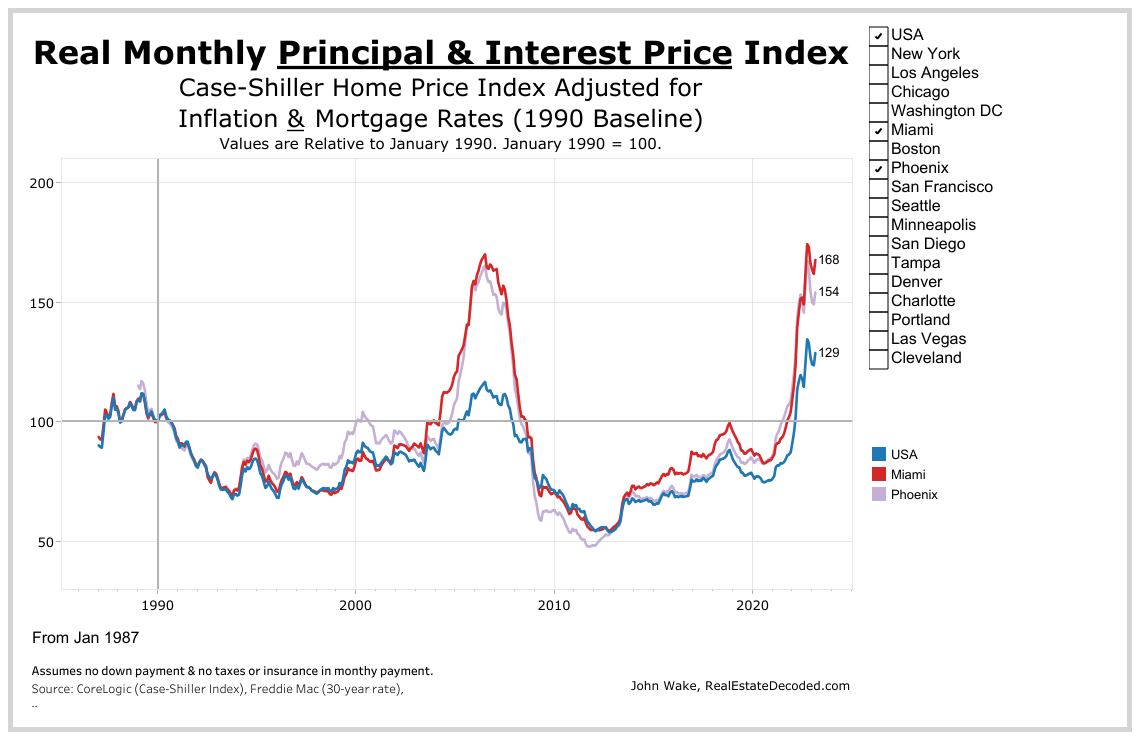
Realestatedecoded.com, John Wake
The real mortgage payment price index is the best measure of housing affordability, in our opinion. Prices are significantly influenced by leverage as most homebuyers mortgage their purchase. As such, the monthly payment in relationship to prevailing rents and wages is the realistic measure of affordability that impacts housing decisions. According to this index, and many other measures, housing in the U.S. has never been more expensive.
This means that one of three things must occur:
- Mortgage rates decrease
- Household incomes increase
- Home prices decrease
In reality, a combination of these factors can bring balance to the housing market. As they say, "the cure for high prices is high prices." We see the evidence of cure creeping through. The U.S. housing market isn't dead. But it does need to be brought back to life.
Where The Housing Market Is Today
According to the S&P/Case-Shiller U.S. National Home Price Index, home prices in the U.S. peaked in June 2022. But price momentum is not even across the country. The price declines are concentrated in Western States including California, Arizona, and Oregon. Much of the Midwest and Southern US are still at their all time highs. The Nationwide Building Society House Price Survey Index found that in May home prices were down 3.4% YoY. Downward price momentum has been strong with the most rapid decline in home prices since 2008.
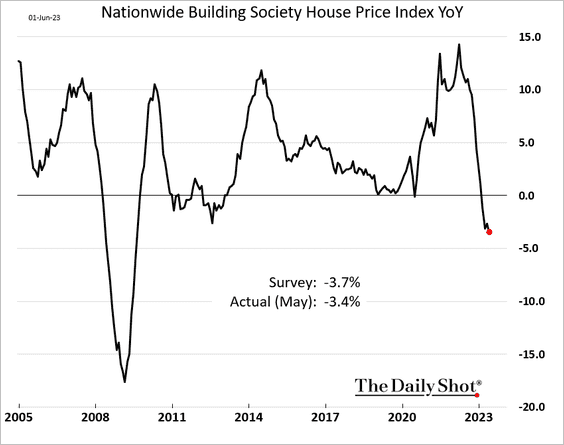
The Daily Shot (used with permission)
The Case-Shiller Home Price Index found support in early 2023, prompting optimism that the housing market had bottomed. This is partly a function of seasonal interest in home buying and temporary relief to mortgage rates. But while existing homes have held onto prices relatively well, new home prices have weakened. This change is not fully represented in the price data because homebuilders have been offering numerous incentives to homebuyers to encourage sales without dropping the sticker price. A study showed that 57% of home builders offered an incentive in February 2023. These incentives include mortgage rate buy downs (often 1-2%), covering closing costs, and including upgrades at no extra cost.
The best word to describe the U.S. housing market is stalemate. Existing home sales have plummeted to levels last experienced during the wake of the great recession.

Sellers Are Stuck
The incentive structure of the market has been completely warped to encourage everyone to sit and do nothing. Sellers have become frozen because 99% of mortgages are below current mortgage rates with the average mortgage rate in the U.S. below 4%. Sellers are suffering from recency bias and expect to receive the same amount for their home as they would have a year ago.
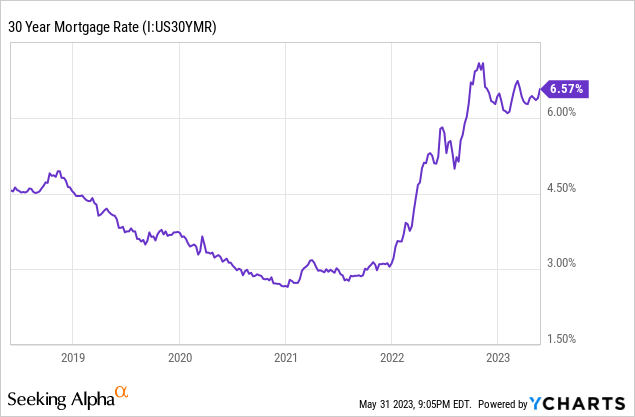
This bias is blind to the fact that as mortgage rates rise the intrinsic value of property declines. Mathematically, when mortgage rates rise from 4% to 5% the intrinsic value of property is expected to decline by 11%. When rates rise further to 7.5% the decline rises to 32%. This is because for most homebuyers the price they can afford depends on the monthly payment as a function of their monthly income. With all other things being equal, they can afford less home at higher rates. For this reason, sellers are strongly disincentivized to surrender their sub-4% mortgage rate to obtain a mortgage at today's rates of 6.5%+. Sellers are sabotaging themselves by expecting the same price for their current home at higher rates when they themselves cannot afford their own home at current rates and prices.
Buyers Are Locked Out
With prices remaining stubborn in the face of rising rates, buyers are getting locked out. The average real monthly mortgage payment in the U.S. is around $2,900 per month. The historical limit for the real monthly payment has been around $2,400. The household income required to afford a median mortgage is now above $100,000, far above the median income of $70,000.
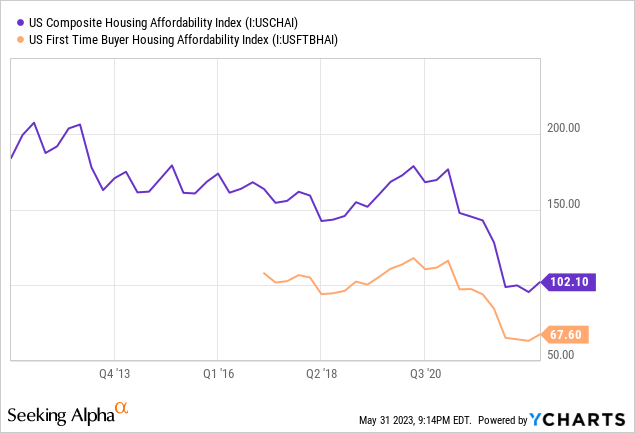
The U.S. Housing Affordability Index is now lower than the bottom in 2007. The average house payment to income ratio is around 42%. This last peaked at 41.7% in 2007 and troughed at 23% in 2013. The average since 1997 is 30.2%, which is the ratio that is commonly recommended by financial advisors. Home prices would need to decline by more than 30% to reach that historical mean.
As a result, mortgage originations have fallen sharply. In January 2023, 82% of Fannie Mae survey respondents said that now is a "bad time" to buy a home. Buyers suffer from their own measure of recency bias as many look to the prices of 2020 and prior and remain skeptical of the 30-40% increase in home prices since that time. Data from Redfin demonstrates that 21% of homes for sale in 2022 were considered affordable, a significant drop from 40% in 2021 and 45% in 2020. CBS News recently published an article that said for most Americans owning a home has become a "distant dream." To say that first time home buyers are despondent would be an understatement.

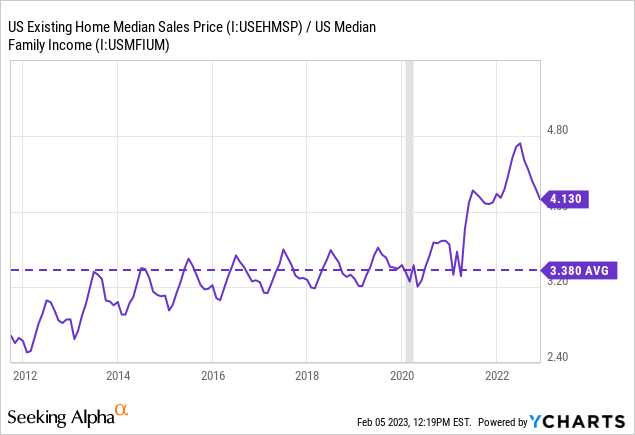
The U.S. median housing payment as a percentage of median income was 42.9% in December, down from a peak of 46.4% but still higher than the peak in 2006. To return to trend, median home prices need to fall 18.5% or median family incomes need to rise 22%.
How Did We Get Here
The meteoric rise in home prices was not a complete surprise. Some contributing factors, such as mortgage rates, were obviously bullish for the market. However, it was the combination of near-perfect factors that resulted in the most expensive housing market in U.S. history. It all started with the Federal Reserve and the COVID pandemic.
Monetary Stimulus
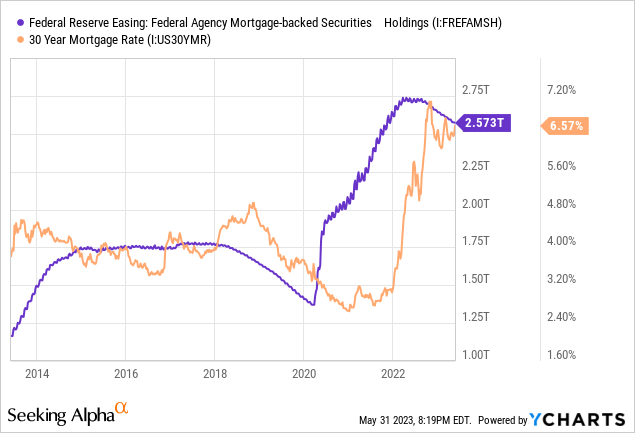
In response to the COVID pandemic in early 2020, the Federal Reserve expanded its balance sheet and dropped interest rates in an attempt to support the economy through monetary easing. This included the purchase of $1 trillion in mortgage backed securities. By purchasing MBS, the Fed provided liquidity to the residential lending market which helped to subdue mortgage rates below 3%, the lowest in modern history. The lower rates made mortgage payments more affordable and allowed homebuyers to bid up prices. As prices bid higher, it encouraged speculation and cemented competitive bidding as homeowners feared missing out on the appreciation gains in the market.
Fiscal Stimulus
The Federal Government contributed to the support effort by enforcing moratoriums on evictions, foreclosures, and student loan payments. Next, over $814 billion in stimulus checks were distributed to American households while $800 billion in Paycheck Protection Program loans were distributed, about 92% of which have been at least partially forgiven. Documented evidence suggests that fraudulent use of PPP funds are considerably common and leading to increased convictions prompting Federal officials to extend the statute of limitations for PPP fraud from 5 to 10 years. Many of these convictions involve the fraudulent use of PPP funds to purchase real estate.
The result is a sharply acute reduction in household expenses and increased income. Checkable deposits for households in the U.S. has risen over $3 trillion in the last three years.
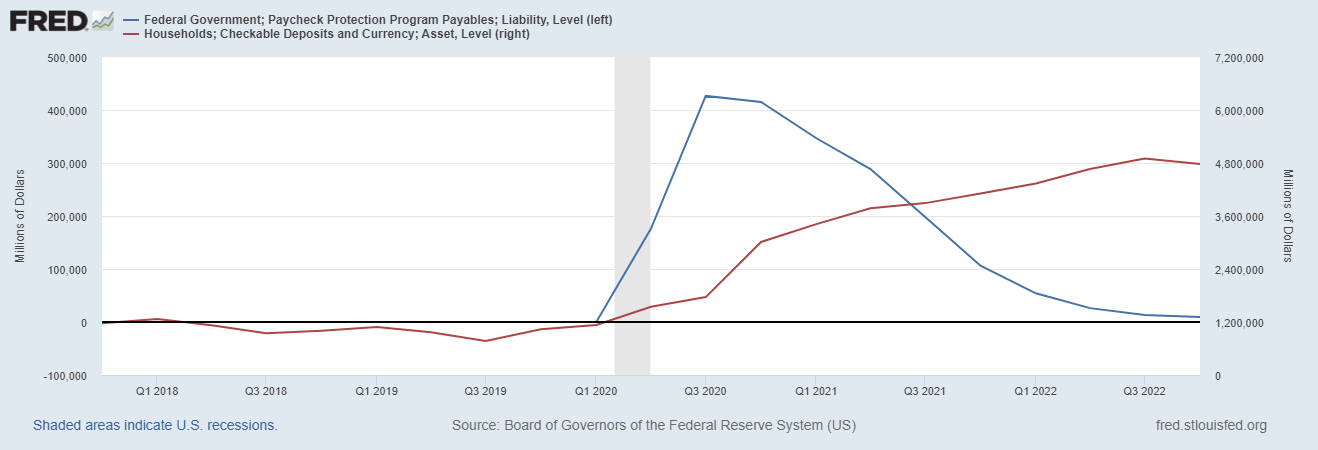
Federal Reserve Economic Data | FRED | St. Louis Fed
As a consequence, the U.S. M2 money stock rose over 40% after the pandemic. The chart below shows how the year over year price of houses in the U.S. compares to the year over year change in M2. The data demonstrates that home prices largely respond to changes in money supply with a short lag. It should be expected, then, that home prices responded to the rise in M2 money stock with impeccable similarity. Likewise, the M2 money stock has been declining in 2023 along with home prices.
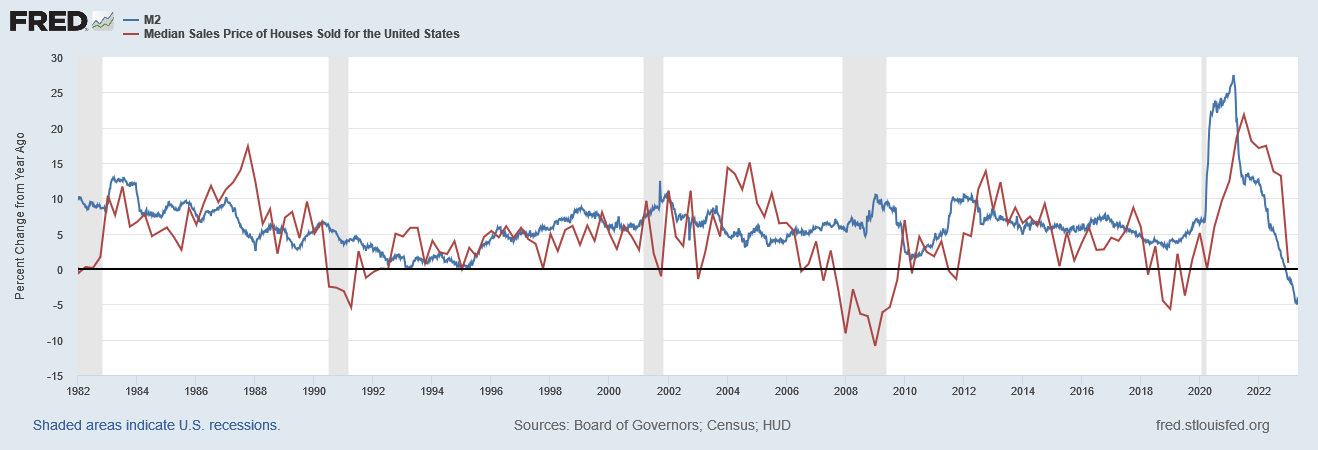
Federal Reserve Economic Data | FRED | St. Louis Fed
Change in Housing Preference
The pandemic changed much about the lifestyle choices of Americans. Because of lockdowns and the risk of virus spread, people began to value suburban homes more with extra space and backyards. After many companies transitioned their workforce to remote work, people had the flexibility to work from anywhere and chose to move to desirable destinations. This caused The Great Pandemic Migration from urban centers to suburban and rural settings. This also included many people migrating to more desirable regions such as Florida, Colorado, and other destinations.
The increase in remote work caused millions of families to reexamine their need for space in their home as people added an office overnight but with no room to put it in. Others still, with their newly infused savings accounts, could now move out of their current living situation and afford to live solely, thus resulting in household formation. These and several other factors inspired millions to exchange their home for another.
Speculation
Many people decided to use their new disposable income to invest in real estate. The market was hot which attracted a lot of attention and prices rose quickly which prompted furious buying. The web is replete with tales of extremely long queues at open houses, multiple offers within hours of listing, offers extremely over asking, waived inspections, waived contingencies, and letters written to pull at heart strings. Subscribers to the reddit forum "realestateinvesting" surged from 88,000 in January 2020 to 1.68 million in April 2023. The behavior had all the markings of euphoric speculation.
To compound this issue, institutional buyers were involved in the market in force. Between 2020 and 2023, the share of home sales to institutional buyers rose from 0.5% to 2.5%. The classification of iBuyers, like Opendoor and Redfin, accounted for another rise from 0.2% to 2.0% during that time. While the share of home sales appears minor, this dramatic change in large buyers with access to low cost capital has a major impact on the marginal buyer. These institutional buyers often offer home sellers all cash generously over asking with few contingencies. One of the most active categories of housing investment was in the short term rental space. Between 2021 and 2022, Airbnb bookings increased 31%.
Housing Inventory
The prevailing narrative is that the dramatic rise in home prices are a result of significant housing shortages in the U.S. Intuitively, there has been neither a dramatic rise in population nor decline in housing units over the past three years that would justify a sharp rise in price. It should go without saying that today there is currently not enough supply to meet demand at lower prices. However, it is disingenuous to claim that there is not enough housing in the U.S. One issue is that so many of the homes are being used for purposes other than primary residence. While this contributes to housing demand, it is often overlooked as a potential headwind for the market because while primary residences are slow to change in response to economic conditions, other uses of residential homes are quicker to change.
Seasonally adjusted mortgage purchase applications fell to 147.1, the lowest since 2000. Purchase applications are down 41.5% YoY. Existing home sales ended 2022 down approximately 35% and was falling at a faster rate than during 2005-07. The MBA Purchase Index in the beginning of 2023 is the lowest since before 2014. This data demonstrates that the volume of home sales is grinding to a halt. Many analysts point to this decline in volume as a sign that inventory is tight.
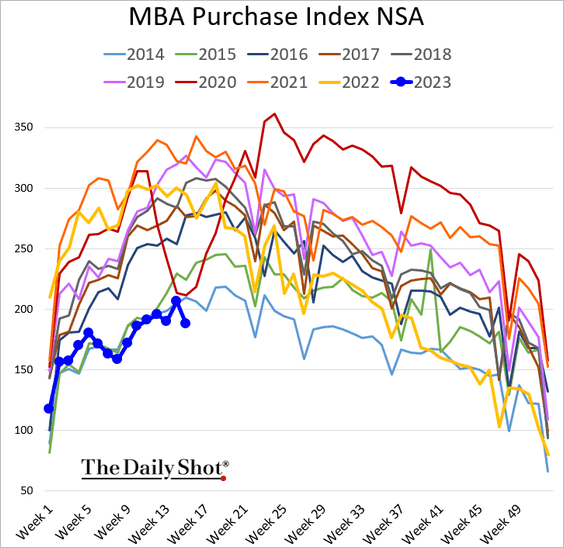
The Daily Shot (used with permission)
Home sales data supports this view. US Pending home sales are at depressed levels experienced during the midst of pandemic lockdowns in 2020. This is the same level of sales experienced after the great recession.
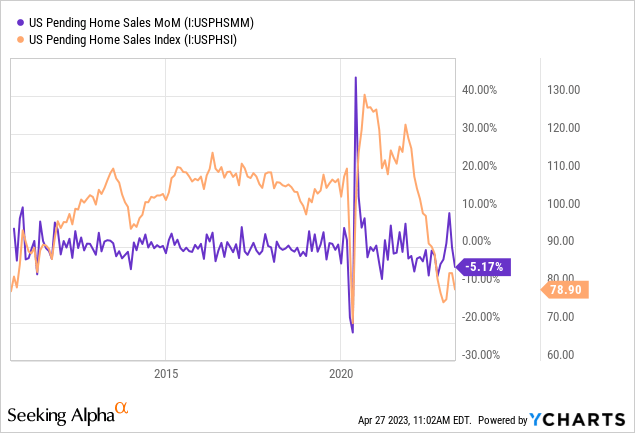
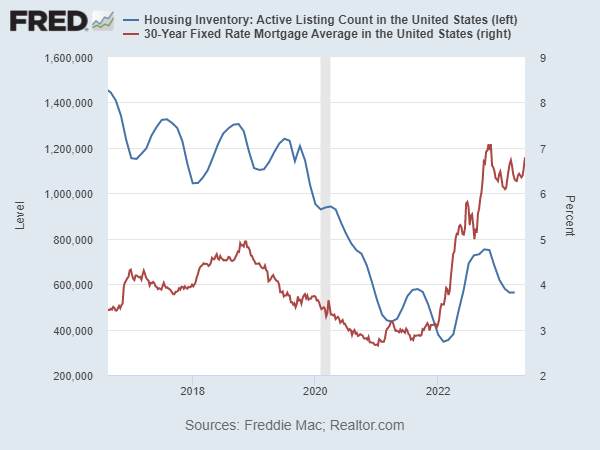
The number of active listings are well below their 10-year mean. Active listings bottomed around 400,000 in early 2022. Since then, listings have been on the rise but are still half of their pre-2020 average. Data from Realtor.com found that active listings rose 3% MoM and 22% YoY in May 2023.
Federal Reserve Economic Data | FRED | St. Louis Fed
According to Redfin, the 4-week rolling average of median days on the market for sold homes had risen to 51 days in February, the highest since February 2020 when it was above 60 days. Median days on the market was 49 in April 2023 which compares to 32 in April 2022 and 40 in April 2020. Prior to 2020, average days on the market for April is about 60.
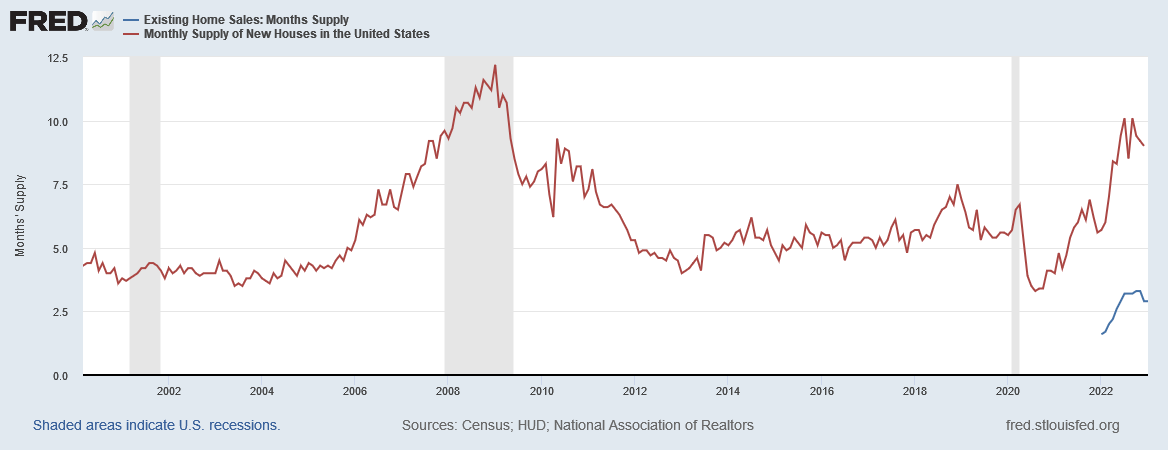
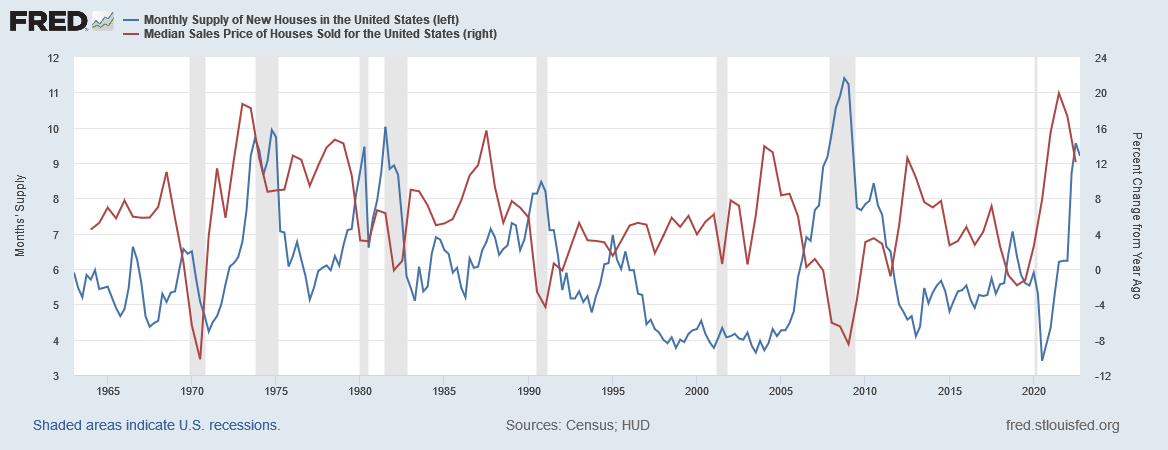
Housing inventory is trending higher. The monthly supply of new houses in the U.S. has surged higher, similar to what occurred in 2006-07. The month's supply of new homes reached 10 in 2023 while the month's supply of existing homes continue to lag at 3.0.
Federal Reserve Economic Data | FRED | St. Louis Fed
Federal Reserve Economic Data | FRED | St. Louis Fed
The data is clear: few homes are changing hands. This is an issue of volume. It should not be conflated as an issue of inventory. Below is a chart of the number of housing units in the U.S. per capita. This ratio has reached its highest mark since 2000 at 0.431 units per person. Units per capita peaked in 2008 at 0.428 units per person. One could conclude that housing units were in short supply during 2012-2018 when the ratio dipped below 0.424. But the ratio was as low as 0.414 prior to 2006.
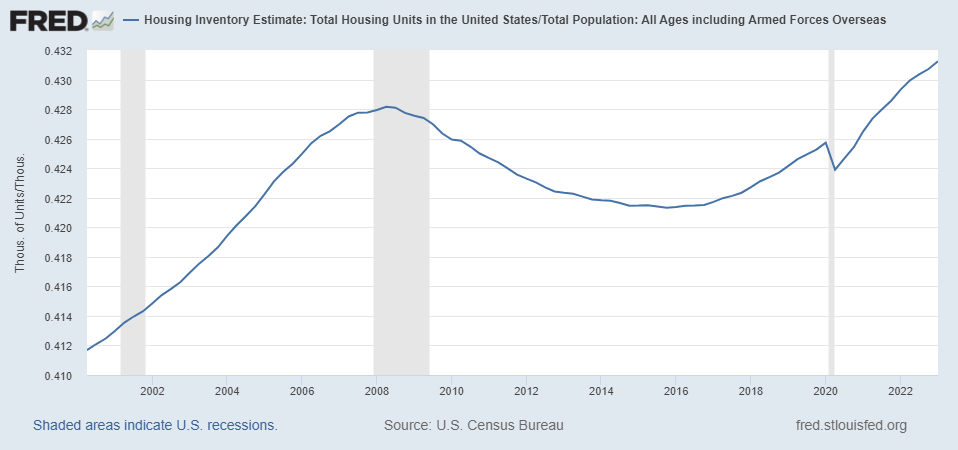
Federal Reserve Economic Data | FRED | St. Louis Fed
One difference over these years is the number of households in the U.S. Household formation is one of the most often cited factors to support market prices. Between 2019 and 2021, the number of households in the U.S. grew by approximately 2.1 million, double the pre-2019 average. Data from Statista shows that the average household size has declined from 2.52 in 2019 to 2.5 in 2022. This trend has been gradually declining for decades. The average household size in 2007 was 2.56.
U.S. Census Bureau data shows that the number of estimated housing units per household in the U.S. is 1.11. This is down from a peak in 2009 of 1.17. This ratio was last at 1.11 in 2002. We believe that while household formation has been robust and the ratio of housing units to households has declined, it does not indicate such a housing shortage as to result in extreme affordability issues. The amount of housing supply per capita is at historic highs. Naturally, during times of economic weakness, household sizes tend to increase as individuals choose to cohabitate with relatives or roommates to reduce shelter expenses. The surge in disposable income, as discussed earlier, is likely the primary contributor to this household formation. This is supported by the correlation between disposable income and household formation from 2020-2022.
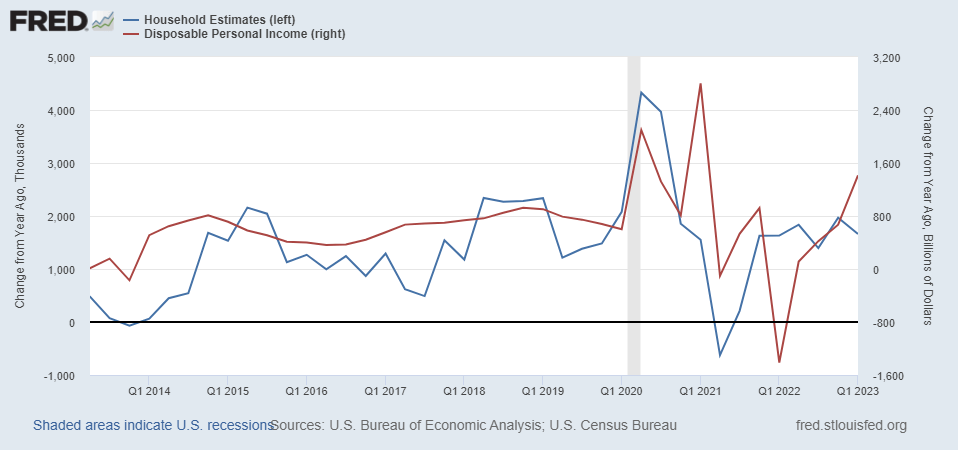
Federal Reserve Economic Data | FRED | St. Louis Fed
Our position is further supported by the fact that housing square feet per capita in the U.S. has been increasing since 2015. There is now approximately 755 square feet of housing space per person in the U.S. compared to 730 in 2015. Our conclusion is that housing inventory is not the root cause of home price appreciation. Above average household formation has contributed to the tightness in available supply, a factor that is easing and prone to reverse during economic turmoil.
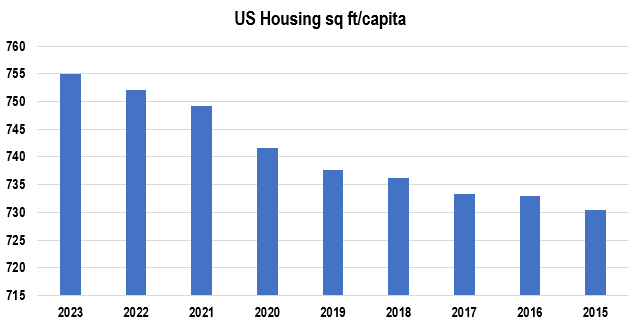
Chart by author (data from Statista)
Construction
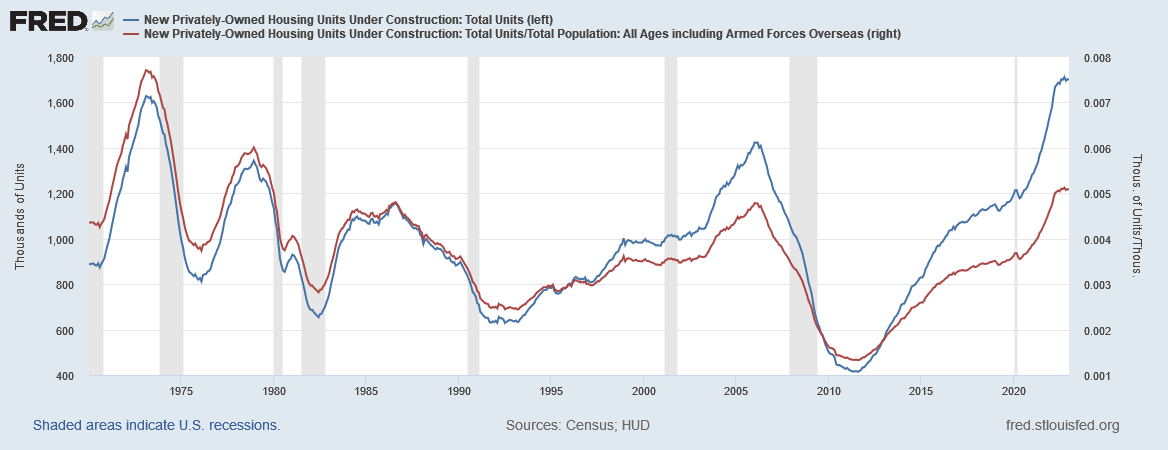
Tightness in inventory is due to be supported by the quantity of housing that is under construction. Homes under construction and not started surged higher after 2020, spurred by the spike in demand. Homes under construction has peaked at 320,000 and started to decline, at levels that rival the highs in 2006. Completed houses, however, remains subdued at less than 120,000. It takes about a year for an average single family unit to reach completion. Most of these homes experienced construction delays because of supply shortages in response to pandemic lockdowns across the globe. These supply chain disruptions are largely resolved and shortages are being abated. This will contribute a significant amount of supply over the coming year.
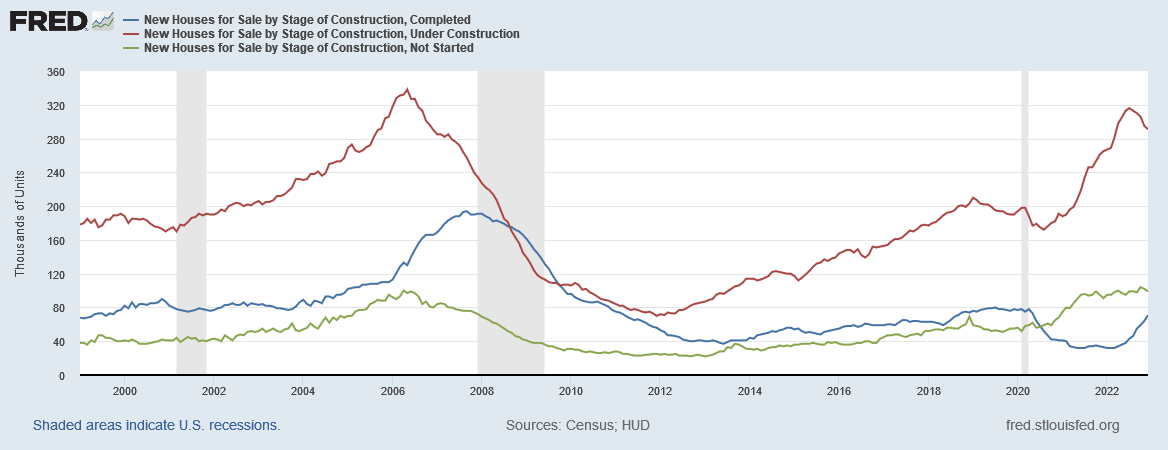
Federal Reserve Economic Data | FRED | St. Louis Fed
Below is new privately-owned housing units under construction and then adjusted for population. The rate of new construction is higher than 2006 by both measures. There is currently 0.005 housing units under construction per capita.
Federal Reserve Economic Data | FRED | St. Louis Fed
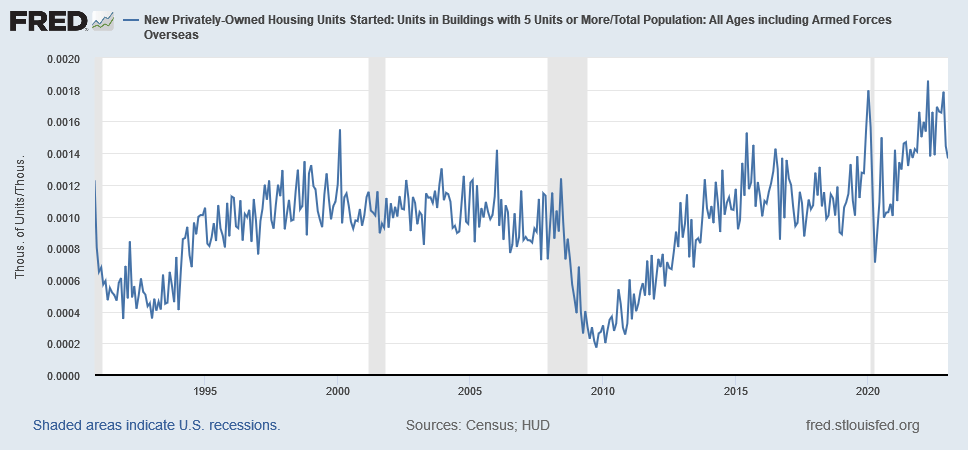
Similarly, the number of multi-family units under construction per capita is near the highest rate in 30 years at 0.0014.
Federal Reserve Economic Data | FRED | St. Louis Fed
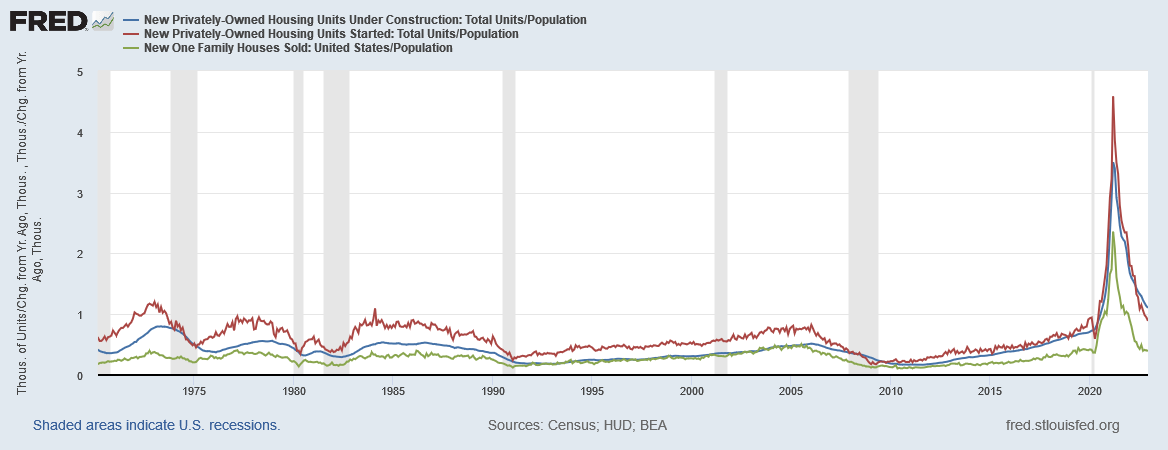
A widely overlooked but still important measure to consider is the rate of construction in relationship with the rate of population growth. Below is a chart of the change in units under construction, units started, and new single family houses sold divided by the change in U.S. population. This is again, another reason that the housing shortage assumption is incorrect, in our opinion. The long term average ratio of units under construction growth to population growth is around 0.35. In March 2021, the ratio spiked to 3.5. Between 2009 and 2012, the ratio was suppressed below 0.2. But prior to the great recession, inventory levels were excessive following years of construction growth above 0.4 per capita growth. Today the ratio is above 0.98, a mark that has not been reached between 1970-2019. The ratio last peaked in January 2006 at 0.51.
Federal Reserve Economic Data | FRED | St. Louis Fed
A decline of this magnitude, often precedes recession. Five of the last seven recessions experienced a decline in construction growth leading up to the recession. More importantly, no significant decline in growth during the last 50 years has occurred without recession. This will become more important in a moment.
Housing Market Headwinds
Now that we have a sense of where the market is today relative to the past and how these conditions came to be, we will next examine the factors that will influence the housing market going forward. There are a number of tailwinds for the housing market including a large millennial generation coming into home buying age, the large amount of liquidity remaining on household and corporate balance sheets, and a strong market sentiment for real estate. However, we believe that the headwinds outweigh the tailwinds. Next, we will examine the key headwinds.
Cost of Construction and Builder Margins
Housing has an intrinsic value which is most often measured by using the replacement cost of the property. It's not reasonable to expect the market to price real estate property as an aggregate below the cost of construction for more than very brief periods under extraordinary circumstances.
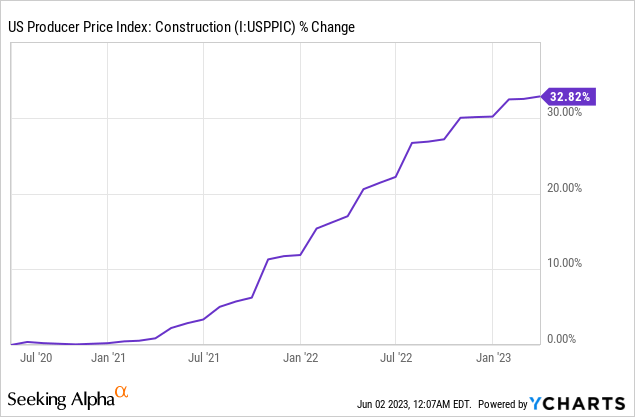
The cost of construction has risen considerably with inflation after the pandemic. While supply chain constraints contributed to price inflation, we strongly believe that the expansion of money supply was the primary factor. The U.S. Producer Price index, one of our preferred measures of inflation, peaked over 10% YoY in 2022.
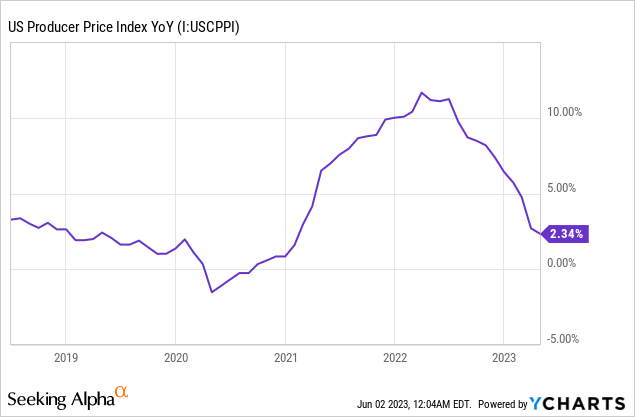
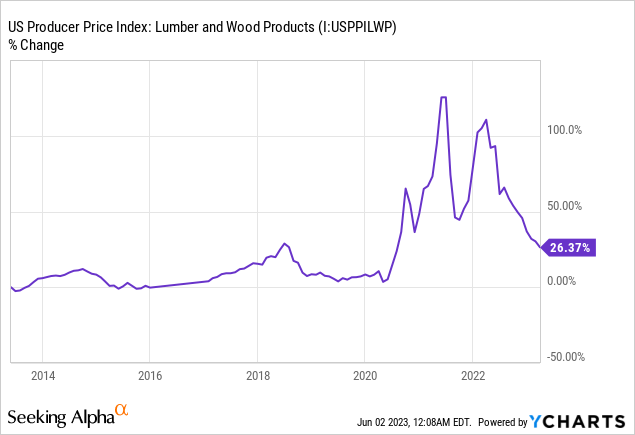
Since 2020, the PPI Index for construction costs has risen by 32%. Lumber and wood products, a major input cost for residential construction, spiked over 100% in 2021 before falling by 75%.
The inventories to sales ratio for lumber and related materials fell as price rose, a function of a surge in demand as home starts and construction numbers rose quickly. Since then, the inventories to sales ratio has recovered to a level last experienced during the beginning of the pandemic. This data collaborates with price that lumber material shortages have been alleviated and contributed to lower costs going forward. However, most of the new homes currently for sale were built with lumber that was acquired at higher prices. These lower prices are expected to contribute to lower construction costs in the year ahead.
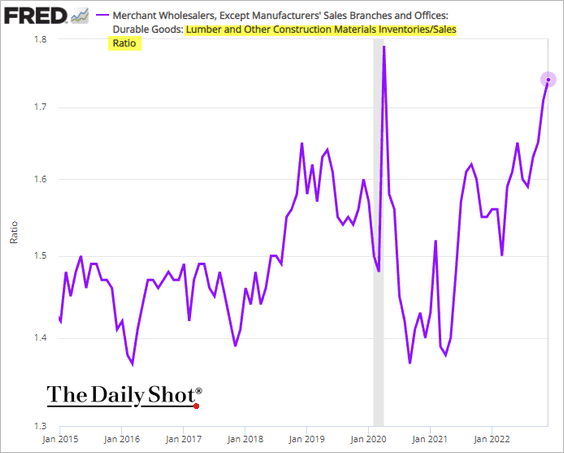
The Daily Shot (used with permission)
Below is the relationship between lumber futures and the median sales price for new houses. The relationship is closely correlated until the second half of 2022, a function of construction delay. Lumber futures today suggest that the price of new homes could decline by as much as 25% in the years ahead, provided that lumber prices do not climb higher.
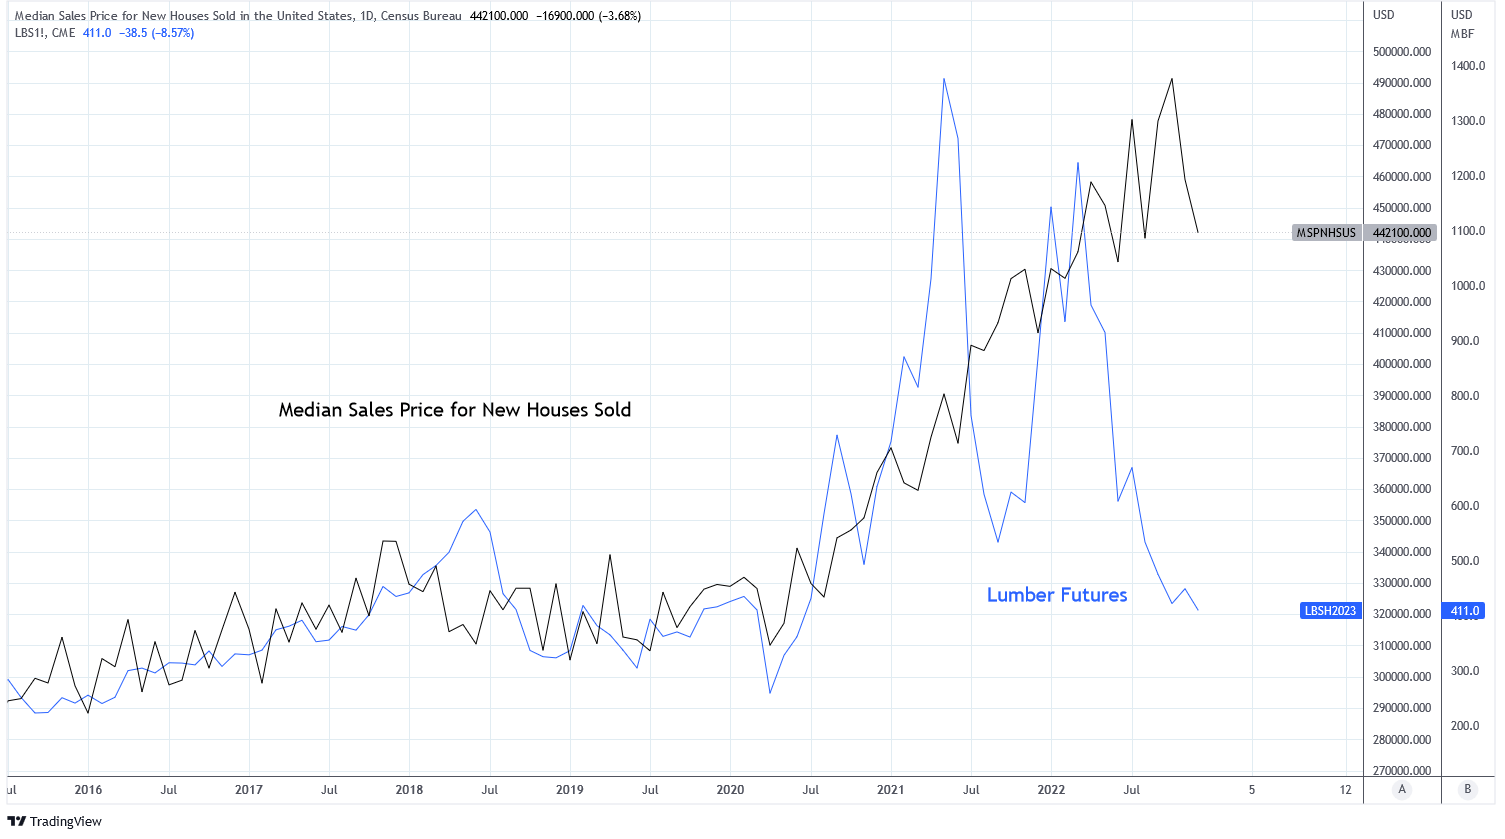
Charts by TradingView (adapted by author)
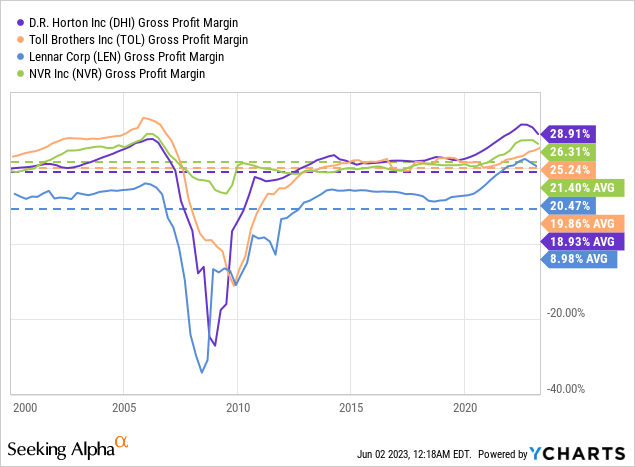
An entire article could be written exploring the cost of construction and replacement cost of U.S. housing. We find it more useful to examine the cost of construction in the context of home builder margins. Below is a chart of the gross profit margins for some of the major U.S. homebuilders. Each homebuilder is experiencing elevated gross margins compared to its 20-year average. D.R. Horton, for example, has a gross profit margin of 28.9% compared to its average of 18.9%. Gross profit margins for most home builders has begun to decline over the past year. These margins are exhibiting similar behavior experienced between 2005-2007 when they became elevated as home prices peaked and turned down. For these profit margins to return to their mean, it suggests that home prices could decline by 5-10%.
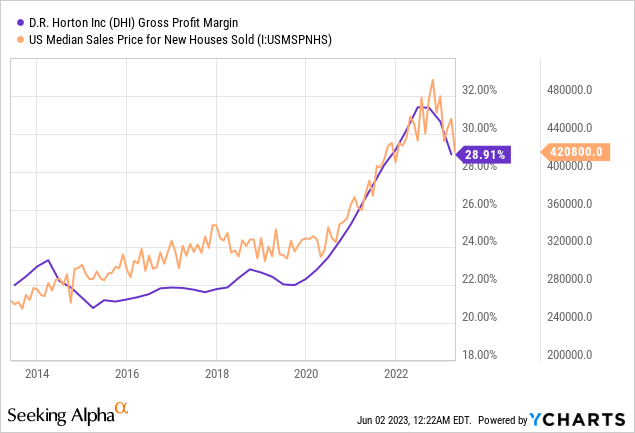
New home prices move in unison with homebuilder margins. Using DHI as an example, a return to its average gross margin over the past 10 years of 22% implies that the median sales price of new houses could decline from $420,800 to $391,000, about 7%, without any need for the actual cost of construction to decline, as it is with lumber.
At first, homebuilders reported dramatic increases to their cancellation rates as mortgage rates climbed. In 2022, DHI reported a 24.7% increase in their cancellation rate, Pultegroup reported a 122.8% increase, and MDC holdings a 97.9% increase. But recent optimism in the market and a recognition of higher mortgage rates has caused cancellation rates to recover. Homebuilders are reporting cancellation rates have fallen by half or more between Q4 2022 and Q1 2023.
Investor Activity
Investors have been heavily involved in this housing market over the past few years. We covered this topic in the Speculation section above. We believe that investor activity is key to understanding this housing market. There are many types of investors including build to rent, flippers, short term rental owners, institutional investors, iBuyers, and wholesalers, all of whom have been active in the market recently.
According to Redfin, in Q3 2021 the number of investor purchases in tracked metros reached an all time high of 95,124. At the time, investors accounted for over 20% of all home purchases. Investors are primarily targeting starter homes, as 41.1% of their peak home purchases were in the low price category.
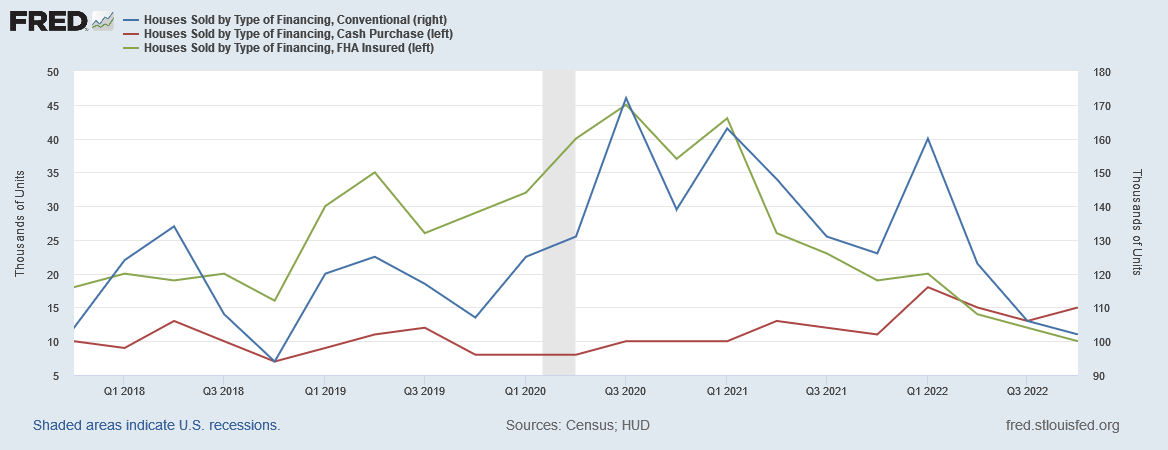
While conventional and FHA financing purchases have declined rapidly in 2022, cash purchases have actually increased. This is because investors, who are most often cash buyers, have been less impacted by mortgage rates than traditional home buyers. These investors use investor capital or hard money lines of credit to make competitive offers on homes.
Federal Reserve Economic Data | FRED | St. Louis Fed
The trend, however, is beginning to change. Redfin reports that in Q4 2022 investors bought 18% of homes, still high but off of the peak. In Q1 2023, investor home purchases were down 49% YoY. Redfin also reports that approximately 10% of homes currently for sale are owned by investors. Many of these investments are now underwater. The percentage of flipped homes that sold at a loss in Q1 2023 is reportedly 20%. Redfin estimates that in March 2023, 1 in 7 homes sold by investors were at a loss. House flippers are the most exposed because their projects could not finish quickly enough to respond to changes in mortgage rates that has reduced homebuyer purchasing power.
We believe that investor demand was a primary contributor to current housing market pricing. If this source of demand continues to shrink, it will remove support from market prices. Turmoil in the commercial real estate space is growing tense. Large properties are foreclosing or selling at significant losses. Investors are becoming wise and pulling their capital out of real estate investments. This is why we believe that many private equity firms, such as the Blackstone Real Estate Income Trust, are limiting withdrawals from their funds; to avoid having to liquidate assets at depressed prices.
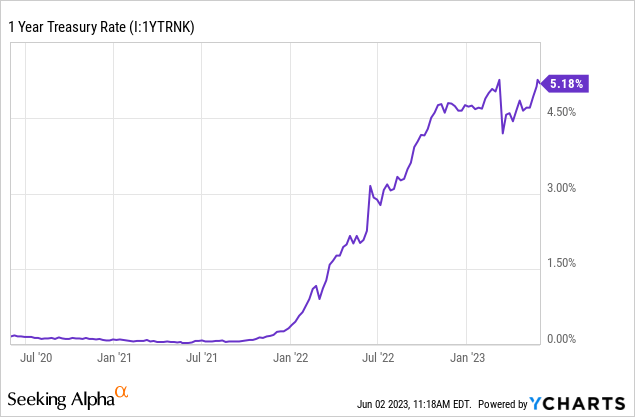
It's not clear if the same issues in commercial RE will develop in residential. There are different factors at work. While residential has benefited from the shift to remote work, commercial has suffered from it. If this trend reverses the same can be expected on its impact. But what they have in common is that the cost of financing and competition for investor capital has risen dramatically. Interest rates have increased significantly with the 1-year Treasury rate rising from essentially zero to over 5% in a year and a half. While most mortgage holders have low fixed rates for an extremely long duration of 20+ years, institutional investors do not have the same duration. Estimates suggest that the average capitalization rate on residential property is approximately 4.63%. When interest rates were near zero this yield was attractive, especially when paired with the gains in appreciation. But now, Treasuries are offering more than 5% which incentivizes many investors to invest in fixed income over real estate, especially if they feel that prices are in decline.
Foreclosures, Loan Standards, DSCR Loans
We often like to describe the housing market as a flow process. At all times there is a flow of people into homes and a flow of people out of homes. There is a flow of people into bigger/better homes (upsizing) and a flow of people into smaller/simpler homes (downsizing). Housing market sentiment and price is largely a function of dominant direction of flow.
Here are a few examples of positive flow:
- First time homebuyers leaving school, a rental, or parent's residence to purchase a home.
- Homeowners that trade up their starter home for a bigger home.
- Divorces and other relationship changes that result in one home being split into multiple homes.
- Homeowners that purchase a second home.
Here are a few examples of negative flow:
- Homeowners are foreclosed, voluntarily or involuntarily, and move into a rental, cohabitation situation, or smaller home.
- Death of a sole homeowner.
- Move into retirement community or similar living situation due to retirement, medical condition, or incarceration.
- Homeowners that sell a second home.
When the natural flow of the market is disrupted it results in distortions in the balance of market pricing. Such has been the case since 2020 when the Federal Government enacted foreclosure and eviction moratoriums nationwide. As expected, foreclosure and eviction rates plummeted, nearly to zero.
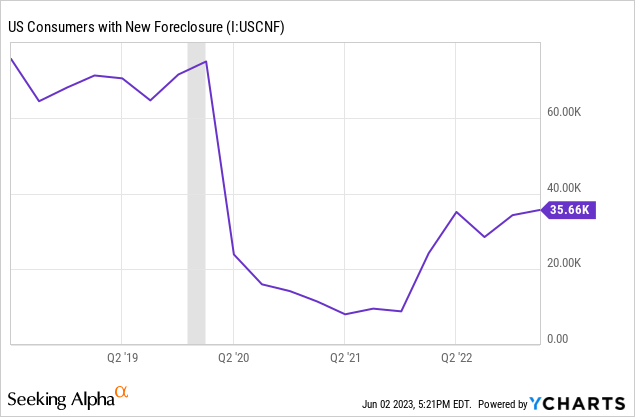
The result is a steep decline in vacancy rates for homes and rentals in the U.S. Both vacancy rates are the lowest in decades.

This stoppage of negative flow from foreclosures has helped to set a floor in the housing market by limiting new supply from entering the market. While there is nothing to admire about foreclosures, they are a necessary outcome in real estate. Without foreclosures, moral hazard develops, leading to poor finance decisions.
Foreclosures are still at a historically low rate but are in the process of normalizing. Foreclosure filings have doubled between 2021 and 2022. Residential foreclosures are up 30% YoY in Q4 2022. It takes considerable time to process this uptick in foreclosure filings as Courts are overburdened. Foreclosures in Q1 2023 are up 6% QoQ and 22% YoY. Negative flow from foreclosures is slowly returning.
Homeowners, by and large, have a lot of equity in their homes. This is a tailwind for housing as it prevents many homes from going to foreclosure. However, if prices were to fall, equity would contract which puts more pressure on foreclosures. This was experienced in 2008, primarily a result of very poor lending standards including the infamous NINJA loans, also known as "liar loans," where buyers didn't need proof of employment or income. NINJA loans proved that if given the choice to make a poor buying decision, lenders and buyers will often make that choice.
New regulations have prevented the return of NINJA loans in today's housing market, one of the many differences between today and 2008. Another difference being that most mortgage holders have fixed rates today while many had adjustable rates in 2008, a condition that exacerbated the Great Recession. However, we would not describe today's lending practices as conservative.
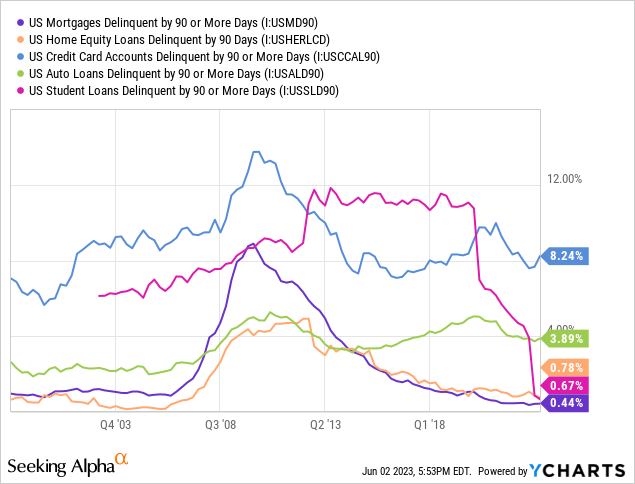
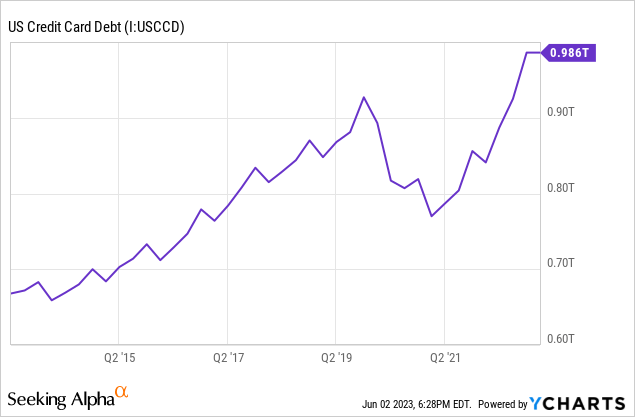
First, FHA loans require a minimum credit score of 580 in order to borrow at a minimum down payment of 3.5%. We have already seen home prices decline by 3.5% from the peak. Another 3.5% decline would put thousands of these FHA loans underwater. The average credit score in the U.S. for low income earners is 658. Currently, delinquency rates for mortgages, credit cards, auto loans, and student loans are still low. However, delinquency rates for auto loans are rising, up 26.7% YoY in December. Credit card debt in the U.S. shrank after the pandemic but is now back on its pre-2020 trend. Credit card delinquency has been on the rise and TransUnion is forecasting that serious credit card delinquencies will rise from 2.1% to 2.6% by the end of 2023.
Another loan type to examine is Debt Service Coverage Ratio Loans (DSCR). Beginning in 2021, DSCR loans have risen in popularity, as represented by Google Trends data that shows a surge for search term DSCR over the past 2-3 years. DSCR loans operate by using the expected cash flow of a property to qualify for the mortgage. Most DSCR loan borrowers are interested because they do not have a traditional income source to qualify for traditional mortgages. FitchRatings has expressed concern over non-qualified mortgages and expects higher losses from these loans in the future.
DSCR loans have been particularly popular for short term rental investors who have limited capital and no source of income other than their STR investments. According to information from a mortgage broker, DSCR loans require a minimum credit score of 680, a loan to value of 80%, and can close in 12 days on a STR without any documents. The appraiser uses data from AirDNA to assess the expected income on the property.
Short Term Rentals
Short term rental demand has been very hot over the past two years. Anecdotally, people have expressed that they are "making up for lost time" as their vacation trips were paused through much of the pandemic. With extra disposable income, Americans have been seeking out the privacy and enhanced experience of STRs.
Social media platforms, including Reddit, have become inundated with social media influencers boasting about their wild successes in STR real estate. Investors have been active in converting SFH into STR to meet the increased demand. Data from AirDNA found that in January 2023 listings had increased 21.9% YoY and bookings by 14.5% YoY. Average daily rates were up 3.1% YoY. By March, average daily rates were up 2.2% YoY. By April, they were up 1.4% YoY, representing a slowing of momentum. Occupancy in May was also 4.9% lower YoY which is higher than March at 2.1% lower YoY. Seasonally adjusted, this is the lowest Occupancy rate in three years. This is mostly attributable to higher numbers of listings.
Growth is strong in the lodging sector. The U.S. Census Bureau construction spending report in June showed that year to date in 2023 construction spending on lodging was $7.5 billion which is 40.6% higher than last year. This compares to a 6.1% increase in total construction spending over this time period. The number of available STR listings in the U.S. has increased from 0.9 million in 2021 to 1.43 million in 2023. Active listings were up 18.9% YoY in April 2023.
Mortgage lenders that specialize in vacation home DSCR mortgages have reported tremendous profits as a result of this boom in demand, sometimes over $100,000 per month. These lending practices are enabling investors to afford prices that otherwise would not be possible. This article describes one such situation where an investor purchased a cabin in Tennessee with a monthly mortgage payment of $2,600. This monthly payment is too high to be covered by rent from a long term lease but it is projected that as a STR the property can do $6,000 per month in revenue. Mortgage lenders have reported that they expect to approve hundreds of millions of dollars of DSCR loans. It is unclear how many of these loans are being included in mortgage backed securities but it is possible they are.
Patricia McCoy is a former assistant director at the US Consumer Financial Protection Bureau. This is what she had to say about STR investors and DSCR loans:
The influx of the starry-eyed inexperienced investors is artificially boosting demand and causing the rental market to be overheated. This whole class of loan and, in particular, some of these underwriting practices are a sign of market euphoria. That rarely turns out well.
We tend to agree.
Here's the problem: even though the number of STR listings have not increased by a significant amount over the past three years, a fact often cited by housing bulls, the trend is having an outsized effect on the market. This is because SFH being financed as STR properties have different lending parameters than SFH that is purchased for an owner-occupier. When an owner-occupier applies for mortgage on a home they use their household income to qualify. The median household income in the U.S. is about $70,000. Alternatively, when an investor applies for a mortgage on an STR, often they are using the expected rental revenue to qualify for the mortgage.
Average STR daily rates in the U.S. are about $315. At 100% occupancy, this generates $115,000 of revenue. Consider than many Airbnb listings are not an entire SFH, skewing the average. In addition, revenue from an STR business has more tax advantages than ordinary household income and is not subject to other debt service payments, like car payments, like ordinary household income. Therefore, the effective income for debt service is much higher for STR over owner-occupiers. For DSCR and other loans, when appraisers value the home based on the potential STR income it results in a higher appraised value. Once a few homes in a neighborhood are sold using STR income to justify the price it now becomes a comp for the whole neighborhood.
An estimated 60% of Airbnb users are millennials. This large consumer group is facing two unique financial challenges. The first, is that the affordability of housing is a major impediment if they have not already purchased a home at lower prices and locked in a low rate. The second, is that they have benefitted from a pause in student loan payments for three years. That pause is due to end in mid-2023. While the political status of student loan payments remains unclear, its looking more likely that payments will resume as Congress has recently prevented extending the pause. It is estimated that the average student loan payment for Bachelor degree holders is $450 per month. The potential for student loan payments to decrease STR demand is substantial.
STR operators are beginning to report weakness in sales. The slowdown in the STR market has led to the popularization of the phrase "Airbnbust." Some hosts have reported up to a 50% decline in monthly revenues. To be clear, Airbnb continues to earn strong revenues and overall bookings are up. But competition has increased causing occupancy rates to drop which is prompting some hosts to lower their rates.
Cities have also taken notice about the impact of STR on the affordability and quality of life in their neighborhood. Many of which have begun to implement new ordinance to limit or ban STR operations. Governments are also considering new taxes on STRs, including California which is considering a 15% tax on STRs. This has the potential to add a new expense that was not factored into by investors when they purchased their property.
For all of these reasons, some hosts are deciding to convert to long term rental property or sell their property. This is adding to negative flow.
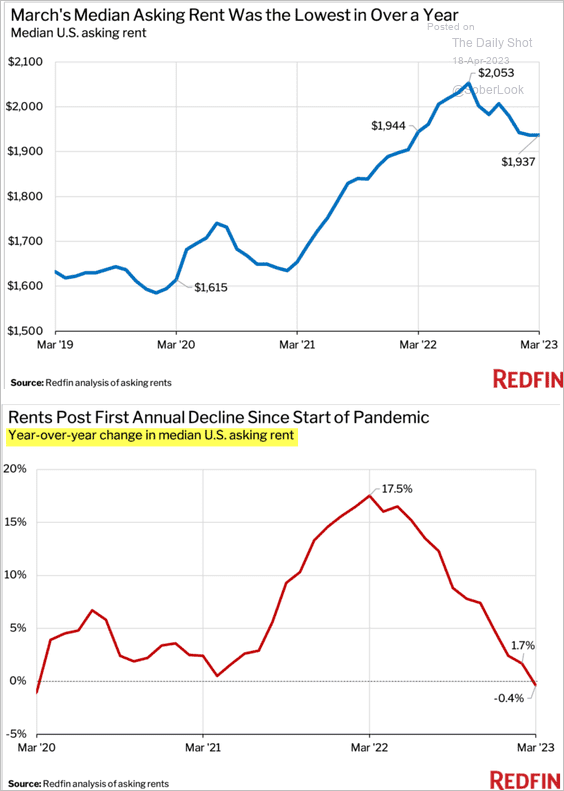
Rent Deflation
STRs are not the only investment properties experiencing declines in revenue, as rental property is also seeing decreased prices. Redfin reported that the median asking rent in March 2023 was down -0.4% YoY. But according to Redfin, buying a home costs about 25% more than renting on average in the U.S. today. This is because the median renter in the U.S. can only afford 34% of the homes for sale in Q1 2023, compared to 45% in 2022. This is as the median monthly mortgage payment to buy a home has risen to an all time high of $2,651 while the average cost of rent is $1,850.
The Daily Shot (used with permission)
Partly, rents are falling because renters are tapped out. Moody's reports that the average American is spending about 30% of their income on rent which is the highest in 20 years and higher than 2020 when it was 25.7%. Balance is being restored in the housing market as speculation and exuberance is becoming tempered as a result of higher mortgage payments and a stall in home price appreciation. In addition, eviction rates are rising since the end of eviction moratoriums. Some jurisdictions, such as Maricopa County, are already experiencing eviction rates that exceed the pre-2020 mean, likely a result of pent-up filings.
Like homebuilders, rental owners are trying to stave off price deflation. The number of incentive offers are climbing with many apartments and rentals offering 1-3 months rent-free for a 12-13 month lease. Rental owners are not required to disclose this type of expense to lenders when qualifying for the mortgage.
Renters are sensing that it is less expensive to rent than buy at present. Home prices have appreciated much faster than the cost of rent since 2020. The same phenomenon occurred in 2006-07. This is not a result of housing shortages but a shift in consumer sentiment that strongly favors buying over renting. After the housing bust in 2008 home prices returned to equilibrium with rents and we expect that to occur again. This implies a decline in home prices of 15-20%. In addition to lower monthly payments, renters also have the ability to use their saved down payment to earn interest in money market funds or U.S. Treasuries of 5%+. This income helps to offset the cost of renting. A 20% down payment on a $500,000 house can earn $5,000 a year in Treasury interest today. This could be 20% or more of the cost to rent, making the opportunity cost of buying considerable.
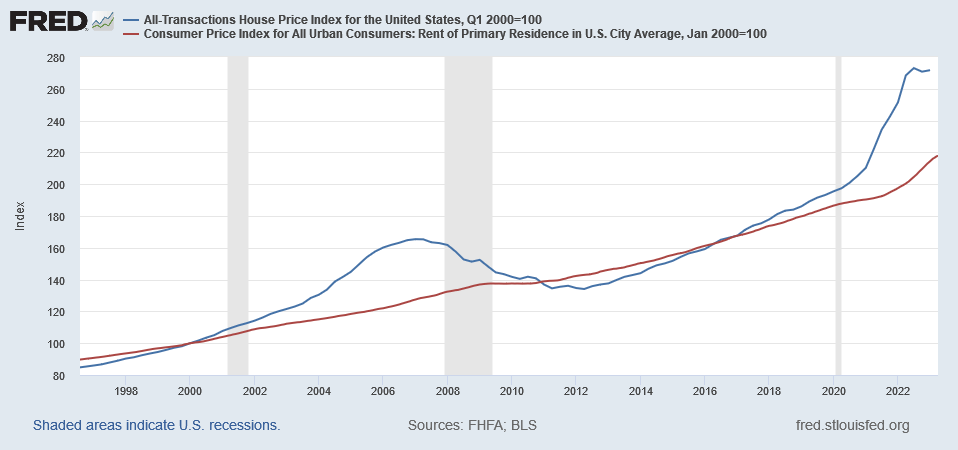
Federal Reserve Economic Data | FRED | St. Louis Fed
There is a real threat that many rental investors were forecasting specific rental income and income growth to service their debt payments. If rents continue to decline, some rental owners may have trouble servicing those debts. As STR operators experience trouble with weak demand, many of these will transition to long term rentals or list on the market which adds competition to rentals further pressuring rents.
Second Homes, Remote Work, and Unemployment
Low mortgage rates also prompted homeowners to buy second homes. For some, the ability to work remotely allowed them to buy a home somewhere desirable but they kept their original home. Through 2020, approximately 15% of home sales were for second homes. At the time, second homes accounted for 5.5% of all homes, demonstrating a surge in demand. Today, mortgage rate locks for second homes are 52% below pre-2020 levels after being 89% above pre-2020 levels in 2020, suggesting a pull-forward of demand.
This return to normal for second home sales reduces positive flow in the market. If a significant number of second home owners decide to sell their extra home this could turn into negative flow for the market. With ultra low interest rates it would require significant economic distress to convince them to do that. Such economic stress would need to come as a result of rising unemployment.
So far, unemployment has not materially degraded since its recovery post pandemic. The U.S. unemployment rate stands at 3.7% which is only marginally off the lows of 3.5%. However, signs are beginning to show that employment may be due for weakness. First, permanent job loses as a YoY change has started to rise materially. Each of the last three major recessions were preceded by a material rise in permanent job losses.
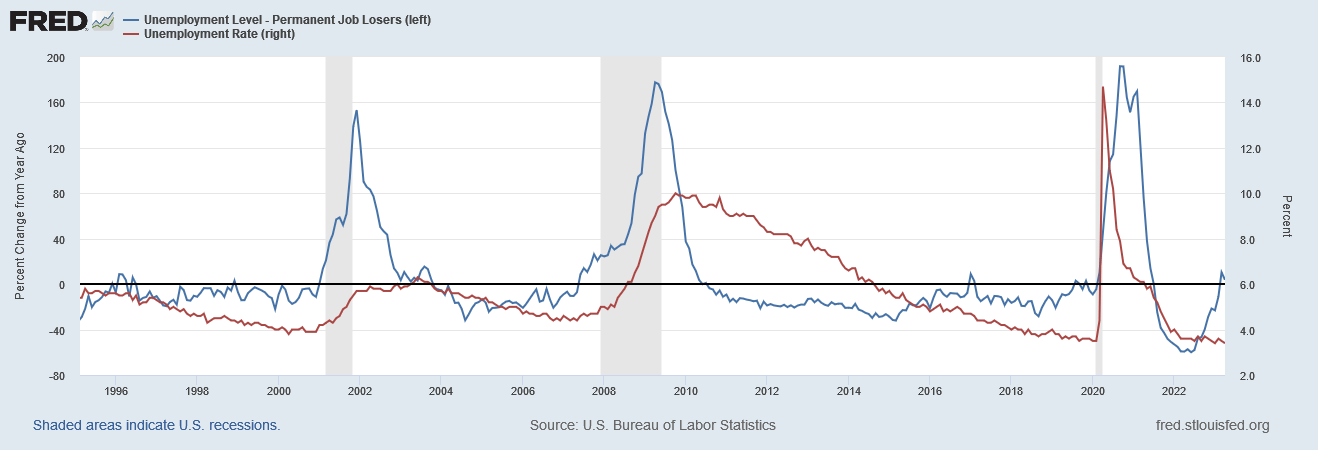
Federal Reserve Economic Data | FRED | St. Louis Fed
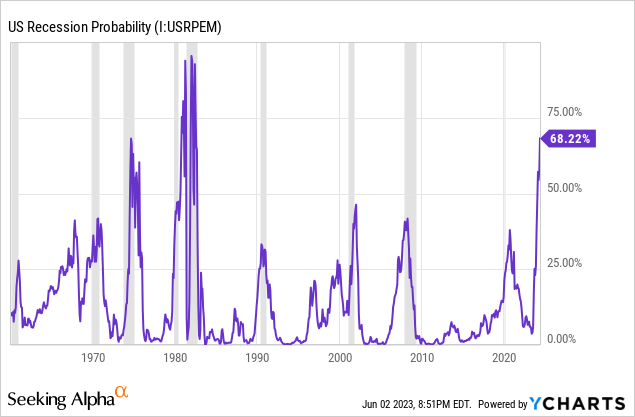
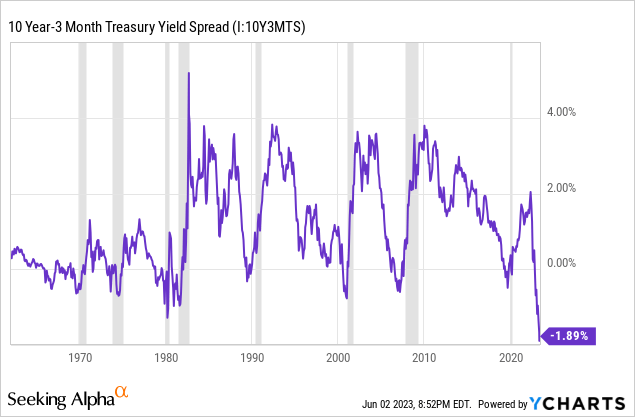
There are numerous other leading indicators that suggest that employment is due for weakness. We cover them in detail in our other publications. Three important indicators are below. These include the Conference Board US Leading Index, US recession probability, and the 10Y-3M yield curve. Each of these indicators are pointing toward a recession. With recession we expect job losses.
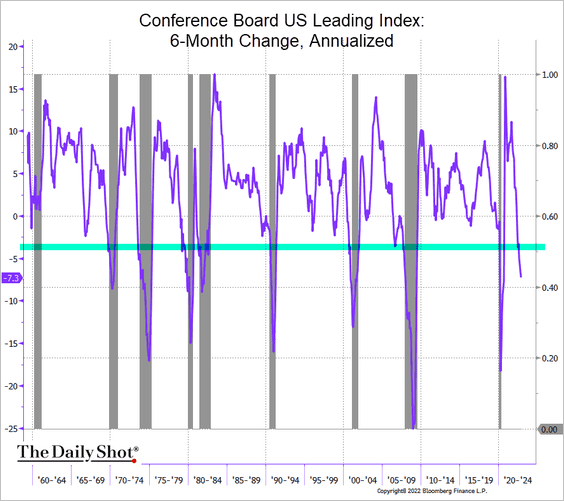
The Daily Shot (used with permission)
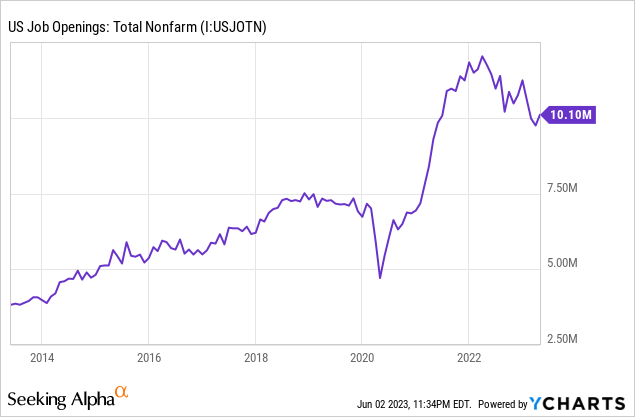
For now, employment remains robust with over 10 million job openings. Despite this, US BLS data shows that the average hours worked in May 2023 was 34.3 which is lower than April at 34.4 and lower than March 2022 at 34.6. This decline in hours worked, although small by appearance, is actually substantive because employers are always more apt to cut hours before they cut employees because it costs less and is easier to reverse.
If employment materially weakens it will accelerate the pace of "return to the office." The rate of remote work has seemed to peak in 2022. The percent of employees that are fully remote has declined from 17% in January 2022 to 11% today. As this trend unwinds, it will relieve the pressure on highly desirable areas, including rural and suburban neighborhoods.
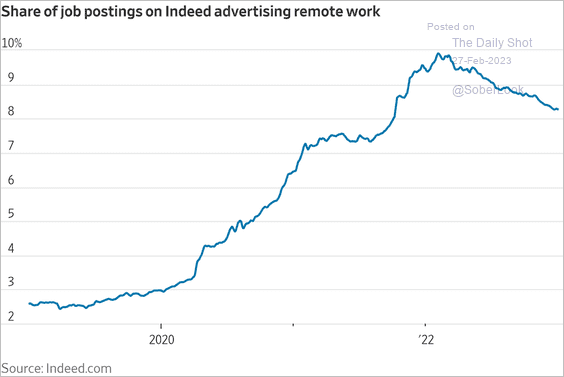
The Daily Shot (used with permission)
Summary
The 2008 housing crash was preceded by excessively loose monetary policy, a frenzy in housing speculation, and irresponsible financing leading to a crash. Today, we have experienced excessive loose monetary policy, a frenzy in housing speculation, and questionable financing practices. What is different about the housing market today is that more mortgages are fixed rate, vacancy rates are lower, inventory is tighter, lending practices are stricter, and housing and vacation preferences are different.
But the most significant difference is the money. Below is the average price per square foot of housing in the U.S. compared to the M2 money stock. Only recently has the growth in cost per square foot exceeded the growth in M2, which is now negative. The divergence suggests that the cost per square foot could decline from $225 to $205 to align with M2, a 9% decline.
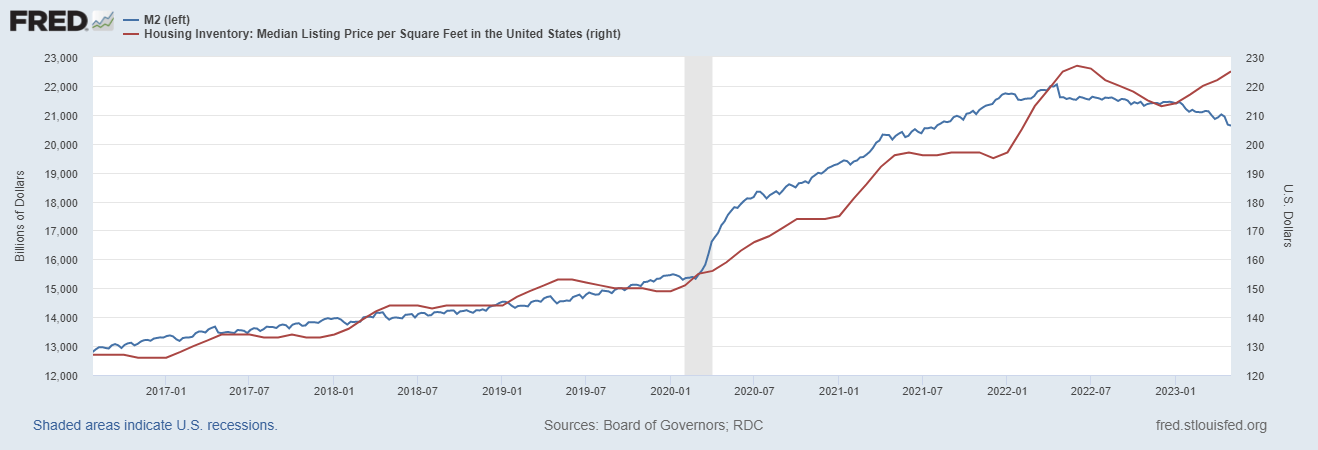
Federal Reserve Economic Data | FRED | St. Louis Fed
There is still a lot more money in existence today than pre-2020. This inflation sets a floor for home prices. Still, there are many indications that homes are too expensive. For the first time since 2007, the share of the U.S. workforce that works as realtors has declined, from 0.97% to 0.93%. Homebuilder margins are elevated and can decline just to reach their normal range. The level of interest in real estate investing is fever pitched and the idea that home prices only go up is cemented. This is primarily why home prices began to rebound in Q1 2023 as buyers began to expect future interest rate cuts and began to front-run the Fed by buying in now before prices moved higher.
A year ago we described the U.S. housing market as a "dead man walking." We used this analogy because everything seemed to be fine with the market but we could see that something wasn't healthy. After this period of discovery we have found that the housing market has run out of steam. In Q1 2023, the median sales price for houses sold in the U.S. declined at an annualized rate of -37%. This is faster than 2009 when it maxed at -26%.
What happens next depends on how far the U.S. enters into recession. Our bearish case scenario would involve a single digit rise in unemployment, a strong contraction in STR demand, numerous STR operators failing to service their debt payments, the rental market becoming saturated with new construction and STR conversions, and multitudes of home sellers forced or opting to sell their second home and investment properties, many of which are underwater. Our base case scenario is a milder version of this with home prices easing to the point that affordability equilibrates. Of the three factors identified in our introduction, we believe that home price decreases and household income increases will work together to improve affordability. It is our expectation that U.S. home prices, as an aggregate, will decline by single digits in 2023 and single digits again in 2024. After which it will depend on monetary and fiscal policy.
This article was written by

Analyst’s Disclosure: I/we have no stock, option or similar derivative position in any of the companies mentioned, and no plans to initiate any such positions within the next 72 hours. I wrote this article myself, and it expresses my own opinions. I am not receiving compensation for it (other than from Seeking Alpha). I have no business relationship with any company whose stock is mentioned in this article.
The content in this article is for informational, educational, and entertainment purposes only. This content is not investment advice and individuals should conduct their own due diligence before investing. The author is not an investment advisor, is not registered as a financial advisor, and is not suggesting any investment recommendations. This article is not an investment research report but a reflection of the author’s opinion and own investment decisions based on the author’s best judgement at the time of writing and are subject to change without notice. The author does not provide personal or individualized investment advice or information tailored to the needs of any particular reader. Readers are responsible for their own investment decisions and should consult with their financial advisor before making any investment decisions. No statement or expression of opinion, or any other matter herein, directly or indirectly, is an offer or the solicitation of an offer to buy or sell the securities or financial instruments mentioned. Any projections, market outlooks, or estimates herein are forward looking statements based upon certain assumptions that should not be construed as indicative of actual events that will occur. Any analysis presented is based on incomplete information, and is limited in scope and accuracy. The information and data in this article are obtained from sources believed to be reliable, but their accuracy and completeness are not guaranteed. The author expressly disclaims all liability for errors and omissions in the service and for the use or interpretation by others of information contained herein.
Seeking Alpha's Disclosure: Past performance is no guarantee of future results. No recommendation or advice is being given as to whether any investment is suitable for a particular investor. Any views or opinions expressed above may not reflect those of Seeking Alpha as a whole. Seeking Alpha is not a licensed securities dealer, broker or US investment adviser or investment bank. Our analysts are third party authors that include both professional investors and individual investors who may not be licensed or certified by any institute or regulatory body.