VIOV: Not The Best ETF To Bet On Value

Summary
- Vanguard S&P Small-Cap 600 Value ETF holds over 400 small caps selected and weighted with value and growth metrics.
- It is well-diversified across sectors and holdings.
- It has failed to bring excess return over its parent index in the long term.
- Two ETFs with the same underlying index have higher trading volumes.
- Quantitative Risk & Value members get exclusive access to our real-world portfolio. See all our investments here »
Vladimir Zakharov
This article series aims at evaluating ETFs (exchange-traded funds) regarding the relative past performance of their strategies and metrics of their current portfolios. Reviews with updated data are posted when necessary.
VIOV strategy and portfolio
Vanguard S&P Small-Cap 600 Value Index Fund (NYSEARCA:VIOV) has been tracking the S&P SmallCap 600 Value Index since September 2010. It has 456 holdings, a 12-month trailing yield of 1.8% and a total expense ratio of 0.15%. It is a direct competitor of SPDR S&P 600 Small Cap Value ETF (SLYV) and iShares S&P Small Cap 600 Value ETF (IJS), which track the same underlying index and have similar expense ratios. SLYV and IJS are older: they were launched in 2000. They are also more liquid and have more assets under management.
As described in the prospectus by S&P Dow Jones Indices, S&P 600 constituents are ranked in value and growth styles using three valuation ratios and three growth metrics. The valuation ratios are book value to price, earnings to price and sales to price. By construction, 33% of the parent index constituents exclusively belongs to each style, and 34% belongs to both styles. The Value subset serves as S&P 600 Value Index and is rebalanced annually. It is capital-weighted, with an adjustment for constituents belonging to both styles. For example, a company with a value rank better than its growth rank is given a larger weight in the Value Index than in the Growth Index.
The next table compares valuation ratios of VIOV, its parent index S&P SmallCap 600 represented by iShares Core S&P Small-Cap ETF (IJR), and a competitor with a different underlying index: iShares Russell 2000 Value ETF (IWN). As expected, VIOV is cheaper than its parent index, but the difference is not spectacular. The comparison with the Russell 2000 Value Index is mixed: VIOV is cheaper regarding price/sales, significantly more expensive in price/earnings, and tie in price/book and price/cash flow.
VIOV | IJR | IWN | |
Price/Earnings TTM | 11.2 | 11.81 | 9.41 |
Price/Book | 1.24 | 1.61 | 1.24 |
Price/Sales | 0.6 | 0.85 | 0.85 |
Price/Cash Flow | 7.01 | 8.42 | 7.01 |
Source: Fidelity
The heaviest sectors are consumer discretionary (19.7%), financials (18%), industrials (15.9%) and real estate (11.1%). Other sectors are below 9%. Compared to the S&P 600 index, VIOV significantly overweights consumer discretionary and real estate. It underweights mostly technology and healthcare.
Sector breakdown (chart: author; data: Vanguard, iShares)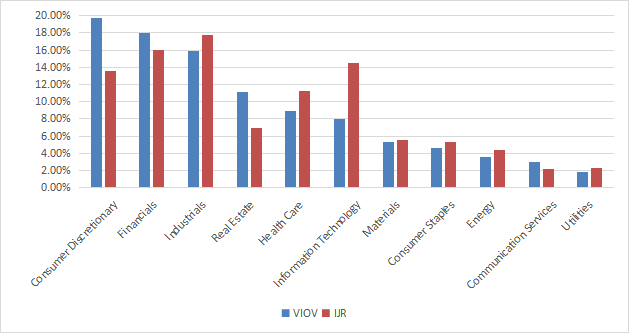
The portfolio is well-diversified: the top 10 holdings represent only 8% of asset value. The next table lists them with their weights and valuation ratios. The heaviest one weighs about 1%, so risks related to individual companies are low.
Ticker | Name | Weight | P/E ttm | P/E fwd | P/Sales | P/Book | P/FCF | Yield% |
Meritage Homes Corp. | 1.06% | 5.03 | 8.08 | 0.73 | 1.12 | 9.56 | 0.88 | |
Radian Group Inc. | 0.86% | 6.02 | 8.23 | 3.49 | 1.03 | 18.00 | 3.44 | |
Insight Enterprises, Inc. | 0.83% | 18.32 | 13.89 | 0.50 | 3.24 | 10.44 | 0 | |
Essential Properties Realty Trust, Inc. | 0.80% | 22.86 | 24.47 | 11.91 | 1.37 | N/A | 4.49 | |
John Bean Technologies Corp. | 0.78% | 28.49 | 21.67 | 1.67 | 4.18 | 113.17 | 0.34 | |
Signet Jewelers Ltd. | 0.75% | 10.89 | 5.89 | 0.46 | 2.29 | 6.13 | 1.41 | |
Group 1 Automotive, Inc. | 0.74% | 5.06 | 5.64 | 0.20 | 1.38 | 10.83 | 0.77 | |
Avista Corp. | 0.73% | 22.50 | 17.89 | 1.82 | 1.31 | N/A | 4.43 | |
Select Medical Holdings Corp. | 0.72% | 20.28 | 15.21 | 0.55 | 2.99 | 54.83 | 1.75 | |
Rogers Corp. | 0.68% | 30.70 | 36.96 | 3.02 | 2.48 | 72.85 | 0 |
Ratios: Portfolio123
Remember VIOV and IJS have the same underlying index. Since VIOV inception (09/07/2010), they have similar annualized returns (10.91% vs 10.82%). I will use IJS to assess the underlying index on a longer period.
Since 08/1/2000, the S&P 600 Value Index is very close to the broader S&P 600 in performance and risk metrics.
since 8/1/2000 | Total Return | Annual Return | Drawdown | Sharpe ratio | Volatility |
S&P 600 Value Index (IJS) | 640.40% | 9.16% | -59.83% | 0.43 | 21.11% |
S&P 600 Index (IJR) | 636.64% | 9.14% | -58.15% | 0.44 | 19.44% |
Data calculated with Portfolio123
The next chart compares the 12-month total returns of VIOV and four other small cap value funds:
- Vanguard Small Cap Value ETF (VBR), reviewed here
- iShares Russell 2000 Value ETF (IWN), reviewed here
- Avantis U.S. Small Cap Value ETF (AVUV), reviewed here
- Dimensional US Small Cap Value ETF (DFSV)
AVUV and DFSV are actively managed, whereas VBR and IWN track different indexes.
VIOV vs competitors, last 12 months (Seeking Alpha)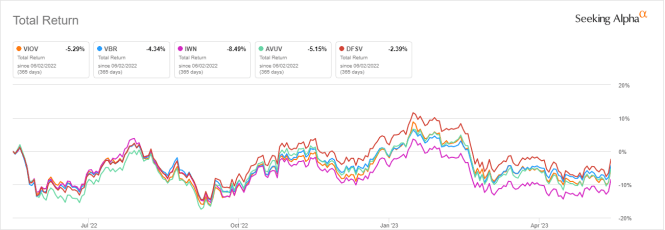
VIOV is second to last and almost tie to AVUV. However, all funds are in a tight range.
Comparison with my Dashboard List model
The Dashboard List is a list of 60 to 80 stocks in the S&P 1500 index, updated every month based on a simple quantitative methodology. All stocks in the Dashboard List are cheaper than their respective industry median in Price/Earnings, Price/Sales and Price/Free Cash Flow. An exception in utilities: the Price/Free Cash Flow is not taken into account to avoid some inconsistencies. Then, the 10 eligible companies with the highest Return on Equity in every sector are kept in the list. Some sectors are grouped together: energy with materials, communication with technology. Real estate is excluded because these valuation metrics don't work well in this sector. I have been updating the Dashboard List every month on Seeking Alpha since December 2015, first in free-access articles, then in Quantitative Risk & Value.
The next table compares VIOV underlying index since 8/1/2000 with the Dashboard List model, with a tweak: here, the list is reconstituted once a year to make it comparable with a passive index.
since 8/1/2000 | Annual Return | Drawdown | Sharpe ratio | Volatility | |
S&P 600 Value Index (IJS) | 640.40% | 9.16% | -59.83% | 0.43 | 21.11% |
Dashboard List (annual) | 1154.08% | 11.71% | -57.64% | 0.62 | 17.19% |
Past performance is not a guarantee of future returns. Data Source: Portfolio123
The Dashboard List outperforms the S&P 600 Value Index by 2.5% in annualized return and has slightly better risk metrics (drawdown and volatility). A note of caution: IJS price history is real, whereas the model simulation is hypothetical.
Two weaknesses of value indexes
I like the idea of mixing various ratios to rank value stocks. However, I think most value indexes doing so have two weaknesses, and IJS no exception. The first one is to classify all stocks on the same criteria. It means the valuation ratios are considered comparable across sectors. Obviously, they are not: my monthly dashboard here shows how valuation and quality metrics may vary across sectors.
The second weakness comes from the price/book ratio (P/B), which adds some risk in the strategy. Historical data show that a large group of companies with low P/B has a higher probability to hold value traps than a same-size group with low price/earnings, price/sales or price/free cash flow. Statistically, such a group shows a higher volatility and deeper drawdowns. The next table shows the return and risk metrics of the cheapest quarter of the S&P 500 (i.e.125 stocks) measured in price/book, price/earnings, price/sales and price/free cash flow. The sets are reconstituted annually between 1/1/2000 and 1/1/2023 with elements in equal weight.
Annual Return | Drawdown | Sharpe ratio | Volatility | |
Cheapest quarter in P/B | 8.54% | -81.55% | 0.35 | 37.06% |
Cheapest quarter in P/E | 10.71% | -73.62% | 0.48 | 25.01% |
Cheapest quarter in P/S | 12.82% | -76.16% | 0.47 | 34.83% |
Cheapest quarter in P/FCF | 15.32% | -74.77% | 0.61 | 27.03% |
Data calculated with Portfolio123
This explains why I use P/FCF and not P/B in the Dashboard List model.
Takeaway
Vanguard S&P SmallCap 600 Value ETF holds over 400 small caps selected and weighted based on value and growth metrics. It is well-diversified across sectors and holdings. VIOV, IJS and SLYV have the same underlying index and they are equivalents for long-term investors. However, IJS and SLYV are better for tactical asset allocation and trading purposes, because they have higher trading volumes. Performance and risk metrics since 2000 are very close to the parent index S&P SmallCap 600. VIOV combines two of the three factors of the original Fama-French model: value and size. However, the strategy has failed to bring excess return over its parent index on the long term. Like most value indexes, it has two weaknesses: ranking stocks regardless of their industries, and relying too much on the price/book ratio.
Quantitative Risk & Value (QRV) features data-driven strategies in stocks and closed-end funds outperforming their benchmarks since inception. Get started with a two-week free trial now.

This article was written by

Step up your investing experience: try Quantitative Risk & Value for free now (limited offer).
I am an individual investor and an IT professional, not a finance professional. My writings are data analysis and opinions, not investment advice. They may contain inaccurate information, despite all the effort I put in them. Readers are responsible for all consequences of using information included in my work, and are encouraged to do their own research from various sources.
Analyst’s Disclosure: I/we have no stock, option or similar derivative position in any of the companies mentioned, and no plans to initiate any such positions within the next 72 hours. I wrote this article myself, and it expresses my own opinions. I am not receiving compensation for it (other than from Seeking Alpha). I have no business relationship with any company whose stock is mentioned in this article.
Seeking Alpha's Disclosure: Past performance is no guarantee of future results. No recommendation or advice is being given as to whether any investment is suitable for a particular investor. Any views or opinions expressed above may not reflect those of Seeking Alpha as a whole. Seeking Alpha is not a licensed securities dealer, broker or US investment adviser or investment bank. Our analysts are third party authors that include both professional investors and individual investors who may not be licensed or certified by any institute or regulatory body.