Week On Wall Street: A Time To Be Selective

Summary
- This is not a market where all boats are being lifted. It's Tech or nothing.
- Price is the final arbiter in making near-term decisions.
- Don't "assume" the Fed is about to leave the scene. The latest inflation report keeps them engaged.
- Global manufacturing is bifurcated. The rebound in Eurozone PMIs fizzles with data back in contraction, while Asia rebounds into expansion.
- Looking for a helping hand in the market? Members of The Savvy Investor get exclusive ideas and guidance to navigate any climate. Learn More »
Kelvin Murray
"If you are going through hell, keep going. But please stop screaming; it's bad for morale." - Winston Churchill
The U.S. economy continues to present a rather uneven performance. While some of the data have been looking relatively strong, there is no getting around the fact that many of the recent numbers have revealed an economy and financial system that is under stress.
The yield curve is still a mess - with short-term yields running above longer-term yields. We know when that occurs it is a pretty good indication that a recession is around the corner. The problem is determining the 'lead' time, as it has been a variable throughout history. There is plenty of sarcasm today labeling this as the most forecasted recession in history.
We aren't hearing that much about it but there is little doubt that businesses and consumers are facing headwinds. However, many economists point to the fact that some indicators are telling us we are nowhere near recession, and one isn't 'imminent". Then there are those that still believe in the "soft landing" scenario. They point to liquidity in the system, real estate values remain quite high and jobs are plentiful. All of that has encouraged households to continue on their merry way using debt to finance the next big purchase or trip. The way we have seen stocks march higher, there seems to be some disconnect between expectations and what is happening in the real world. That isn't so unusual. At times investors look at the glass being half full keeping the shorter-term approach positive, while in my view, the longer-term situation remains a BIG question mark.
We've covered all of the issues the economy and market face down the road to the point of exhaustion, so today we'll focus our energy more on the near term. Price is always the final arbiter. Markets have been frustrating lately and there are many reasons investors, analysts, and economists remain confused. It's the reason why there are so many different forecasts out there today.
Poor breadth - In fact, it's in territory associated with BEAR markets - But the indices have NOT declined.
Major Indices are not aligned - Only two up (S&P 500 - NASDAQ)
Recently range bound (S&P 4050 - 4200)
Unless an investor wants to guess what comes next, this all adds up to a cautious outlook. In range-bound markets, normally the initial move is false, adding more caution.
Therefore, while the S&P 500 and NAASDAQ/NASDAQ 100 can still move higher, the DJIA and Small caps (IWM) are less clear on their path. It's rather obvious that this isn't a "rising tide that lifts all boat market", and why I'm not inclined to announce a NEW BULL market now.
Therefore we go back to the original point - Price is the Final Arbiter, and we must also acknowledge that this bifurcated market can last a while longer. Narrow breadth can be more indicative of a market not quite ready for a sustainable climb higher, due to the vast uncertainty and mixed signals on the economic outlook. However, momentum in these large-cap growth names can continue for a while. In a slow growth environment, investors are concentrated in areas of the market that possess growth. We've seen this before in the days of FANG being the only game in town. This time around it's been expanded to FAANG+ and anything "AI" but the same principle applies. A boatload of money chasing a few stocks.
The Fed's Tightening Cycle
Chair Powell opened the door for a pause at the Fed's June policy meeting without fully conceding that the Fed is done with its tightening cycle. However, there seem to be diverging opinions, with some officials hinting they are leaning toward a wait-and-see approach after the 500 basis points of tightening, particularly in light of the recent banking sector stresses, while others suggest more rate hikes are needed to see more progress on inflation. That leaves investors with an undecided Fed as we move closer to the June FOMC meeting.
But the one area where policymakers' comments are consistent is that they universally agree that it is too early to discuss rate cuts. Richmond Federal Reserve President Barkin noted that Fed officials do not want to repeat the mistake of the 1970s and ease interest rates too soon and risk a reacceleration in inflation. While the Fed remains concerned about sticky core inflation, which has teetered around 5.5% for the past five months, economists are still in the camp where inflation is expected to fall sharply on a year-over-year basis in the next few months.
That is all well and good, but my opinion remains that with the improving inflation dynamics on the horizon, Fed officials will likely tread carefully to not reignite the 'animal spirits' of inflation. The job market continues to hold up better than expected, bolstering growth, and the housing market is showing signs of stabilizing. Especially when we consider the message from the housing stocks which telegraphs the worst is definitely behind us.
With inflation and economic growth still humming along at relatively strong levels, it is no wonder that the Fed funds futures have been quietly starting to price in a rate hike at the mid-June FOMC meeting. Not so long ago, the odds of such a rate hike were close to zero. Now traders have priced in a likelihood of 40% that the FOMC will hike rates next month. Bottom line, I was ready to fold my cards and reluctantly move to the camp where the Fed is likely done for now. However, the latest stronger-than-expected inflation report gets me right back to where I was. Even if we do get a Fed "pause", I wouldn't rule out more rate increases later in the year if the inflation data remains stubborn. As I have said the entire year, regardless of any of this I do not see rate cuts in 23.
The bond market's pricing rate cuts are premature. It's important to remember that we have not seen the full effects of Fed tightening yet. I continue to hear investors, analysts, and economists moaning about the Fed's aggressive 500 basis point rate increases in the past year and its ill effects on the economy. Exactly what did they expect the Fed to do with inflation at 40-year highs (9%)? Runaway inflation destroys economies. Some have very short or selective memories.
Because of the lag effect of the rate hikes, many of the robust economic forecasts and the calls for a quick revival on the corporate earnings scene might be a bit too aggressive. Another reason that a sharp rebound is a low probability; while it's still early to conclude, jobless claims appear to be starting an uptrend.
Earnings and Valuation
We have been talking about the disparity in the market recently - here is another illustration showing the widening gap between the Big 7 and the rest of the market.
Big 7 (www.factset.com)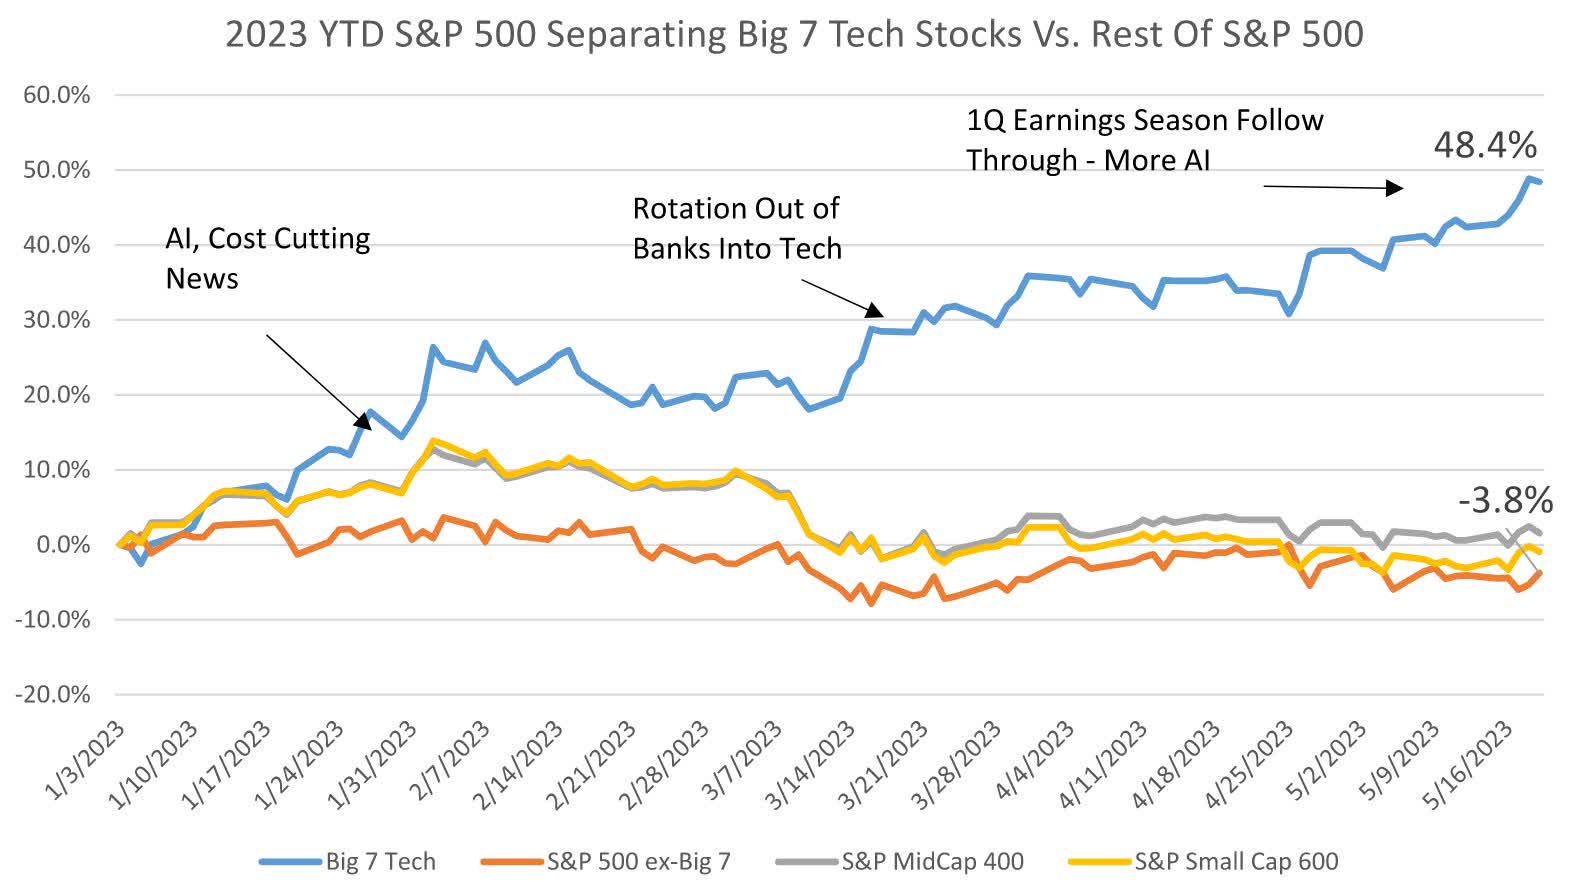
And P/Es across The Big 7 Tech companies, the rest of the S&P 500, and the Mid and Small Cap indexes tell the story of valuations across the vast majority of stocks being below post-Great Financial Crisis averages, and well below 2019 levels.
PE Big 7 (www.factset.com)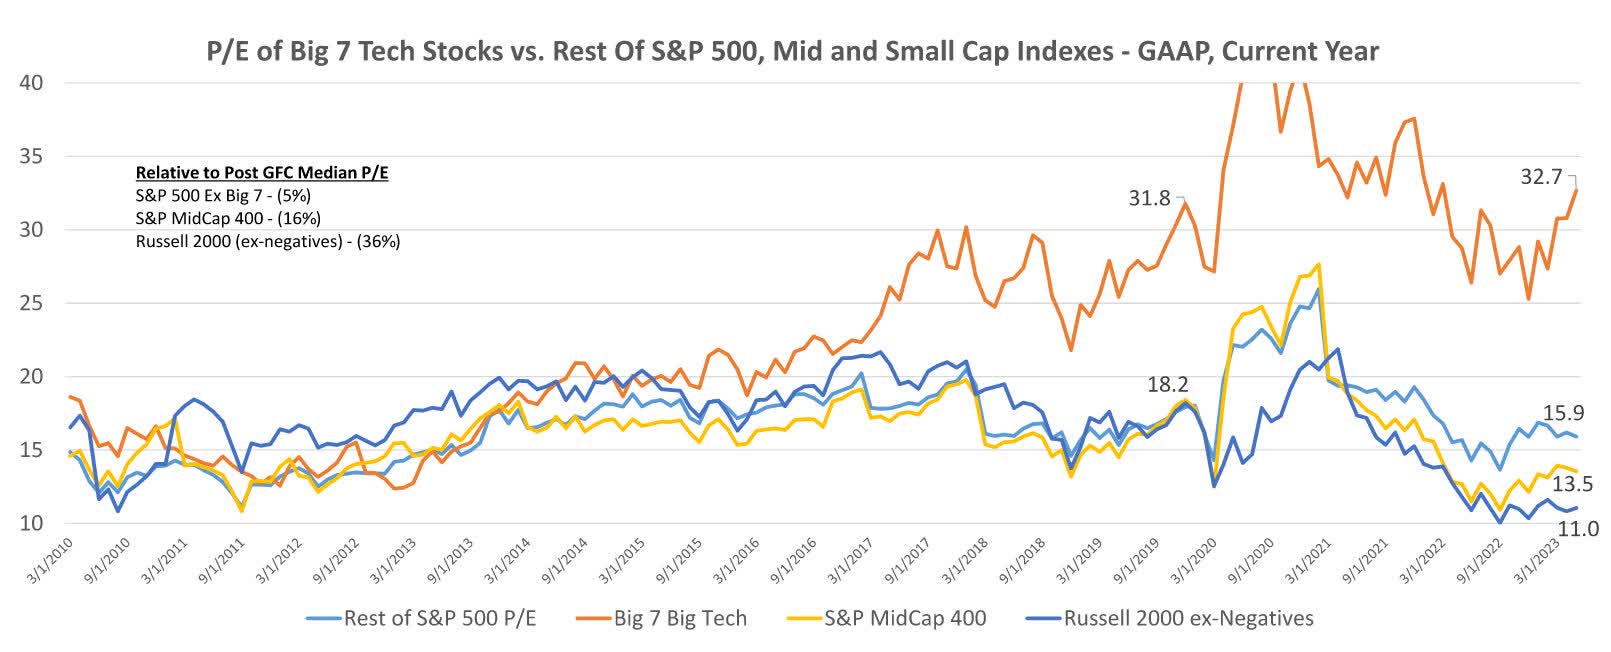
Bottom line; other than the BIG 7, the majority of the market is pricing in a recession. That makes this overall market picture very complex.
The Week On Wall Street
The shortened trading week saw the indices start off waffling between gains and losses. On Tuesday the S&P tested the upside boundaries before closing flat for the day. It was the opposite on Wednesday, as the index probed the downside before settling with a modest loss.
The entire scene changed on Thursday and the positive momentum continued into Friday. The S&P ended the trading week with a two-day gain totaling 2.4%.
All of the other major indices posted gains for the week.
Debt Ceiling
Other than the obvious - no US default- there isn't a lot for investors to be overly concerned about in the Debt Ceiling Package. The market impact of this deal is generally market positive. These were modest tweaks to existing legislation.
Cuts to non-defense discretionary spending. The deal caps non-defense discretionary spending for FY24 at $637 billion (basically flat) and FY25 budgetary growth to 1%; after 2025, the agreement implements multi-year, non-binding commitments to further cuts. Military spending will increase to $886 billion next year and $895 billion in 2025.
Energy: permitting reform and MVP approval
Work requirements for federal aid. The deal introduces new work requirements for the SNAP (food stamps) and other federal aid programs
Cuts to IRS funding. The bill cuts $21.4B in IRS funding. about 25% of the original allocation.
Ending of student loan repayment suspension. The deal requires the administration to resume collecting interest and federal student loan repayments as of August 30.
Executive PAYGO. The bill applies the House's pay-as-you-go (PAYGO) rule to executive actions, which requires new spending to be offset by new savings.
COVID-19 spending clawbacks. The bill claws back approximately $30 billion in unspent COVID-19 funding
The early reporting said the extreme "right" doesn't believe the bill went far enough, while the extreme "left" says it went too far. That says it's a neutral bill and is more than likely the reason it passed.
The Economy
U.S. consumer confidence declined 1.4 points to 102.3 in May (a 6-month low), though it was better than expected. Most of the slip was in the present situation index which fell to 148.6 from 151.8. The expectations component dipped to 71.5 from 71.7.
Employment
U.S. nonfarm payrolls surged 339k in May, considerably beating estimates. Also, April was revised up to a 294k (was 253k) gain, while March was boosted to 217k (was 165k) in March for a hefty 93k two-month revision. However, the guts of the report were not so strong. The unemployment rate jumped, climbing to 3.7% from 3.4%, and is the highest since February 2022.
Average hourly earnings were up 0.3% from 0.4% with the annual rate sliding to 4.3% year over year from 4.4% y/y which is the weakest since June 2021. The workweek fell to 34.3 hours from 34.4 and is the weakest since April 2020. The labor force participation rate was steady at 62.6%.
JOLTS: openings rose 358k to 10,10k in April, hotter than expected, after dropping 229k to 9,74k in March and 589k to 9,97k in February. This breaks a string of three straight monthly declines. There were about 1.8 jobs available for unemployed seekers.
Manufacturing
US Manufacturing continues to falter, and those citing last month as the lows will have to rethink their assessment of this segment of the economy.
The Dallas Fed Manufacturing index declined another 5.7 ticks to -29.1 in May after dropping -7.7 points to -23.4 in April. This is the thirteenth straight month in contraction and is now at a 3-year low.
Chicago PMI dropped 8.2 points to 40.4 in May after rising 4.8 points to 48.6 in April. This is the lowest since 37.9 in November that was the weakest since 31.5 in May 2020.
The US Manufacturing Purchasing Managers' Index posted 48.4 in May, down from 50.2 in April, but broadly in line with the earlier released 'flash' estimate of 48.5. The latest figure indicated the fastest deterioration in operating conditions since February.
US PMI (www.pmi.spglobal.com/Public/Release/PressReleases)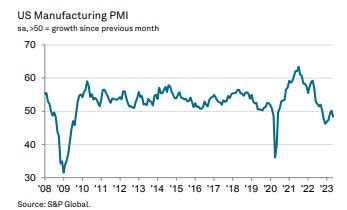
ISM manufacturing index dipped 0.2 ticks to 46.9 in May after bouncing 0.8 ticks to 47.1 in April. This is the seventh consecutive month in contraction (below 50), reflecting the gloom in manufacturing.
Construction spending bucked the trend surging 1.2% in April after rising 0.3% in March following a big upward revision in February to a 2.4% gain. This is much firmer than projected and the strength was broad-based.
The Global Scene
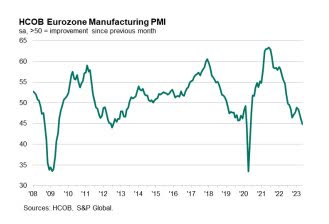
A bifurcated global Manufacturing scene. The rebound in the UK and Eurozone PMIs have been snuffed out, with a return to multi-month lows signaling contraction. In the meantime, Asia bounces back to expansion mode.
The seasonally adjusted UK Manufacturing Purchasing Managers' Index fell to a four-month low of 47.1 in May, down from 47.8 in April but above the flash estimate of 46.9. All of the PMI components (output, new orders, employment, stocks of purchases, and supplier lead times) signaled a deterioration in operating performance.
UK PMI (www.pmi.spglobal.com/Public/Release/PressReleases)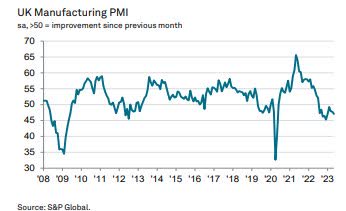
Euro PMI Data (www.pmi.spglobal.com/Public/Release/PressReleases) EU (www.pmi.spglobal.com/Public/Release/PressReleases) EU PMI (www.pmi.spglobal.com/Public/Release/PressReleases)
Canada follows the Eurozone into contraction.
The Canada Manufacturing Purchasing Managers' Index slipped below the crucial 50.0 no-change mark in May for the second time in the past three months. Posting 49.0, down from 50.2, the PMI was commensurate with a modest deterioration in operating conditions
Canada PMI (www.pmi.spglobal.com/Public/Release/PressReleases)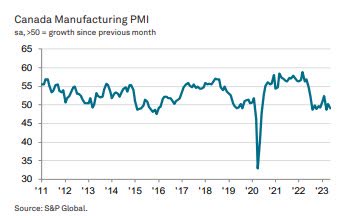
Chinese industrial profits continue to decline falling by over 25% versus April of last year.
China Ind. Profits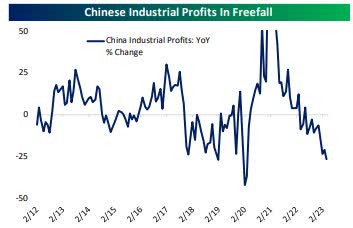
Commodities markets are screaming signals of collapsing Chinese economic activity.
Finally, some positive news from China Manufacturing, Asia moves into "expansion".
The headline Caixin China Manufacturing Purchasing Managers' Index picked up from 49.5 in April to 50.9 in May. Crucially, the latest reading was above the neutral 50.0 level to signal the first improvement in the health of the manufacturing sector since February. Though mild, the pace of improvement was stronger than the post-pandemic average.
China PMI (www.pmi.spglobal.com/Public/Release/PressReleases)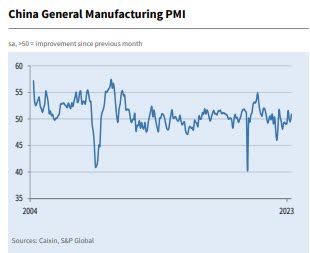
India continues to buck the deteriorating global trend.
The India Manufacturing Purchasing Managers' Index rose from 57.2 in April to 58.7 in May, indicating the strongest improvement in the health of the sector since October 2020.
India PMI (www.pmi.spglobal.com/Public/Release/PressReleases)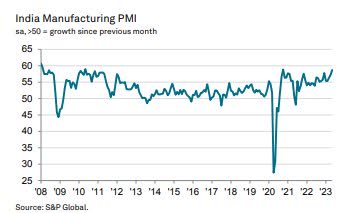
At 50.6 in May, up from 49.5 in April, the au Jibun Bank Japan Manufacturing Purchasing Managers' Index registered above the neutral 50.0 value for the first time since October 2022. The latest reading was broadly in line with the long-run series average (50.7) and signaled a modest overall improvement in operating conditions.
Japan PMI (www.pmi.spglobal.com/Public/Release/PressReleases)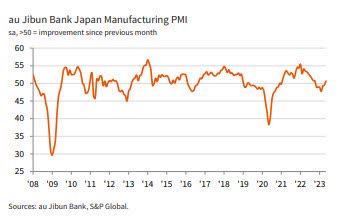
Food For Thought
West Virginian Senator Joe Manchin was promised passage of the Mountain Valley pipeline project when he went along with the "Inflation Reduction Act" that was passed last year. Mr. Manchin got nothing from the promises, but in an ironic twist of fate, both he and the US will get this pipeline built as part of the Debt ceiling package that is about to become law.
The 304-mile pipeline has been stuck in legal and regulatory limbo for almost 10 years. The project will supply natural gas from Appalachia to the Southeast. Despite it being under construction and almost complete the final permitting process has been held up in the courts for years, now asking for the complete approval process to be redone.
The debt-ceiling legislation requires the U.S. Army Corps of Engineers to issue all necessary permits within 21 days and would exempt government approvals from judicial review. The D.C. Circuit Court of Appeals would have exclusive jurisdiction to hear legal challenges to this section of the bill. In congressional terms that is a rubber stamp.
Gas delivered by the pipeline would replace coal and free up gas supply in the South to be sent overseas. It is one small step, but perhaps it is the first in many that will slowly change the anti-growth mindset.
The Daily Chart of the S&P 500 (SPY)
The rally in the S&P this week put the 4200 level in the rearview mirror with a clear breakout to the upside.
S&P 500 (www.tc2000.com)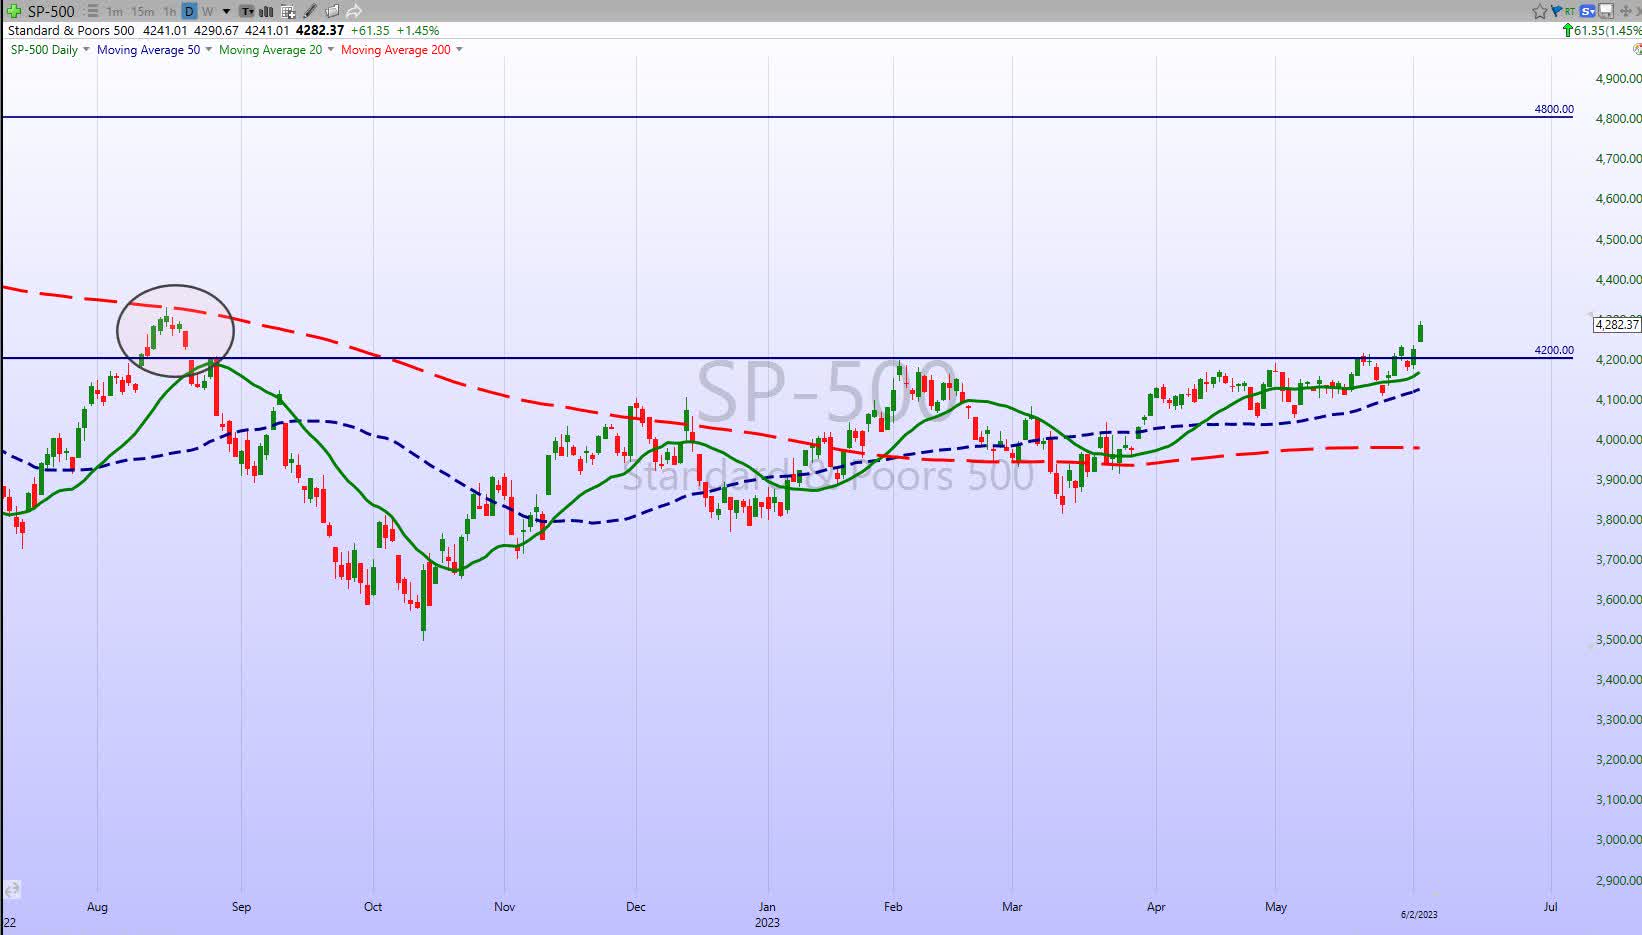
The August 2022 highs are now the next target zone for the BULLS but they do not want to see a replay of what occurred back then. That rally turned out to be a false move which resulted in the index heading down to set the October lows. There are a couple of subtle differences this time around that suggest this rally is different.
Investment Backdrop
Right on schedule, after weeks (months?) of a predominantly gloomy tone, the brief move above 4200 in the S&P 500 prompted a clear return of a more positive tone. When I look around I see talking heads telling investors that "things are much better than everyone thinks they are."
We've seen the commentary change from chanting "The market is weak and only a few stocks are responsible for all of the gains this year" to "This is a new bull market that is only getting started." Nvidia (NVDA) may have single handily revived the BULL argument. CNN's "Fear & Greed Index" is not a perfect measure of sentiment, but it is now firmly in "Greed" territory and just a few points away from "Extreme Greed."
For sure, there is nothing out there that resembles a "sell signal" yet, so the market appears primed to continue to drift higher in the near term. I will stress, however, that now the S&P 500 has entered that resistance zone centered around ~4300, it would not shock me to see a leveling off and a potential decline, but the Tech sector makes up 27% of the S&P, and adding the Communication Services sector (GOOG, META, NFLX) that increase to 35%. So unless this breakout reverses course quickly (LOW probability) pullbacks should be contained in the near term.
The characteristics of any subsequent drop - how swift it is, how many stocks participate, where support is found, etc. - will then provide clues as to how aggressive an investor can get. As I have written previously, there is the potential for a bullish resolution to all of this However, given the underlying economic issues and the technical resistance present, I will need to see the equity market prove it to me before I can get overly aggressive on equities. If the market is going significantly higher, there will be plenty of opportunities to profit.
We are working with a different landscape. Investors now have a sector and sub-sector that have moved back into BULL market territory. The technology ETF (XLK), NASDAQ, NASDAQ 100, and Semiconductors (SOXX) are all back ABOVE their respective LT trend lines. Despite the question marks surrounding the economy and markets, THAT cannot be DISMISSED.
I've said it a couple of times in the last week, chasing Energy (Value) like we did last year, is easier than chasing Tech (Growth). That is especially true when Growth sports a STRONG breakout and then is overbought in a couple of days. How you navigate this move will depend a lot on your overall risk profile. At the outset, I'm inclined to be more conservative. After the trend is firmly established it will be time to step up the aggressiveness. Sentiment and hype are driving the bus now.
As sure as I am writing this there will be pullbacks. When those pullbacks occur, and IF the breakout holds, it will be time to open the playbook, which will expand the opportunities.
A Bifurcated Market
Monthly Recap
May - "Sell in May and go away?" well that depends on what you sold. The Month came to a close this week and it will be known as the month the equity market split into two entities, the HAVE's and HAVE NOT's.
Savvy Investor - May (www.seekingalpha.com/account/research/custom_subscribe?slug=fear-greed-trader)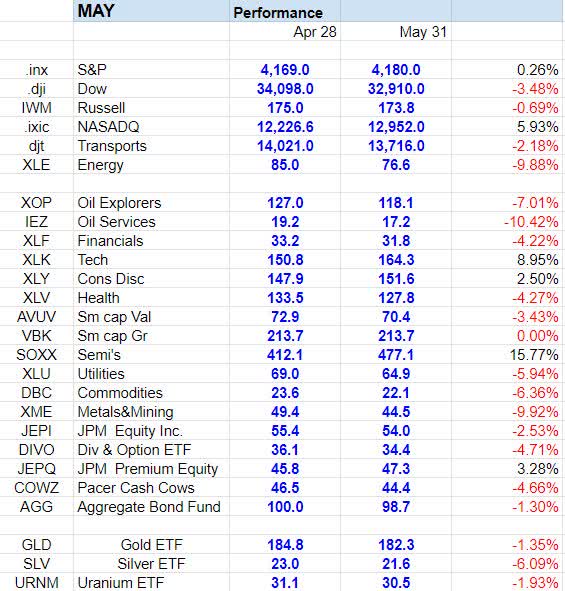
The NASDAQ, Technology sector (XLK), Consumer Discretionary (XLY), and the semiconductor sub-sector were the only groups posting a gain in the month. The S&P was flat and everything else lost ground. The DJIA snapped a two-month winning streak by losing 3.4% in May.
From Oil exploration to Oil services, Energy was weak across the board dropping 10%. In total, 8 of 11 sectors were in the red for the month, and it's why I have a hard time declaring this a new BULL market.
YTD Recap
At the end of April, all of the major indices were in the black for the year. The divergence in price action during May changed that scene. The DJIA and Russell are now modesty in the red. The NASDAQ added to its lead by adding 24%, with some of that gain coming at the expense of the DJIA which saw its 2.8% gain for the year evaporate.
Savvy Investor YTD (www.seekingalpha.com/account/research/custom_subscribe?slug=fear-greed-trader)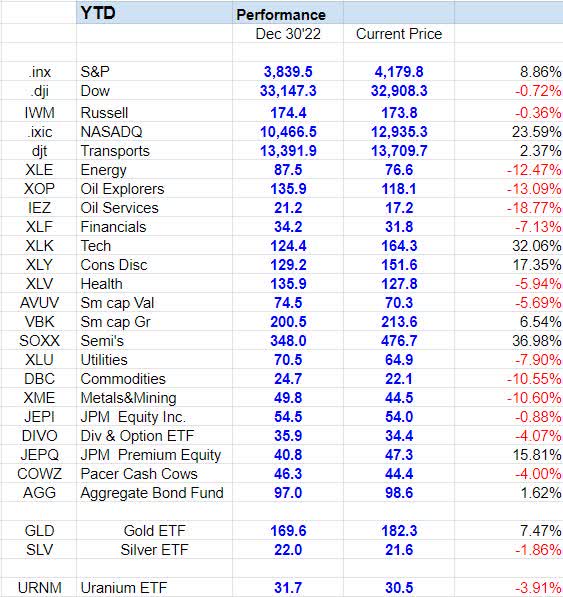
Small cap "Growth" extended its YTD gain at the expense of Small cap "value", which is now down 5.6% for the year. After rocketing to a 25% gain in the first quarter, the semiconductors gave back 8% in April. The group came roaring back in May adding 18%, and is now up 37% for the year, leaving all other areas of the market in the dust.
Commodities weakened and are now down 10+% this year. Gold continues to hold on to a 7+% gain in '23.
Strategy
With the debt ceiling out of the way, there are no real catalysts other than inflation reports and the Fed's reaction to them. I recommend continuing to do what has been the best strategy this year. Make adjustments based on the balance of evidence and price action. I have not changed my view that the upside is limited. That doesn't mean there are no opportunities. Just the opposite because we are now dealing with two markets.
My focus has mostly been on finding opportunities with a momentum stock or two that offer decent setups. With tech now fitting that description the playing field has expanded. Pullbacks in these strong momentum names will be BUYING opportunities.
Small Caps
There is little change to this scene. The Russell 2000 as measured by IWM has not been participating in the "bull" mode that is present elsewhere. The small caps surged 3+% on Friday and perhaps there is a "catch-up" trade in the making.
Sectors
Consumer Discretionary
The sector (XLY) has now posted an impressive 17% gain in '23. That move has recouped about half of the 36% loss incurred last year, leaving the group in a longer-term BEAR market trend.
Communications Services
This sector (XLC) which is buoyed by Amazon (AMZN), Alphabet, and Meta Platforms, has now gained 31% this year. That's a pretty decent rebound after the 2022 decline of 38%. Amazon and Alphabet are part of my '23 favorites list.
Energy
Energy (XLE) was the clear leader last year but roles have reversed in '23. It's traded sideways with a lean to the downside this year. The latest slide which saw the ETF post a four-day losing streak was broken on Thursday. Friday saw a nice follow through which could not have come at a better time for the Energy BULLS. That rebound was sorely needed as the group was testing its longer-term BULL trend. I continue to maintain all of my exposure to the group.
Financials
The Large cap banks represented by the Financial ETF (XLF) have tried to rally but keep meeting selling pressure at resistance levels. The Financial ETF had struggled below all near-term trend lines, until Friday's 2.2% rally.
It's the same for the Regional Banks (KRE). The group rallied to overcome the first resistance and kept the momentum going with a 6+% rally on Friday.
The expected pause by the Fed has calmed the waters a bit for the banks. The near-term technical view has improved but the sector remains in a long term BEAR trend.
Commodities
Precious Metals were barely hanging on to their intermediate uptrend as the week began. Both Gold and Silver started the week strong, but that strength faded when they met resistance levels on Friday.
I do continue to find them interesting and think the potential upside is good enough to give them some more room to work. There is a chance that lows have now been made but I can also allow for one lower low in both Gold and Silver without really changing my sentiment toward them.
For those that want to get exposure to BOTH Gold and Silver, the Sprott Trust (CEF) will accomplish that.
Uranium has been a CORE holding for a while and it's been a sideways affair. Coming into this week it was off just under 3% for the year. A 7.8% rally this week changed that, leaving the Uranium ETF (URA) looking like it could break out and move higher.
Biotech
The Biotech ETF (XBI) remains resilient and finished the week with three straight days of gains. The ETF is still struggling to break the long-term resistance level, but the BEAR to BULL reversal pattern which began last July is in play.
Healthcare
Money was flowing out of anything that wasn't Tech related and the Healthcare group was no exception. The week began the same way the previous week ended. The group endured five straight days of selling before a late-week rally helped stabilize the Healthcare ETF (XLV). The group remains at the lower end of the recent trading range.
Technology
If anyone missed the big moves in some of the tech names and is loathe to chase that move. The AI and general market technology momentum won't fade overnight. While it's difficult to chase these stocks after their enormous gains, there is a way to be involved. I've developed a strategy that was recently introduced to members of my Savvy Investor marketplace service. The "RENT a STOCK" options strategy gets an investor involved with less risk, with the potential for above-average gains.
It's a worthwhile strategy to consider to add income to a portfolio. One CAVEAT. Use it as an add-on to your plan, and as with everything else in life follow the general rule - everything in moderation.
Semiconductors Sub-Sector
We've always known that Semiconductors (SOXX) play a key role in the markets. The index often acts as a leading indicator for the broader stock market. If that follows here, then how the SOXX behaves at this important juncture may go a long in deciding whether we're about to drop back lower or continue higher.
NVDA was the catalyst, but three other stocks in the semiconductor index were up over 10% during the rally, and more than a third of the index (11 stocks) moved up over 5% on the news.
For the year, it's a similar story. NVDA is the clear leader, but two-thirds of its components are outperforming the S&P 500 YTD and more than a third are up triple the rate of the S&P 500.
While the group is extended and nearing resistance, the breakout has to be respected. Despite all of the other noise that surrounds the economy and the market in general, this group and selective technology is a BUY on dips.
There are plenty of ways to play the technology surge-- but the one strategy I do not recommend now is the "CHASE" - These stocks will come back in. The pullbacks should be minimal because of the strength of this move. However, any stock that has broken out of a trading pattern is a candidate for purchase on PULLBACKS.
Final Thoughts
In the very near term, we are going to be looking at and talking about TWO distinctly different markets. It's the HAVE'S (Technology) and the HAVE NOT'S (just about everything else). When we talk about the "Market" we are going to have to distinguish which market we are referring to. There are huge discrepancies now between indices, sectors, and sub-sectors.
So if you are wondering why the better part of your portfolio is not doing much, that is the reason. The "HAVE'S" (Technology) dominate and the "HAVE NOT'S" flounder. There is of course the possibility that this scene can change, but until it does, I'll stay with the idea that this market still has to prove itself.
THANKS to all of the readers that contribute to this forum to make these articles a better experience for everyone.
Best of Luck to Everyone!
Members of the Savvy Investor Marketplace service get straightforward advice. We are about to get a NEAR TERM OPPORTUNITY that can make an investors' year.
My view is not based on emotions, gut feel, headlines, or some abstract economic theories; it is based on a cold, objective analysis of six major market factors - monetary, economic, valuation, sentiment, supply/demand, and momentum/internal/technical.
Now ask yourself a simple question;
"Why am I not participating in this type of information?
Graduate to the next level, please consider joining the Savvy Investor Marketplace service at a NEW reduced rate. This offer won't last long.
This article was written by

INDEPENDENT Financial Adviser / Professional Investor- with over 35 years of navigating the Stock market's "fear and greed" cycles that challenge the average investor. Investment strategies that combine Theory, Practice, and Experience to produce Portfolios focused on achieving positive returns. Last year I launched my Marketplace Service, "The SAVVY Investor", and it's been well received with positive reviews. I've been part of the SA family since 2013 and correctly called the bull market for over 8+ years now.
MORE IMPORTANTLY, I recognized the change to the BEAR MARKET trend in February '22.
Since then investors that followed my NEW ERA investment strategy have been able to survive and profit in this BEAR market. Winning advice that is well documented, helping investors to avoid the pitfalls and traps that wreak havoc on a portfolio with a focus on Income and Capital Preservation.
I manage the capital of only a handful of families and I see it as my number one job to protect their financial security. They don’t pay me to sell them investment products, beat an index, abandon true investing for mindless diversification or follow the Wall Street lemmings down the primrose path. I manage their money exactly as I manage my own so I don’t take any risk at all unless I strongly believe it is worth taking. I invite you to join the family of satisfied members and join the "SAVVY Investor".
Analyst’s Disclosure: I/we have a beneficial long position in the shares of EVERY STOCK/ETF IN THE SAVVY PLAYBOOK either through stock ownership, options, or other derivatives. I wrote this article myself, and it expresses my own opinions. I am not receiving compensation for it (other than from Seeking Alpha). I have no business relationship with any company whose stock is mentioned in this article.
Any claims made in this missive regarding specific Stocks/ ETFs and the performance contained in this report are fully documented in the Savvy Investor Service. My Equity Portfolio is positioned with certain positions Hedged. Select Index Inverse ETFs are in place. This article contains my views of the equity market, it reflects the strategy and positioning that is comfortable for me. ONLY MY CORE positions are exempt from sale today. Of course, that is subject to change, and may not be suited for everyone, as each individual situation is unique. Hopefully, it sparks ideas, adds some common sense to the intricate investing process, and makes investors feel calmer, putting them in control. The opinions rendered here, are just that – opinions – and along with positions can change at any time. As always I encourage readers to use common sense when it comes to managing any ideas that I decide to share with the community. Nowhere is it implied that any stock should be bought and put away until you expire. Periodic reviews are mandatory to adjust to changes in the macro backdrop that will take place over time. The goal of this article is to help you with your thought process based on the lessons I have learned over the last 35+ years. Although it would be nice, we can't expect to capture each and every short-term move.
Seeking Alpha's Disclosure: Past performance is no guarantee of future results. No recommendation or advice is being given as to whether any investment is suitable for a particular investor. Any views or opinions expressed above may not reflect those of Seeking Alpha as a whole. Seeking Alpha is not a licensed securities dealer, broker or US investment adviser or investment bank. Our analysts are third party authors that include both professional investors and individual investors who may not be licensed or certified by any institute or regulatory body.