Carlyle Secured Lending: Outperformance Continues While Dividend Coverage Grows For This 13%-Yielding BDC

Summary
- We discuss quarterly results from the BDC Carlyle Secured Lending and highlight key income dynamics of the portfolio.
- CGBD outperformed the sector once again as both the NAV and net income increased modestly.
- Non-accruals increased slightly though overall portfolio quality remained stable.
- We recently pared down our allocation to CGBD as its valuation improved strongly. Since then, valuation has weakened and we would consider adding more if this continues.
- Systematic Income members get exclusive access to our real-world portfolio. See all our investments here »
Darren415
This article was first released to Systematic Income subscribers and free trials on May 25.
In this article, we catch up on the Q1 results of Carlyle Secured Lending (NASDAQ:CGBD). Overall, the stock delivered a strong result with a 3.3% total NAV return, outperforming the sector once again. We recently downsized our large allocation to the stock on valuation grounds, after which it cheapened quite a bit. If this trend continues, we would look to upsize our position.
CGBD has a fairly typical BDC portfolio profile with an 80%+ first lien allocation. Its median company EBITDA of $73m is also in the sweet spot of the middle-market segment. Its sector exposure is tilted to Healthcare and Software - also fairly common in the BDC space.
Carlyle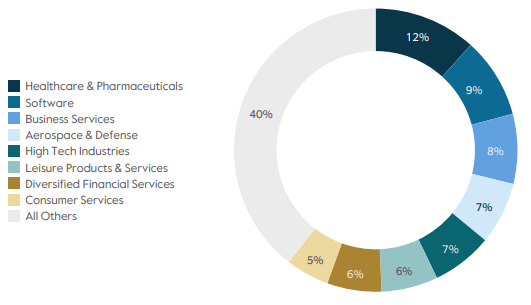
Quarter Update
Total investment income increased by 4% over Q1. The sharp jump in Q3-22 seen in the chart below was due to a one-off item coming back on accrual.
Systematic Income BDC Tool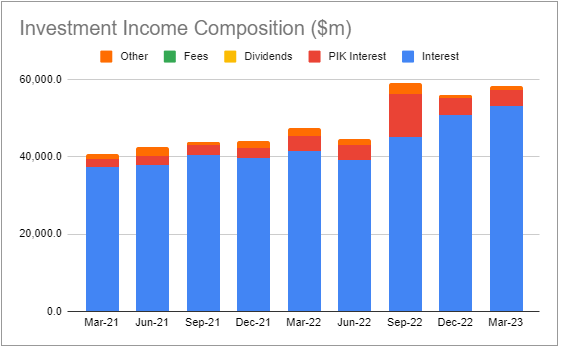
Net investment income also increased by 4% to $0.50.
Systematic Income BDC Tool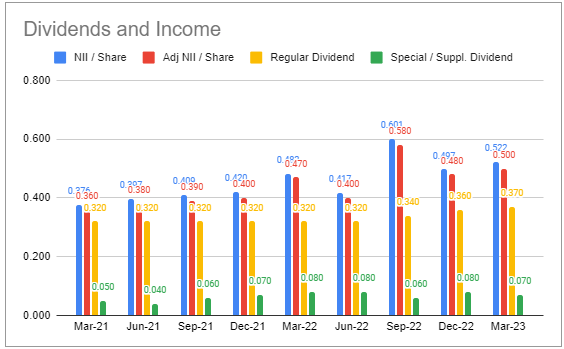
The company kept the dividend the same with a $0.37 base and $0.07 supplemental. This raised total dividend coverage to 114% and base dividend coverage to 135%.
Systematic Income BDC Tool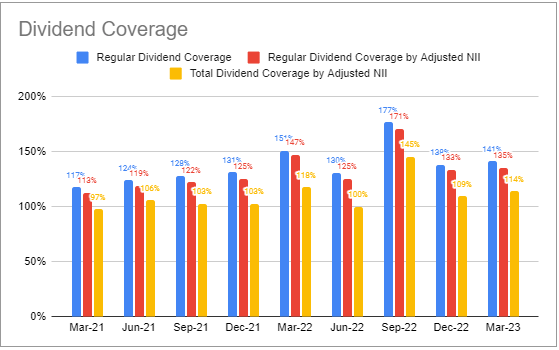
The NAV increased by 0.6%, primarily due to retained income. The company also continued to buy back its shares in light of its low valuation. This contributed a penny to the NAV over the period.
The company's statement that a high coverage level allows it "to build NAV in the face of an increasingly complex macroeconomic environment" is somewhat cryptic. In our view the key benefits of a high dividend coverage level is that the retained income offsets the cash drag from share buybacks as well as any drag on the NAV from potential unrealized losses down the road due to a worsening macro environment. This, in turn, mitigates the mechanical increase in leverage and the chance of a forced deleveraging.
Carlyle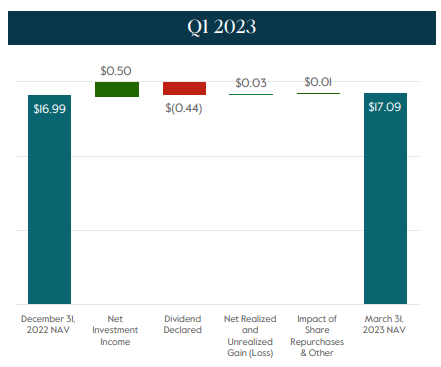
Income Dynamics
Net new investments were slightly lower as sales and repayments exceeded new fundings.
Systematic Income BDC Tool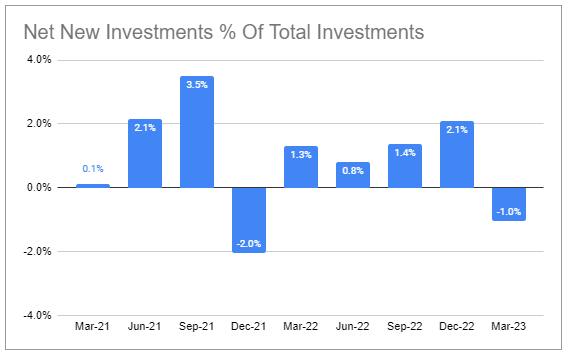
Leverage remained broadly stable and within the target range.
Systematic Income BDC Tool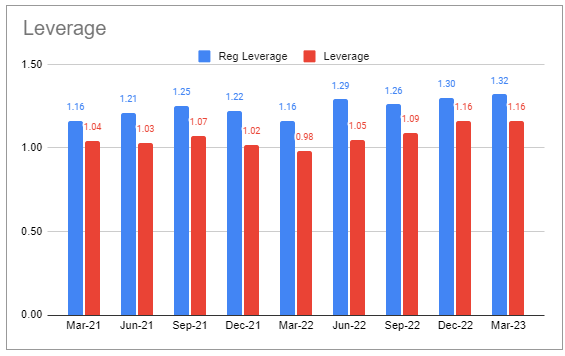
Portfolio yield ticked higher due to the increase in base rates as did interest expense. The company's yield differential between assets and liabilities is slightly below the sector median level of 6.2%. This is primarily due to its above-average floating-rate liability profile.
Systematic Income BDC Tool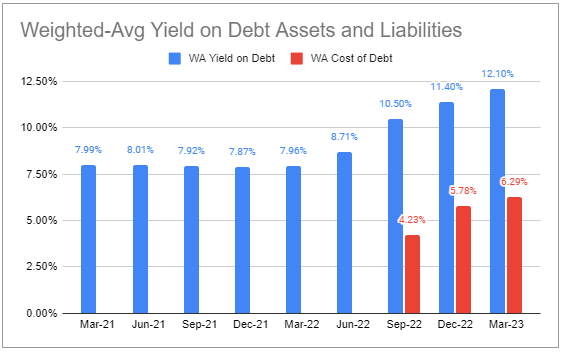
Another net income tailwind was the fact that the yield on new investments was higher than the yield on repayments, despite the up-in-capital-structure profile of new investments.
Carlyle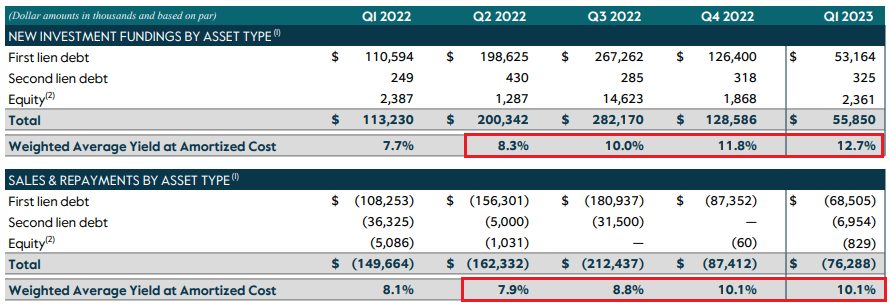
Portfolio Quality
A new company was added to non-accruals - American Physician Partners - which provides emergency medicine management for hospitals. According to management, the company has been hurt by labor shortages and wage inflation and its inability to fully pass this on. Non-accruals are about 1% above the sector median level.
Systematic Income BDC Tool
Overall portfolio quality, according to internal ratings, improved slightly. This may sound like a contradiction given the increase in non-accruals, however, this simply reflects that the new non-accrual was not a surprise and was likely already factored into the portfolio rating metrics.
Systematic Income BDC Tool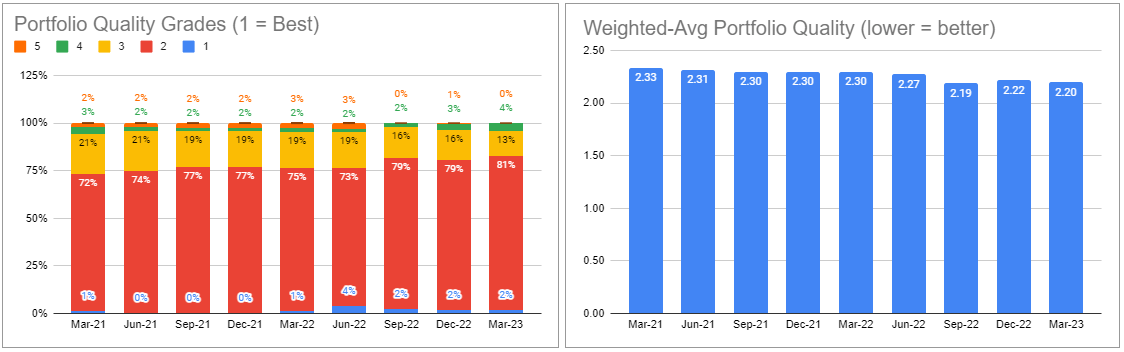
There has only been one quarter of net realized losses over the past couple of years which is a pretty strong result. Net realized gains is another way BDCs can generate additional total return for investors above and beyond clipping the coupons on their loans.
Systematic Income BDC Tool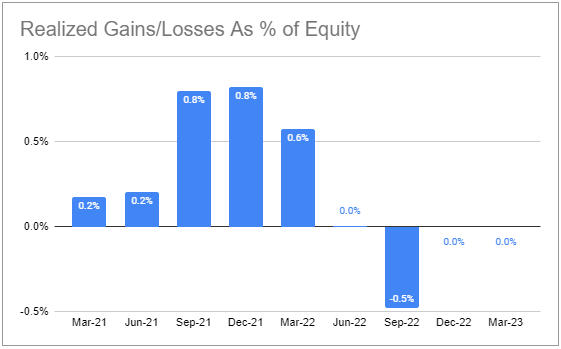
Valuation And Return Profile
CGBD has put together an impressive performance track record for a stock that continues to trade significantly cheaper to the average BDC valuation.
Systematic Income BDC Tool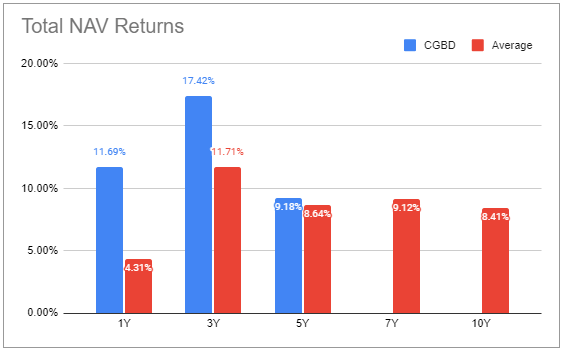
Its level of outperformance and its consistency has been particularly notable since around the COVID crash. We can see this in the yellow line rising and remaining above zero in the chart below.
Systematic Income BDC Tool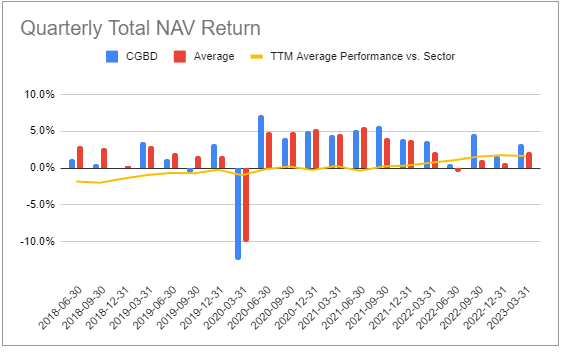
As the chart below shows, CGBD (blue line) has tended to trade at a discount to the average sector valuation (orange line).
Systematic Income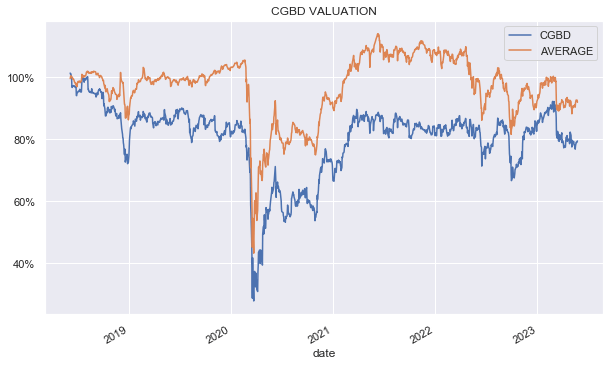
The chart below shows the valuation differential between CGBD and the average BDC. CGBD is currently trading at a valuation 12.5% below the average BDC in our coverage (79% vs 92%).
Systematic Income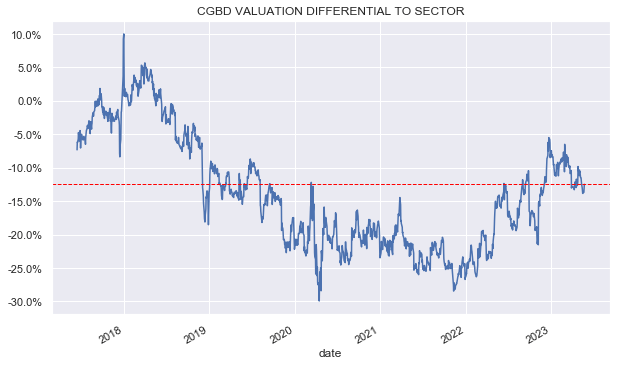
The chart below shows that of the BDCs that have delivered a 5Y total NAV return of around 10%, CGBD remains one of the cheapest. PSEC is significantly cheaper but it remains an oddball in the sector.
Systematic Income BDC Tool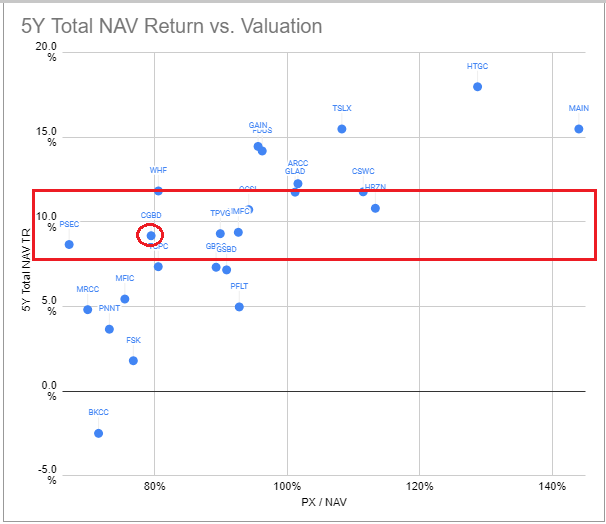
Stance And Takeaways
The chart below shows the timing of our initial CGBD buys (green line) as well as a recent sale (red line) in terms of valuations of both CGBD and the sector average.
Systematic Income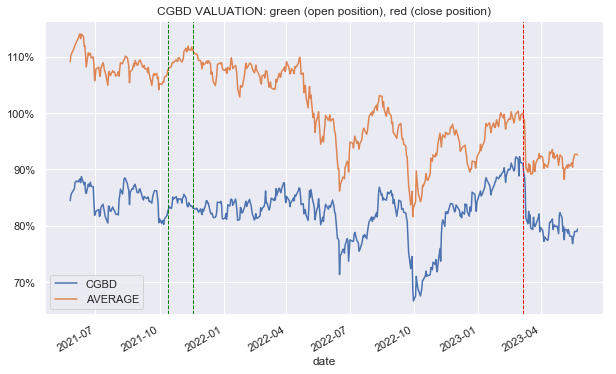
This chart shows the valuation differential more clearly. In short, our initial allocations to the stock were when it traded at a valuation 25%+ cheaper to the sector. We pared down our allocation when the valuation gap closed to within 8% or so. Since then, the valuation gap increased to 12.5%. We would consider adding more if this valuation gap increases further.
Systematic Income
This article was written by

At Systematic Income our aim is to build robust Income Portfolios with mid-to-high single digit yields and provide investors with unique Interactive Tools to cut through the wealth of different investment options across BDCs, CEFs, ETFs, mutual funds, preferred stocks and more. Join us on our Marketplace service Systematic Income.
Our background is in research and trading at several bulge-bracket global investment banks along with technical savvy which helps to round out our service.
Analyst’s Disclosure: I/we have a beneficial long position in the shares of CGBD either through stock ownership, options, or other derivatives. I wrote this article myself, and it expresses my own opinions. I am not receiving compensation for it (other than from Seeking Alpha). I have no business relationship with any company whose stock is mentioned in this article.
Seeking Alpha's Disclosure: Past performance is no guarantee of future results. No recommendation or advice is being given as to whether any investment is suitable for a particular investor. Any views or opinions expressed above may not reflect those of Seeking Alpha as a whole. Seeking Alpha is not a licensed securities dealer, broker or US investment adviser or investment bank. Our analysts are third party authors that include both professional investors and individual investors who may not be licensed or certified by any institute or regulatory body.