FGD Couldn't Keep Pace With Inflation

Summary
- First Trust Dow Jones Global Select Dividend Index Fund ETF holds 99 global dividend stocks.
- It is well-diversified across countries and holdings, but it is overweight in financials.
- Historical performance is close to competitors.
- It has suffered a large decay in inflation-adjusted value and distributions.
- Quantitative Risk & Value members get exclusive access to our real-world portfolio. See all our investments here »
Khanchit Khirisutchalual
This article series aims at evaluating ETFs (exchange-traded funds) regarding the relative past performance of their strategies and metrics of their current portfolios. Reviews with updated data are posted from time to time.
FGD strategy and portfolio
First Trust Dow Jones Global Select Dividend Index Fund ETF (NYSEARCA:FGD) started investing operations on 11/21/2007 and tracks the Dow Jones Global Select Dividend Index. As of writing, it has 99 holdings, a 12-month distribution yield of 5.63% and a total expense ratio of 0.56%. Distributions are paid quarterly.
As described by First Trust, eligible companies are listed in 25 developed markets. They must show:
- A current-year dividend per share greater than or equal to the five-year average.
- A maximum 5-year average payout ratio of 60% for U.S. and Europe, or 80% for other countries.
- A minimum average daily trading volume of $ 3 million.
Eligible stocks are ranked in descending IAD yield order. At every reconstitution, existing constituents stay in the index if they are in the top 150. Excluded stocks are replaced with the best-ranked eligible stocks, until the count reaches 100. Constituents are weighted based on IAD yields with a limit of 10%. The index is reconstituted once a year in March.
The funds is quite balanced between large cap (about 42% of asset value) and mid-caps (about 37%). The top three countries are Canada (13%), South Korea (12.2%) and the U.S. (9.8%). Hong Kong is ranked 7th and weighs 6%, which represents a moderate exposure to geopolitical and regulatory risks related to China. The next chart plots the top 10 countries, representing 78% of asset value.
FGD country allocation (chart: author; data: First Trust)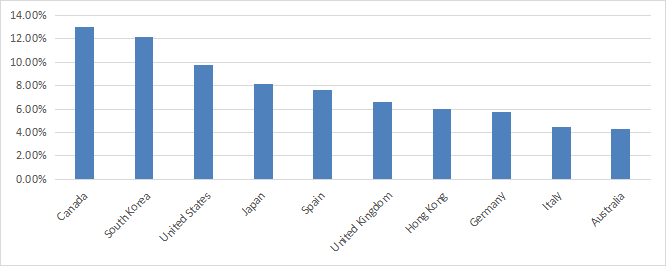
The fund is overweight in financials, with 34.3% of asset value in this sector. Information technology and healthcare are ignored.
FGD sectors ( chart: author; data: First Trust)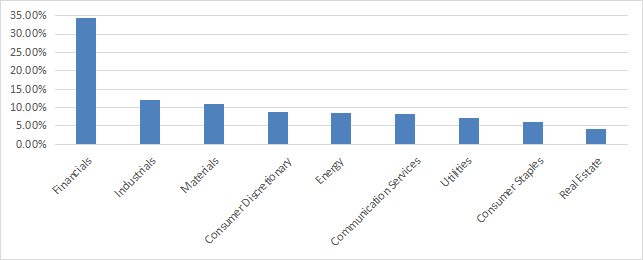
The top 10 holdings, listed below, represent 17% of asset value. The heaviest one weighs about 2%, so risks related to individual companies are low.
Name | Identifier | Classification | Weighting |
Mitsui O.S.K. Lines, Ltd. | 9104.JP | Industrials | 2.06% |
Camping World Holdings, Inc | CWH | Consumer Discretionary | 1.94% |
Hapag-Lloyd AG | HLAG.GY | Industrials | 1.91% |
Sitio Royalties Corp | STR | Energy | 1.84% |
Nippon Yusen K.K. | 9101.JP | Industrials | 1.80% |
Enagas S.A. | ENG.SM | Utilities | 1.62% |
Peyto Exploration & Development Corp | PEY.CN | Energy | 1.51% |
PCCW Limited | 8.HK | Communication Services | 1.45% |
BNK Financial Group Inc. | 138930.KS | Financials | 1.43% |
Woori Financial Group Inc. | 316140.KS | Financials | 1.41% |
Past performance compared to competitors
FGD has a loose dividend growth rule based on the 5-year average yield, but it is more focused on higher yields. The next chart compares total returns of FGD and five other non-hedged international dividend funds:
- Schwab Fundamental International Large Co ETF (FNDF),
- iShares International Select Dividend ETF (IDV),
- First Trust S&P International Dividend Aristocrats Fund (FID), reviewed here,
- SPDR S&P Global Dividend ETF (WDIV), reviewed here,
- MSCI EAFE High Dividend Yield Equity ETF (HDEF), reviewed here.
The chart starts on 1/1/2016 to match all inception dates.
FGD vs competitors since 2016 (Seeking Alpha)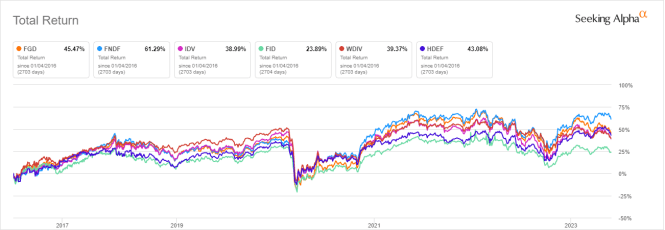
FGD is second to FNDF. However, it is second to last in 2023 to date (next chart). FNDF is also the best performer in 2023.
FGD vs competitors in 2023 ( Seeking Alpha)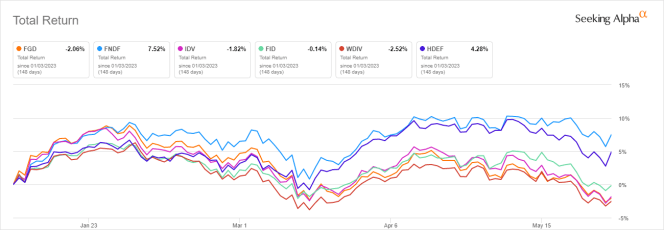
Since inception, FGD share price has lost 34%. In the same time, the cumulative inflation has been about 44%, based on CPI. This represents a huge loss in inflation-adjusted value. Since the second half of 2009, the price has been on a roller coaster and it is back in the same range.
FGD share price, without dividend (Seeking Alpha)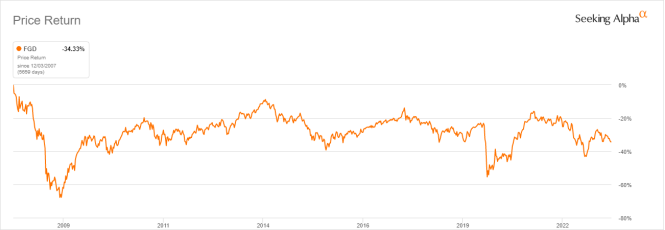
The annual sum of distributions went up from $1.19 per share in 2012 to $1.26 in 2022. This is a 5.8% growth, whereas the cumulative inflation has been 29% at the same time. This means a significant decay also in inflation-adjusted income for shareholders.
FGD distribution history (Seeking Alpha)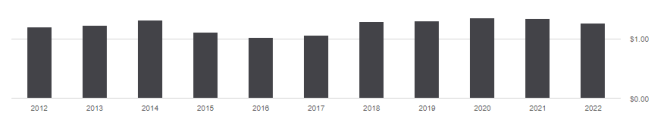
Takeaway
First Trust Dow Jones Global Select Dividend Index Fund ETF holds 99 global high-dividend stocks with yields over their 5-year average. The portfolio is well-diversified across developed markets and holdings. Canada, South Korea and the U.S. are the heaviest countries. It is overweight in financials (34% of asset value). The fund is close to competitors regarding historical performance. However, it has suffered a large decay in inflation-adjusted value and distributions.
Quantitative Risk & Value (QRV) features data-driven strategies in stocks and closed-end funds outperforming their benchmarks since inception. Get started with a two-week free trial now.

This article was written by

Step up your investing experience: try Quantitative Risk & Value for free now (limited offer).
I am an individual investor and an IT professional, not a finance professional. My writings are data analysis and opinions, not investment advice. They may contain inaccurate information, despite all the effort I put in them. Readers are responsible for all consequences of using information included in my work, and are encouraged to do their own research from various sources.
Analyst’s Disclosure: I/we have no stock, option or similar derivative position in any of the companies mentioned, and no plans to initiate any such positions within the next 72 hours. I wrote this article myself, and it expresses my own opinions. I am not receiving compensation for it (other than from Seeking Alpha). I have no business relationship with any company whose stock is mentioned in this article.
Seeking Alpha's Disclosure: Past performance is no guarantee of future results. No recommendation or advice is being given as to whether any investment is suitable for a particular investor. Any views or opinions expressed above may not reflect those of Seeking Alpha as a whole. Seeking Alpha is not a licensed securities dealer, broker or US investment adviser or investment bank. Our analysts are third party authors that include both professional investors and individual investors who may not be licensed or certified by any institute or regulatory body.