Vermilion: The Q1-23 Result Confirms The Attractive Valuation

Summary
- Q1-23 was a decent quarter for Vermilion, with 82,455 boe/d in production, C$253M in fund flows, and C$98M in free cash flow.
- Vermilion is among the cheaper Canadian oil & natural gas producer, based on forward estimates.
- European windfall profit taxes didn't have as much of an impact as many feared.
- This idea was discussed in more depth with members of my private investing community, Off The Beaten Path. Learn More »
CreativeNature_nl/iStock via Getty Images
A version of this article was published in conjunction with the Q1-23 earnings result in my investing group, Off The Beaten Path.
Investment Thesis
Vermilion Energy (NYSE:VET) has been one of the worst Canadian oil & natural gas producers this year, in terms of performance. The stock is down 36% YTD. That is despite the fact that the stock was already going into the year substantially off the highs from last year. The stock is now down more than 60% from the peak last year, which is substantially more than most peers.
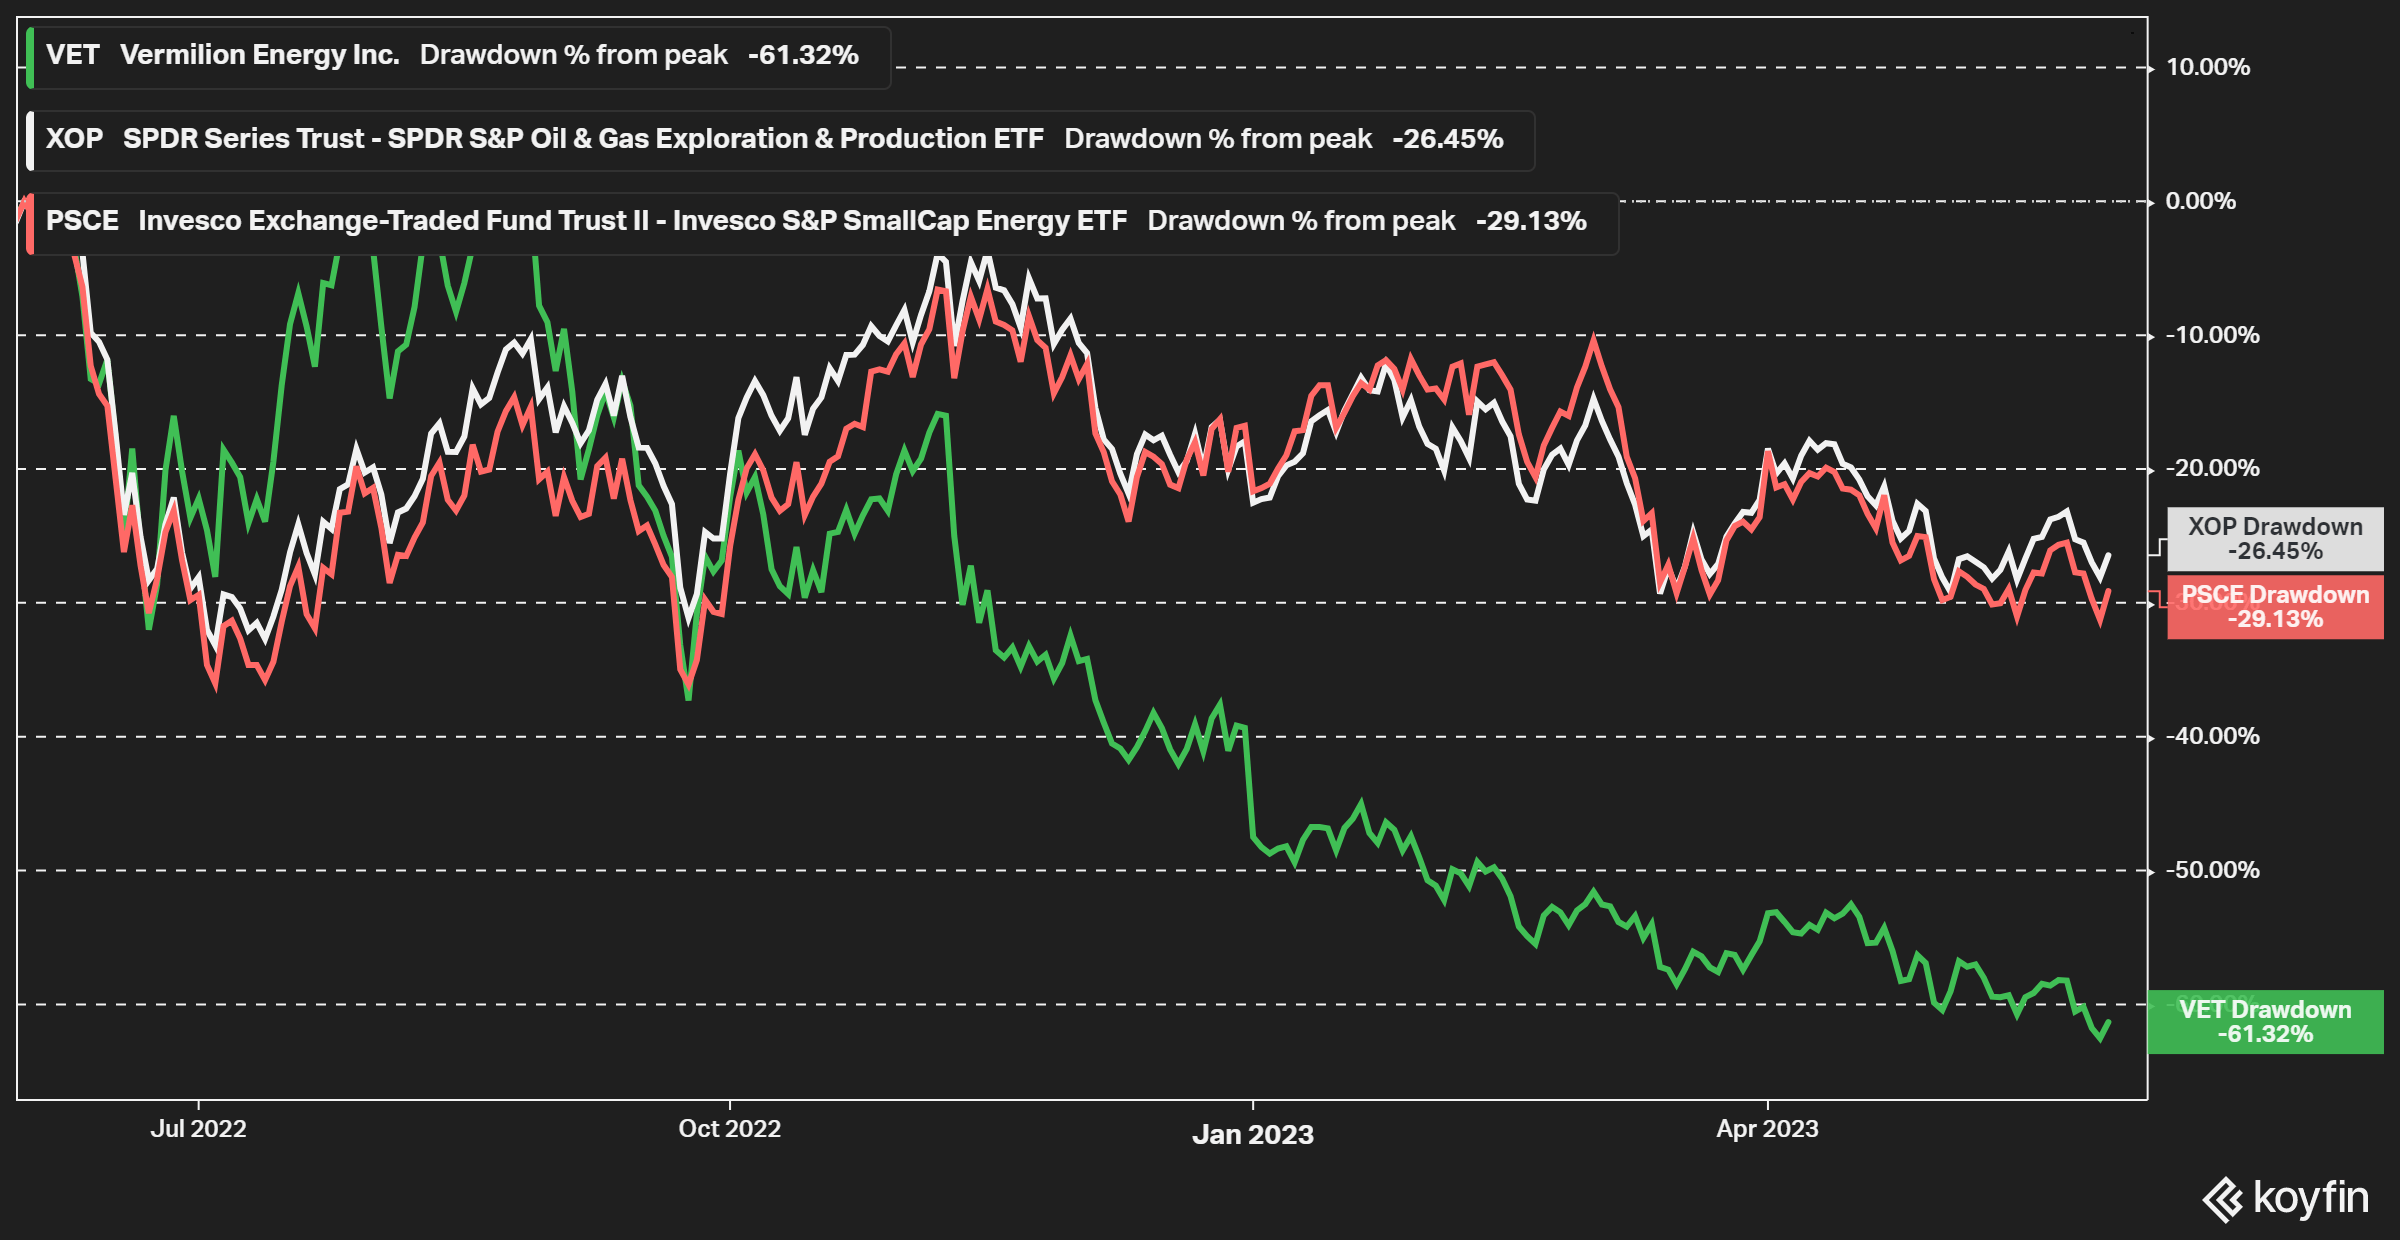
Figure 1 - Source: Koyfin
Part of this decline can naturally be explained by the decline in energy prices, European natural gas prices specifically, which have recently been an outsized contributor to fund flows and free cash flow for the company. The European windfall profit tax has no doubt played a part as well, even if I would argue it has probably had a larger impact on the sentiment than the overall profitability of Vermilion.
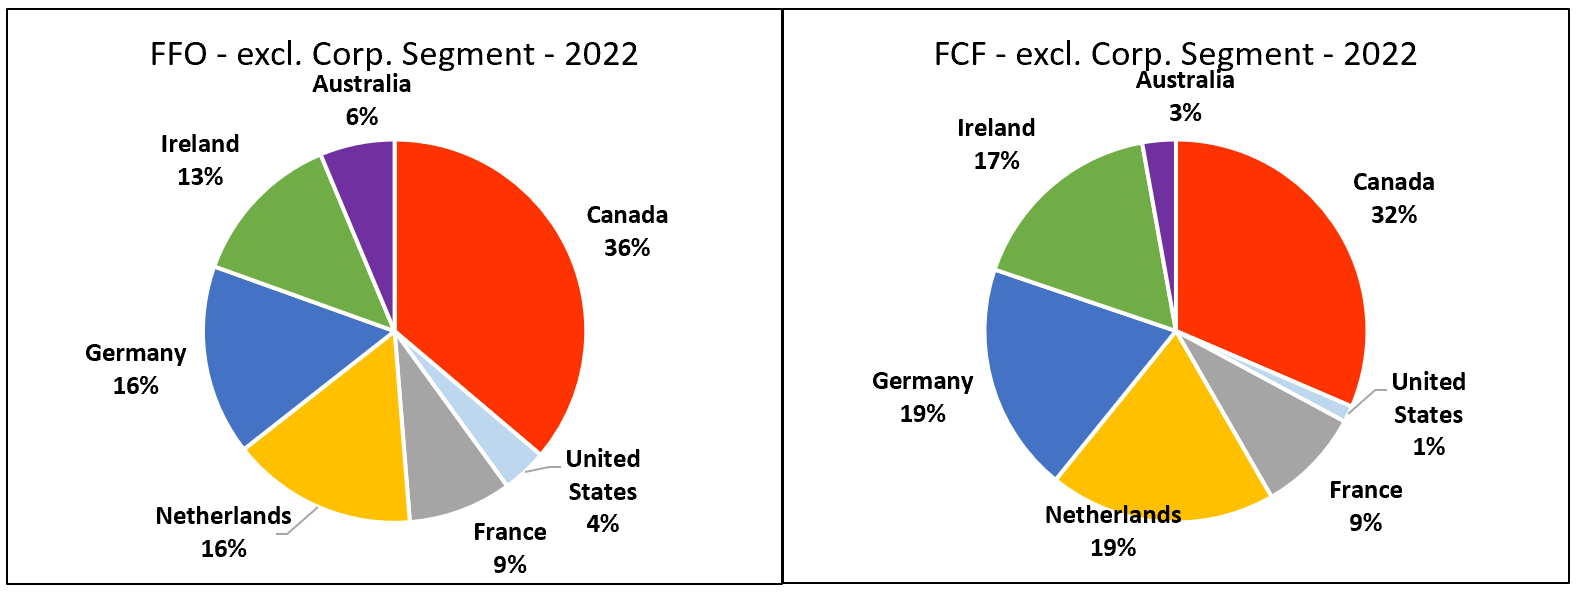
Figure 2 - Source: Vermilion Q4-22 Report
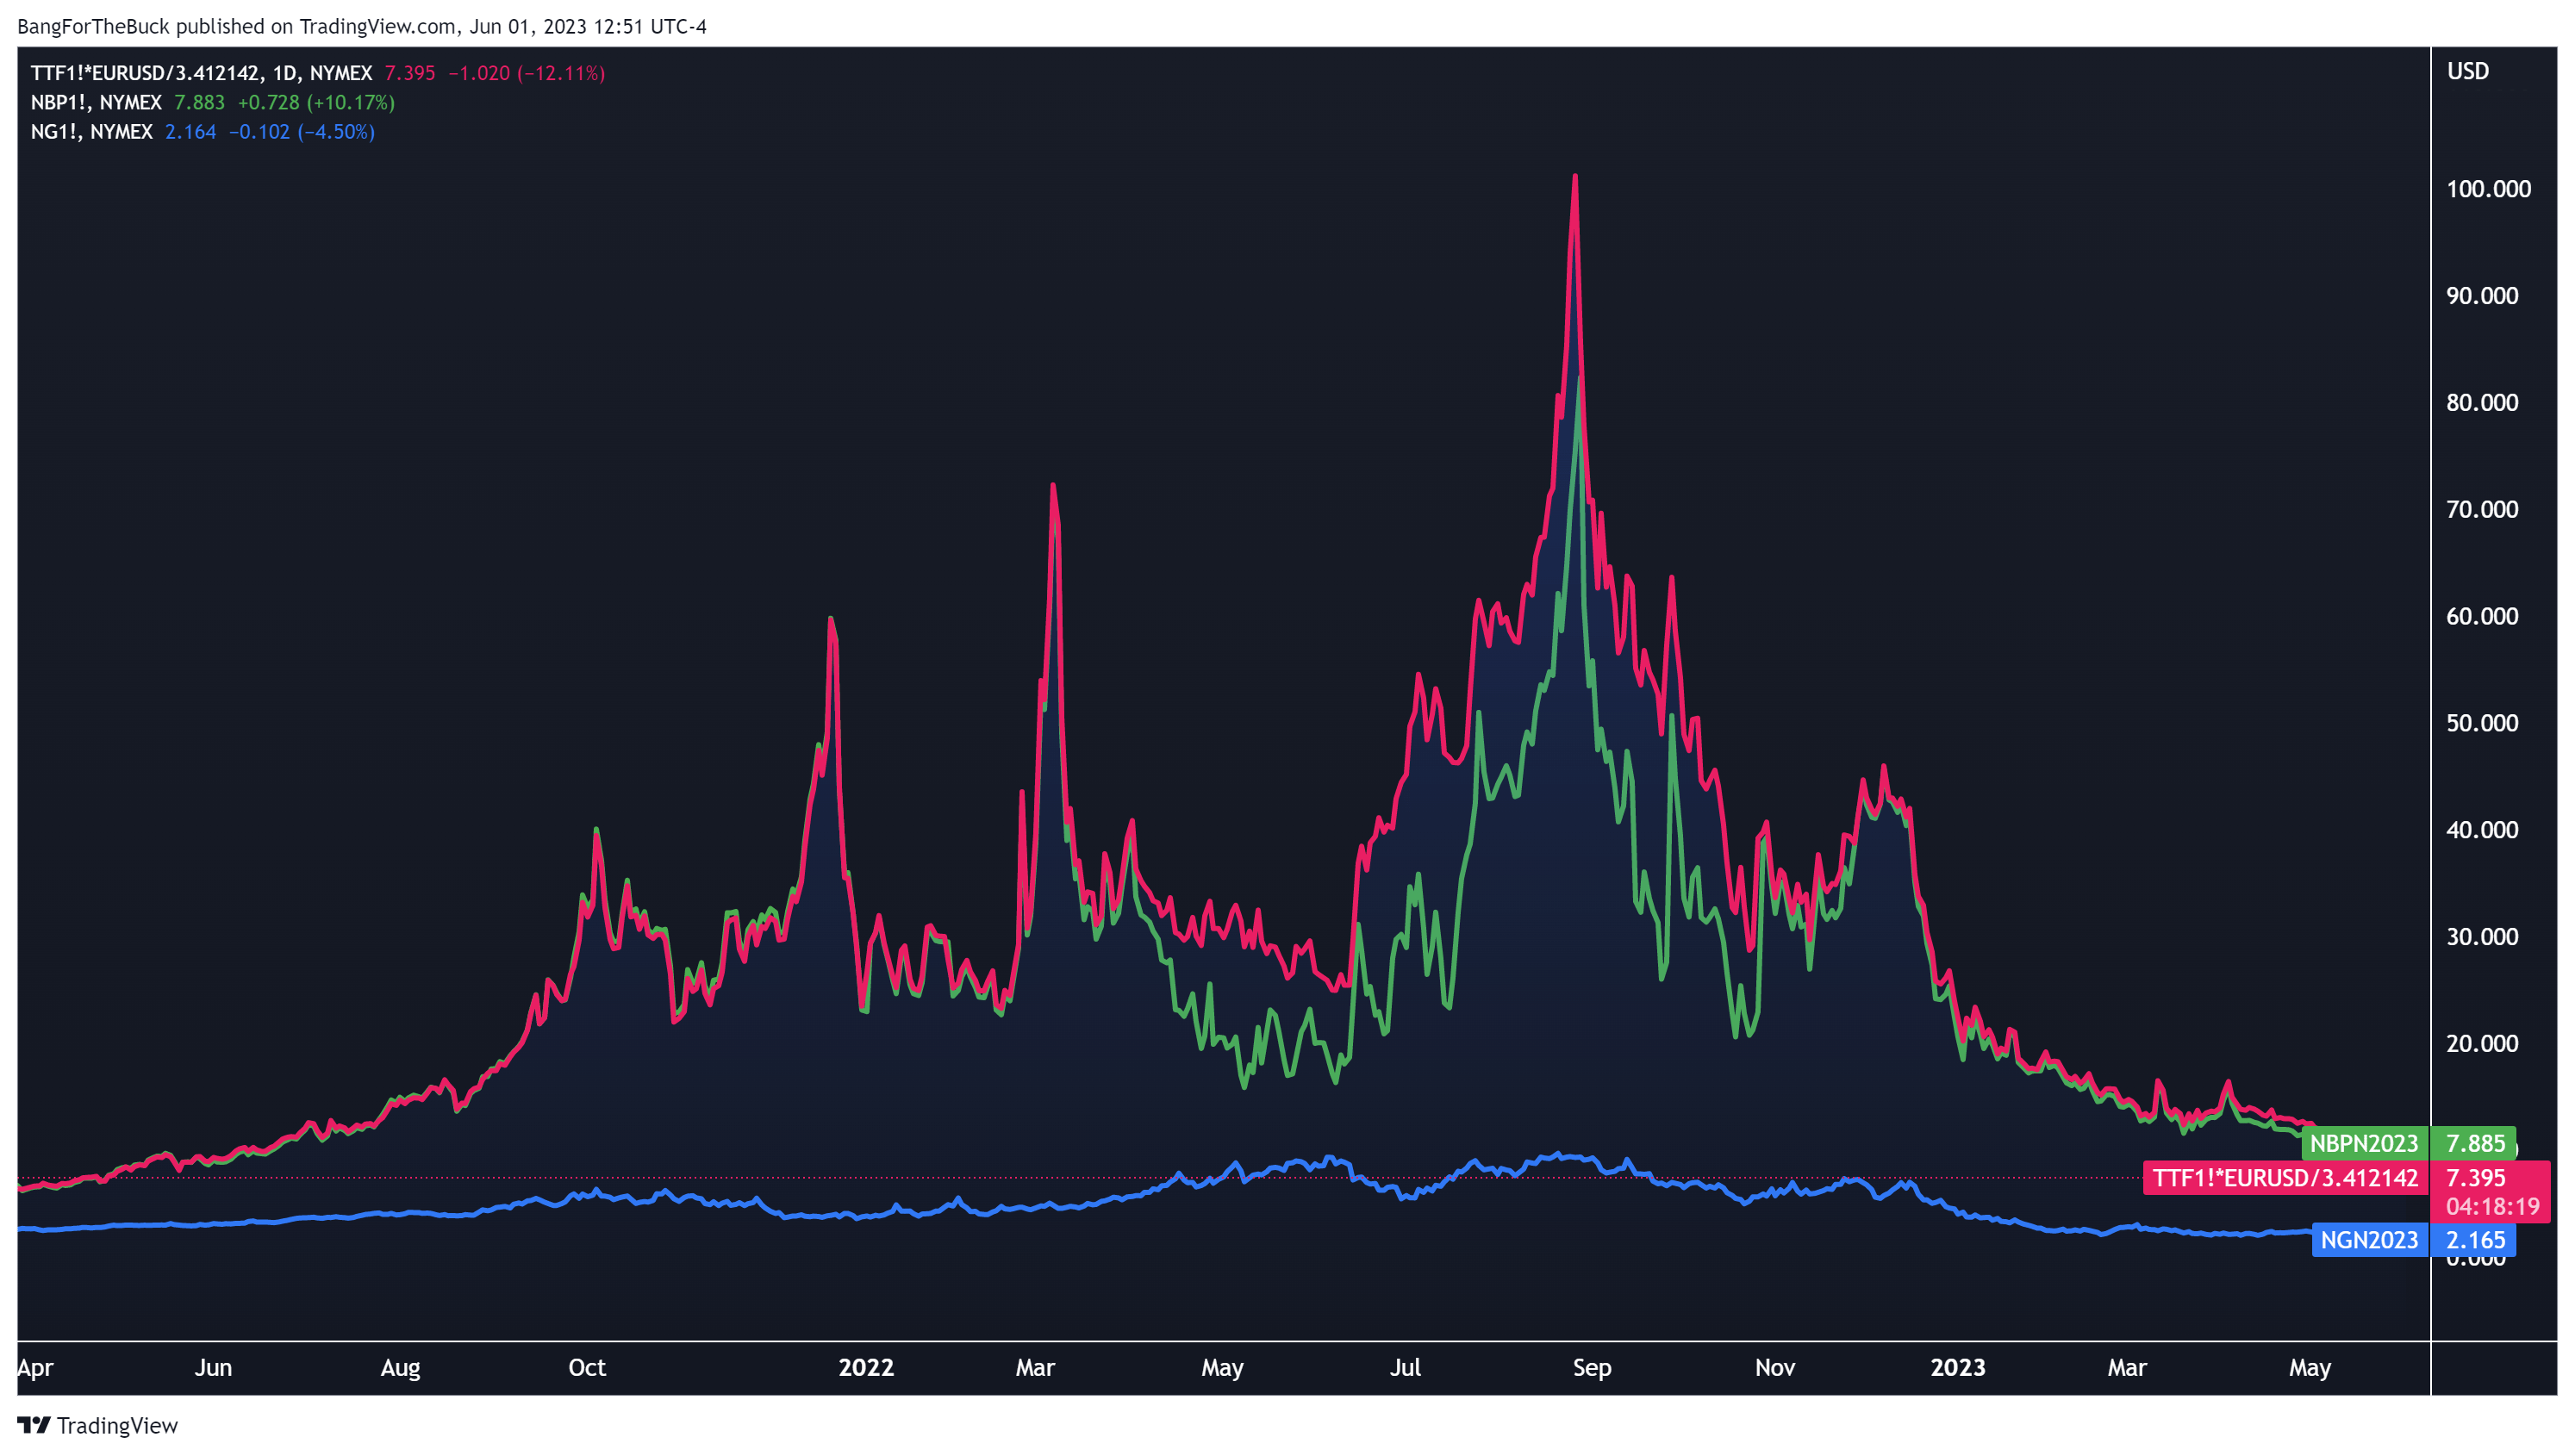
Figure 3 - Source: TradingView - Dutch, UK, & U.S. natural gas prices
I have covered the stock a few times recently on Seeking Alpha, and those articles can be found here. There is no question I was early when I started buying Vermilion in December 2022, but the company is after the substantial decline trading with a very attractive valuation at current energy prices. So, for anyone with more patience, I continue to think Vermilion is a very good investment at this level. My typical investment horizon is 18–36 months, and I have increased my position during the recent weakness.
Q1-23 Results
In early May, Vermilion reported its Q1-23 results and hosted a conference call. Production was 82,455 boe/d during the first quarter, which was at the lower end of the latest guidance of 82,000-86,000 boe/d. Earlier this year, the company communicated that the Australian operation was scheduled to be offline in Q1 due to maintenance, but is now expected to be offline for most of Q2 as well.
In Q2, the company has also been affected by the forest fires in Alberta, but has lately started to restart curtailed operations and the annual production guidance of 82,000-86,000 boe/d remains unchanged as of the last update.
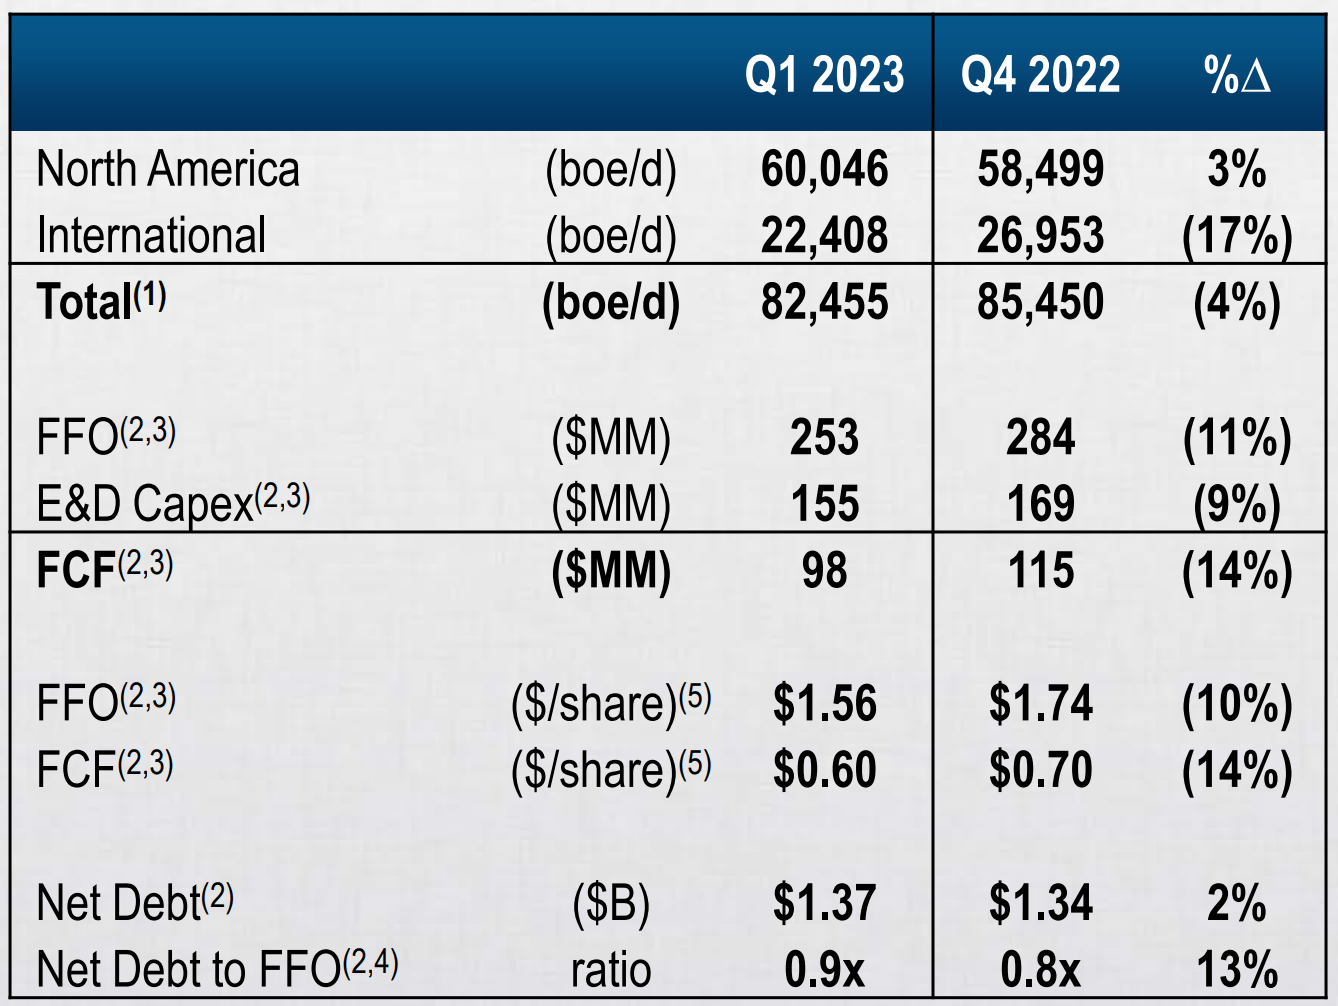
Figure 4 - Source: Vermilion Corporate Presentation
Fund flows in Q1-23 were C$253M and the company reported C$98M in free cash flow for the quarter. The cash flows are down compared to last year, but that should not be a surprise to anyone given the lower energy prices in 2023.
There has been a lot of criticism lately against Vermilion and the lower shareholder distributions, where the current dividend yield is only 2.7%, while the company is focused on deleveraging. Last year, Vermilion was on track to deleverage quicker, which would likely have led to higher shareholder distributions in 2023. However, with the addition of the European windfall profit tax and weaker energy prices, everything was pushed back a few quarters.
I can understand and support the company in its effort to get the leverage ratio down, before more substantial dividends and buybacks, which is why I think patience will be required for anyone investing in Vermilion. The net debt was at C$1,368M at the end of Q1-23 and will hopefully reach or get close to the C$1B net debt target by the end of this year, which should lead to a boost in shareholder distributions in 2024.
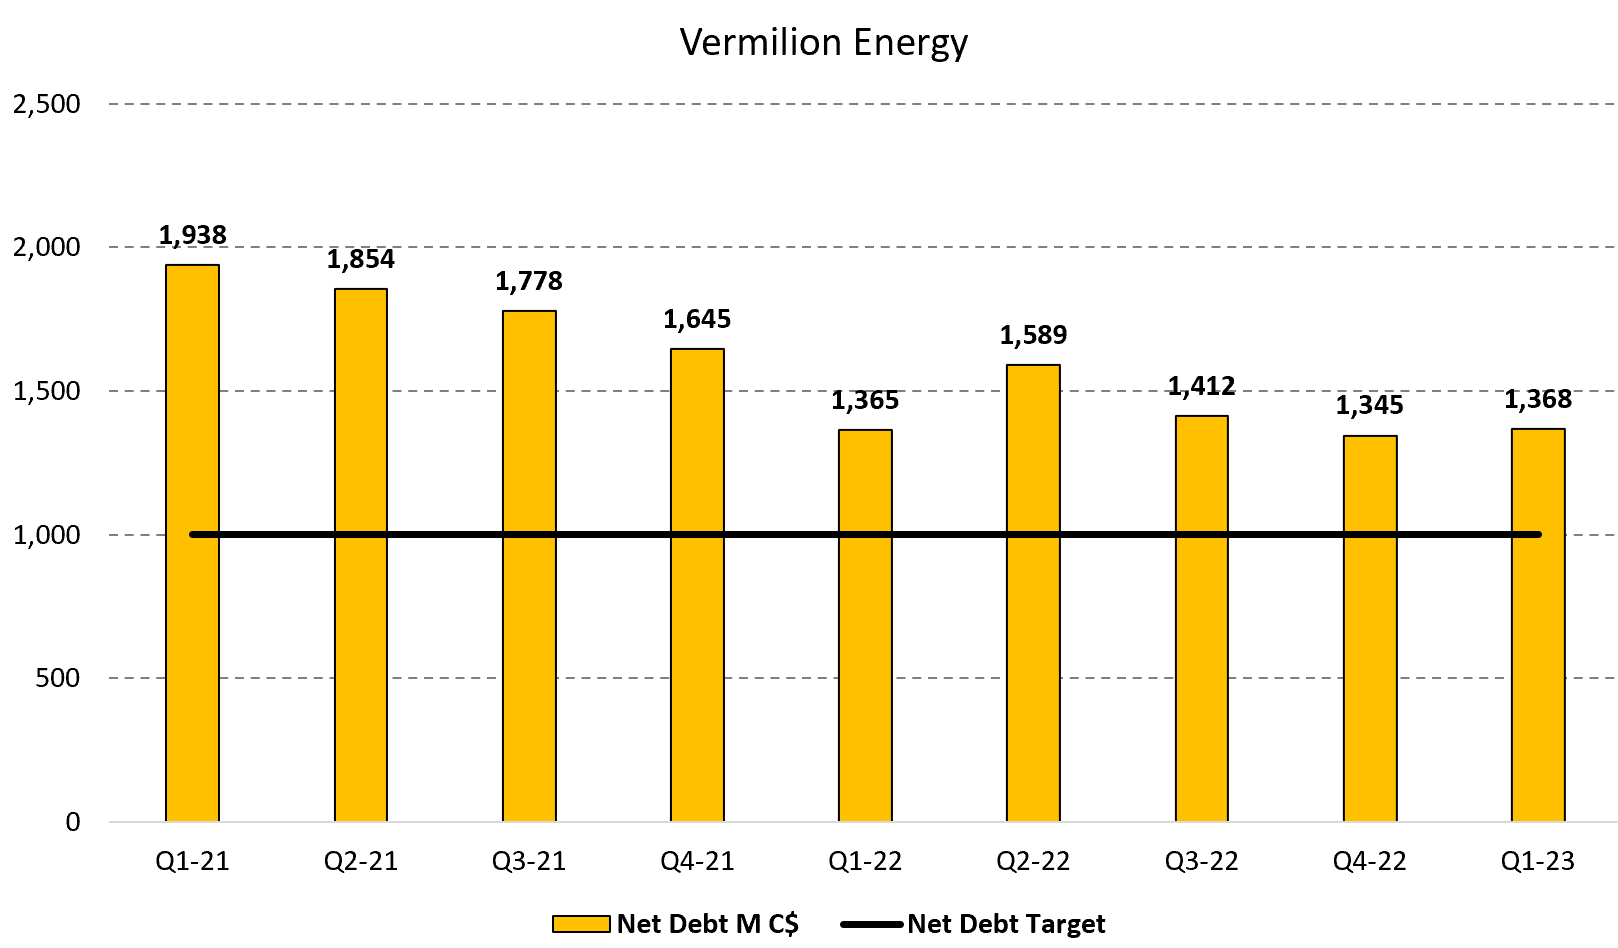
Figure 5 - Source: Vermilion Quarterly Reports
Even though energy prices are down significantly from 2022, Vermilion did still report a sales price of C$75.36/boe and fund flows of C$34.52/boe in Q1-23, which are respectable numbers.
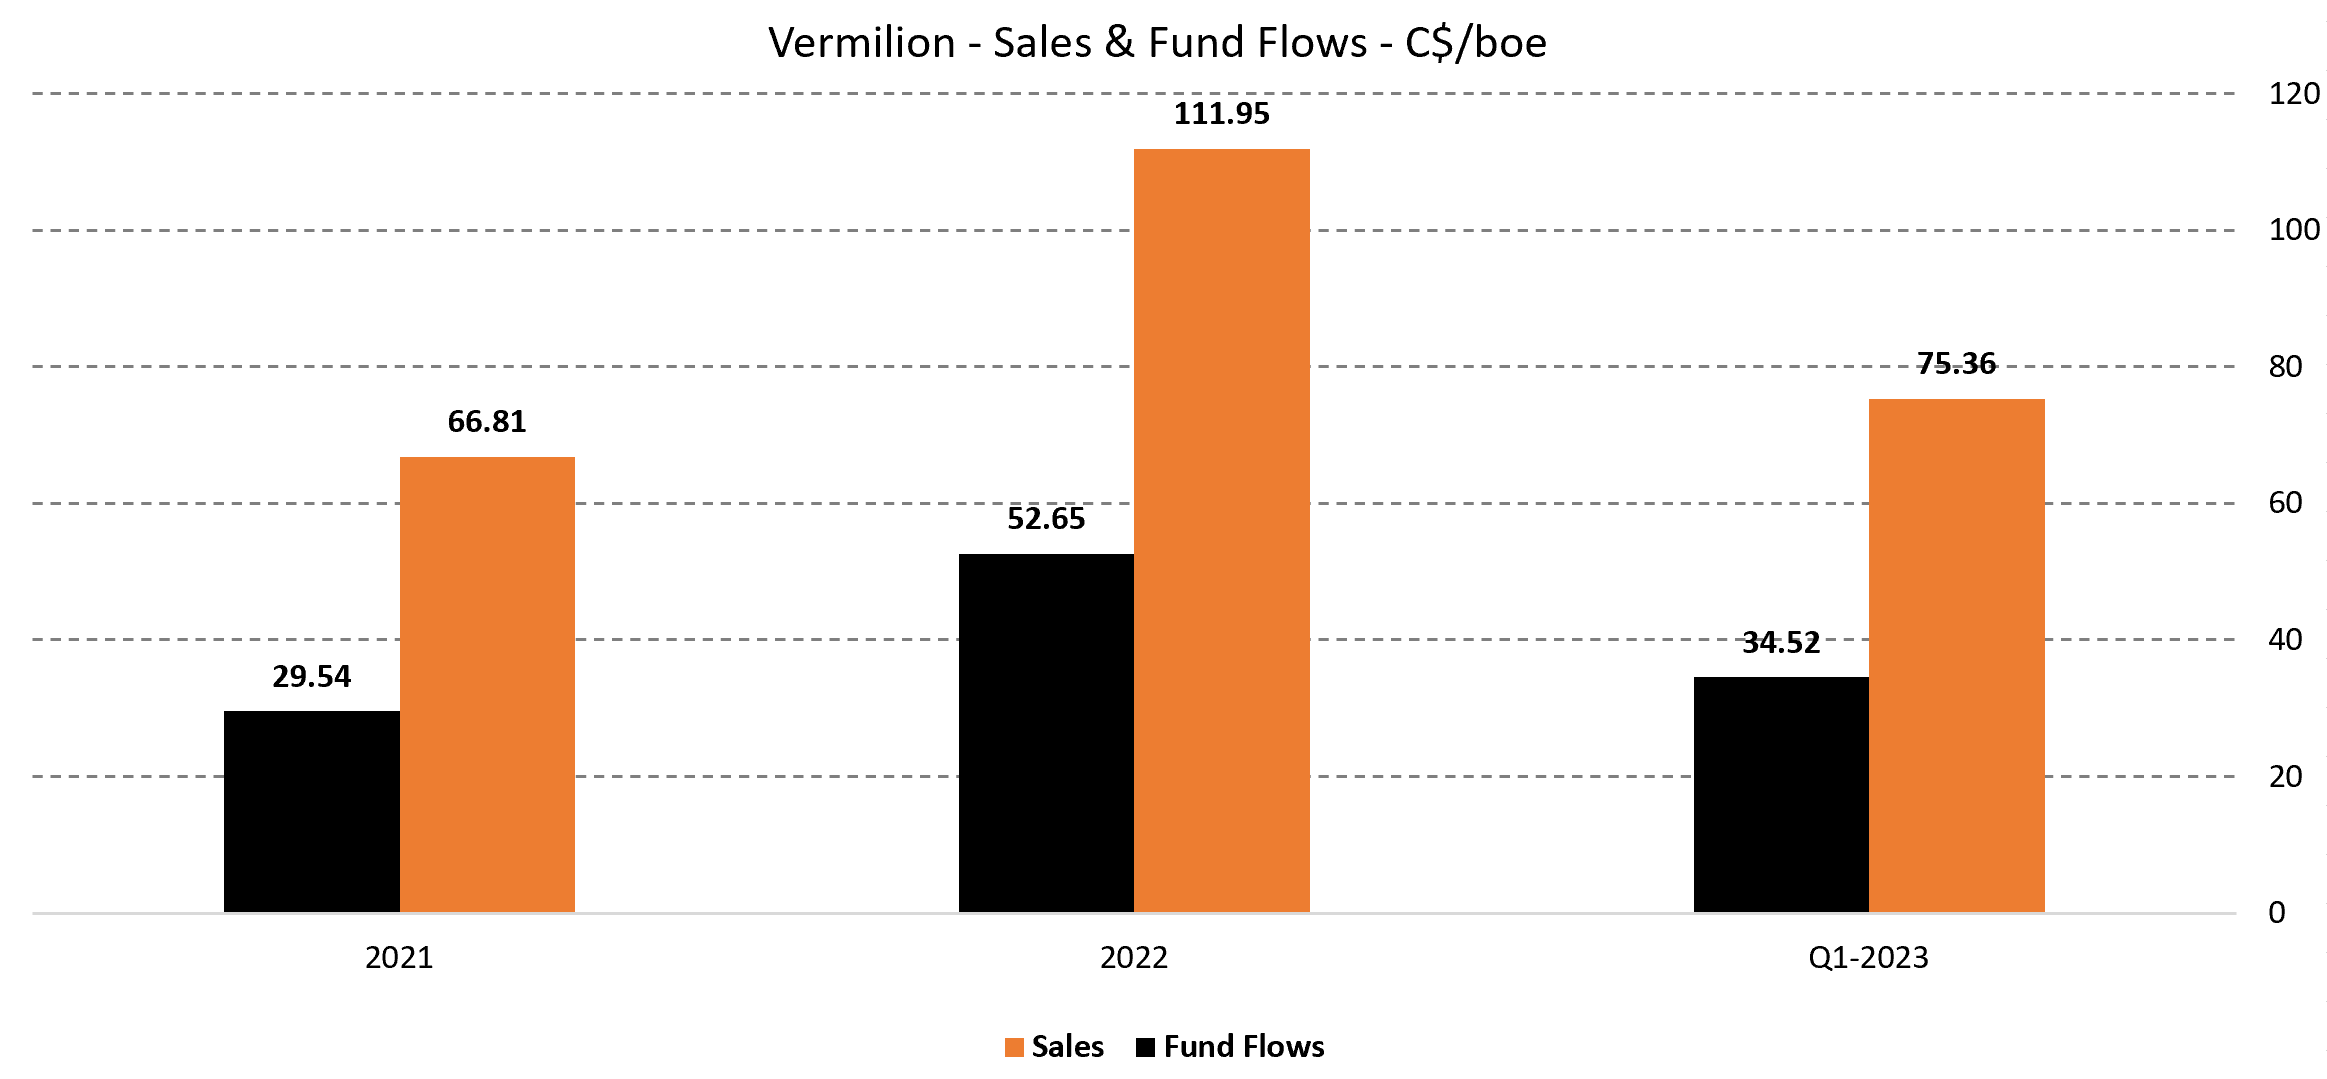
Figure 6 - Source: Vermilion Quarterly Reports
The attractive sales and fund flows are partly because European natural gas prices are still trading with a substantial premium to its North American equivalent, despite being down a lot from the peak levels last year, as illustrated in figure 3 further above. The company also has close to 50% of its the European natural gas production hedged in 2023, at attractive levels.
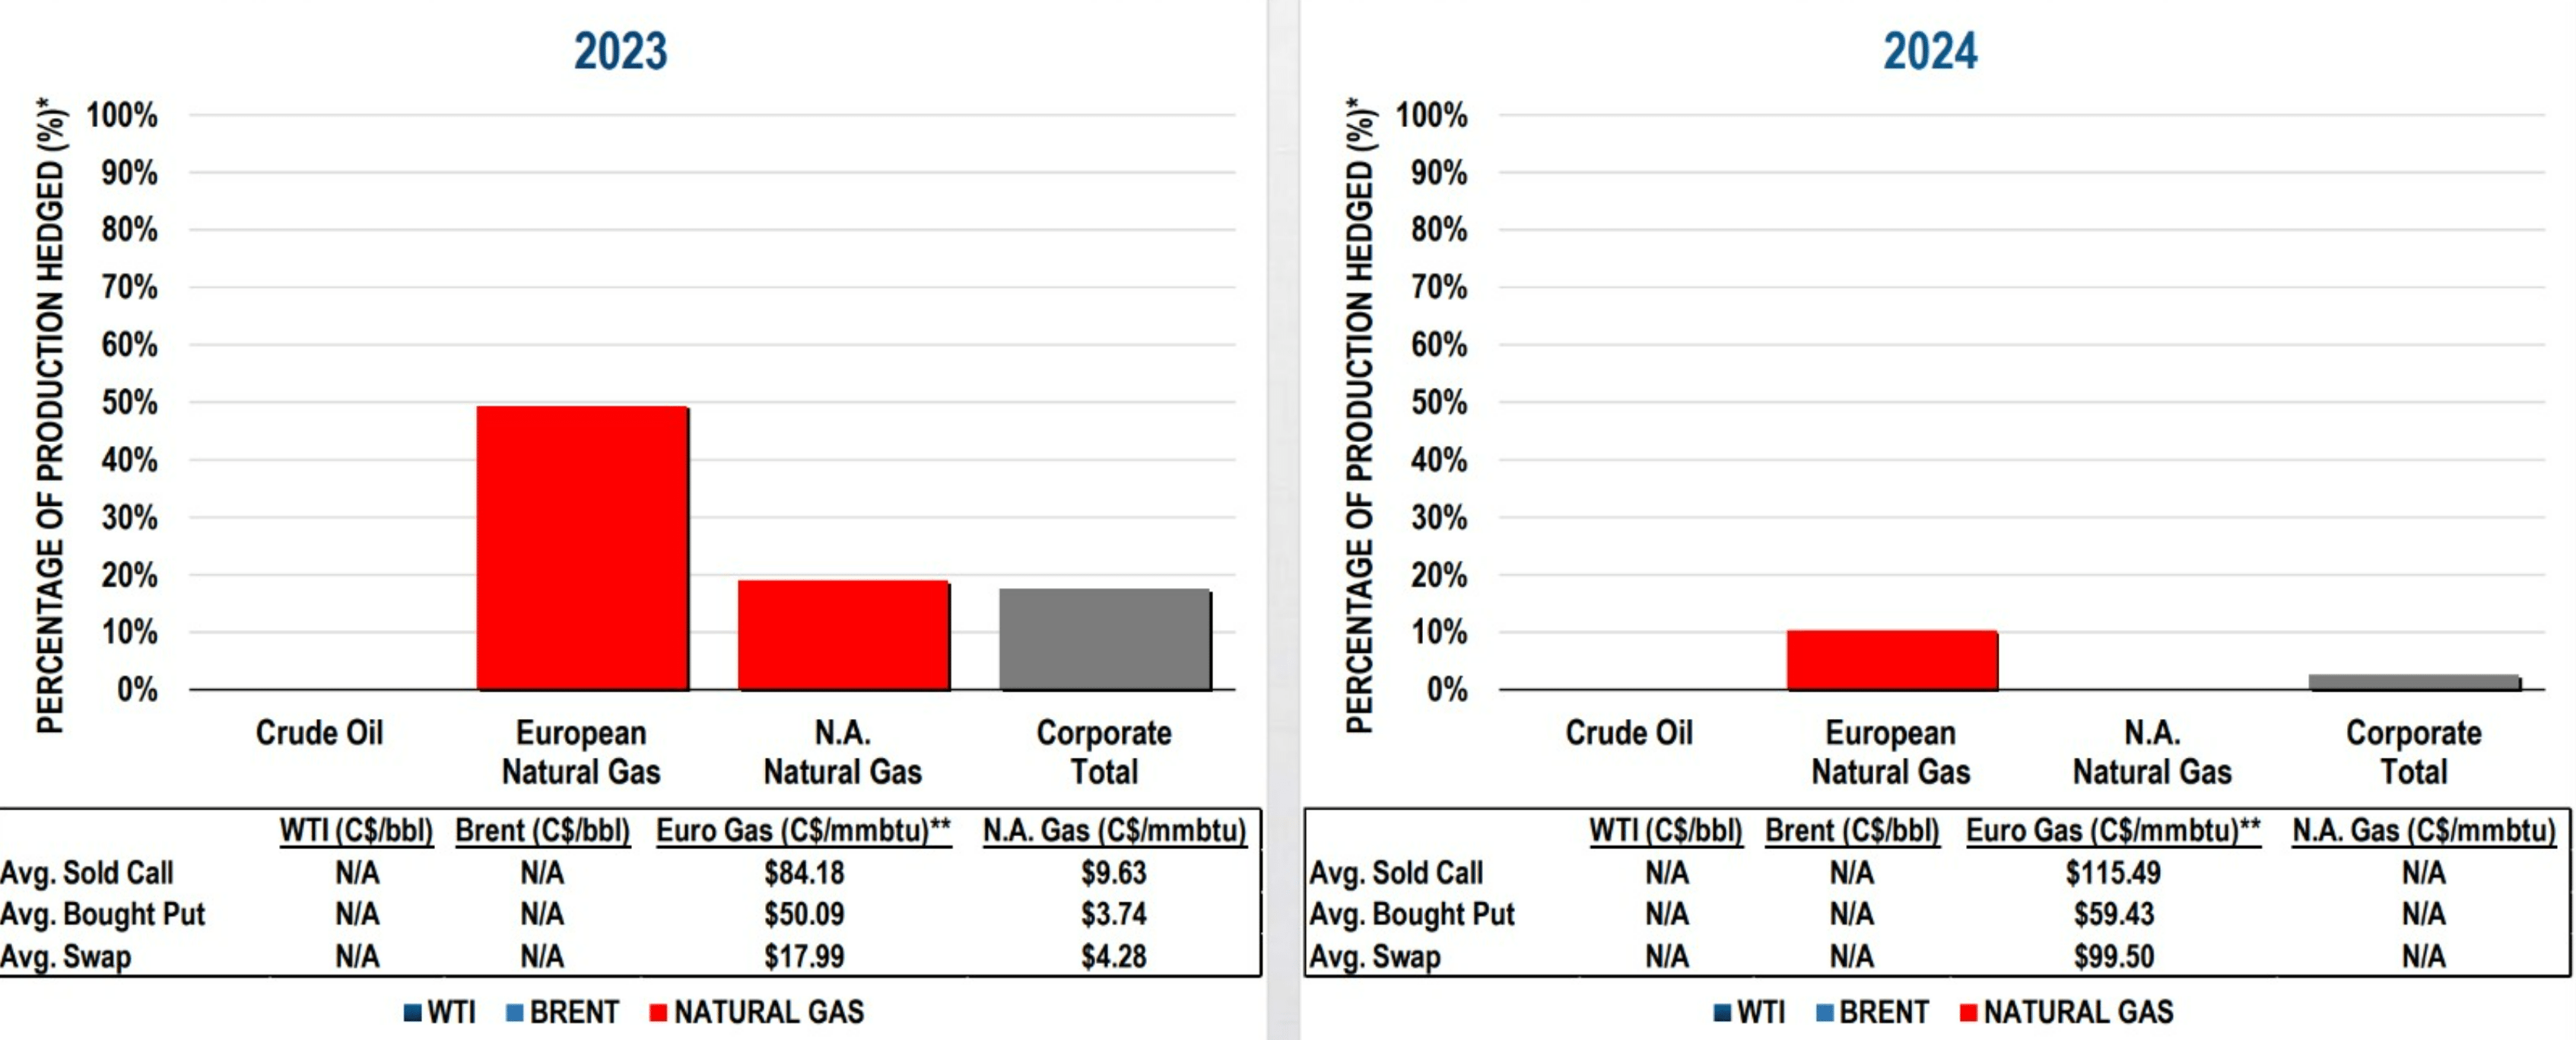
Figure 7 - Source: Vermilion Presentation
The relatively low costs have also had an impact, even if there were some YoY increases. For example, we can see that the controversial windfall profit tax only accounted for C$2.92/boe in Q1-23, even if we did see royalties increase as well.
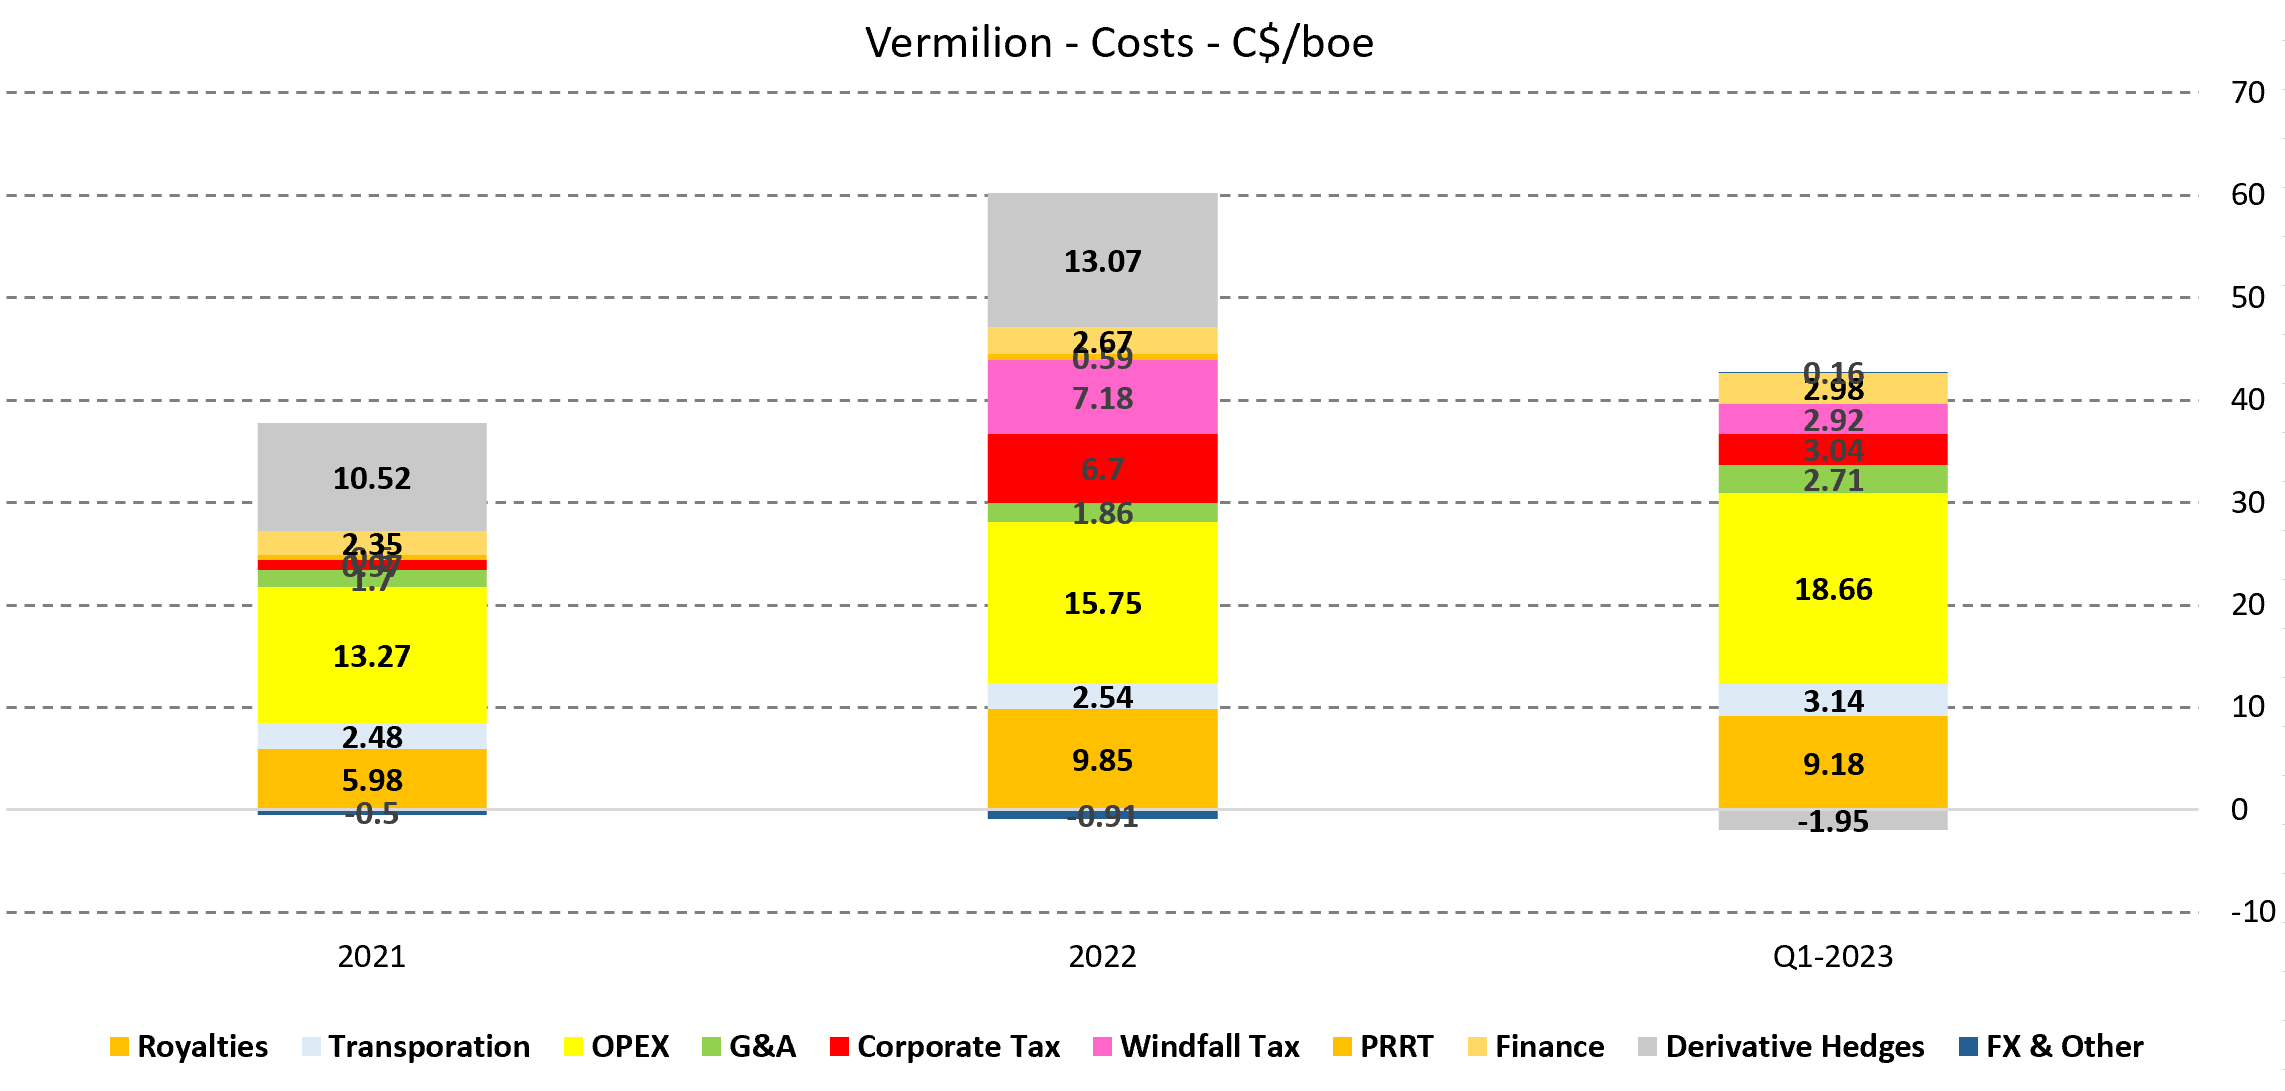
Figure 8 - Source: Vermilion Quarterly Reports
Valuation & Conclusion
Vermilion's stock price has gotten severely punished over the last year, while part of the decline is justifiable due to lower energy prices, the size of the decline has in my view been excessive.
The below figures look at the forward-looking EV/EBITDA and P/E ratios for Vermilion and a few peers. Where we can see that Vermilion is extremely cheap on an absolute basis, relative to peers, and in relation to its own history.
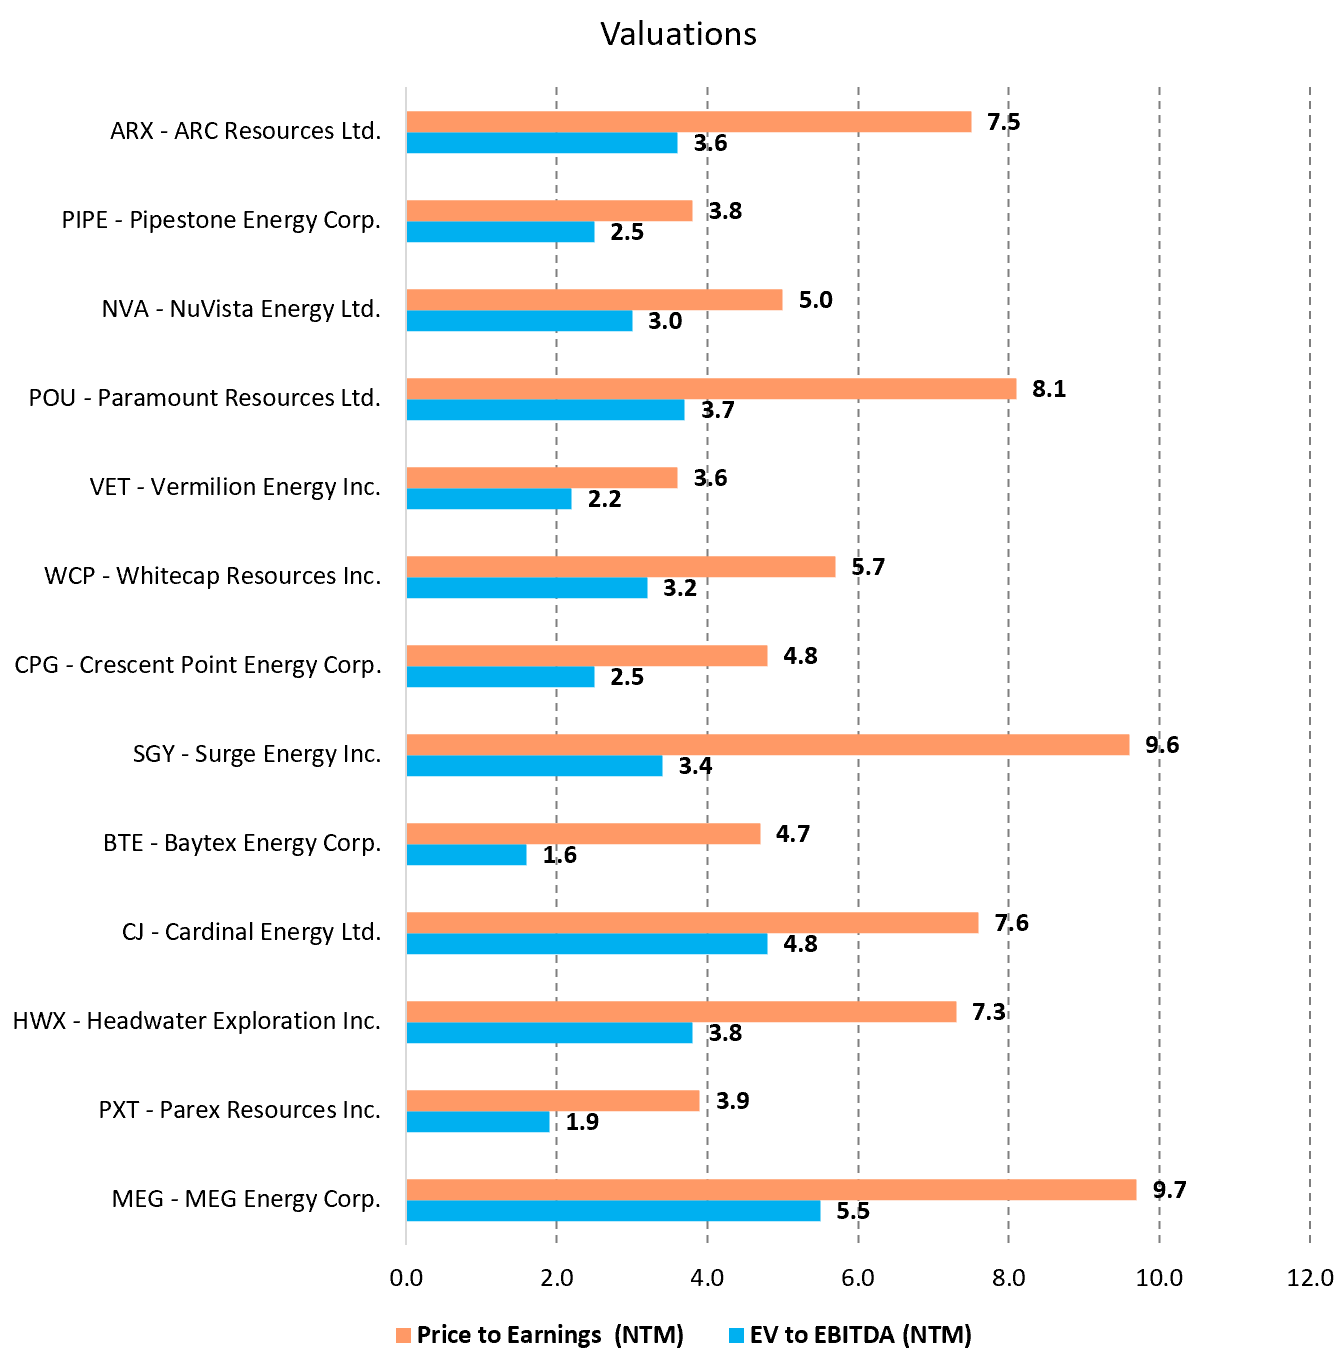
Figure 9 - Source: Koyfin
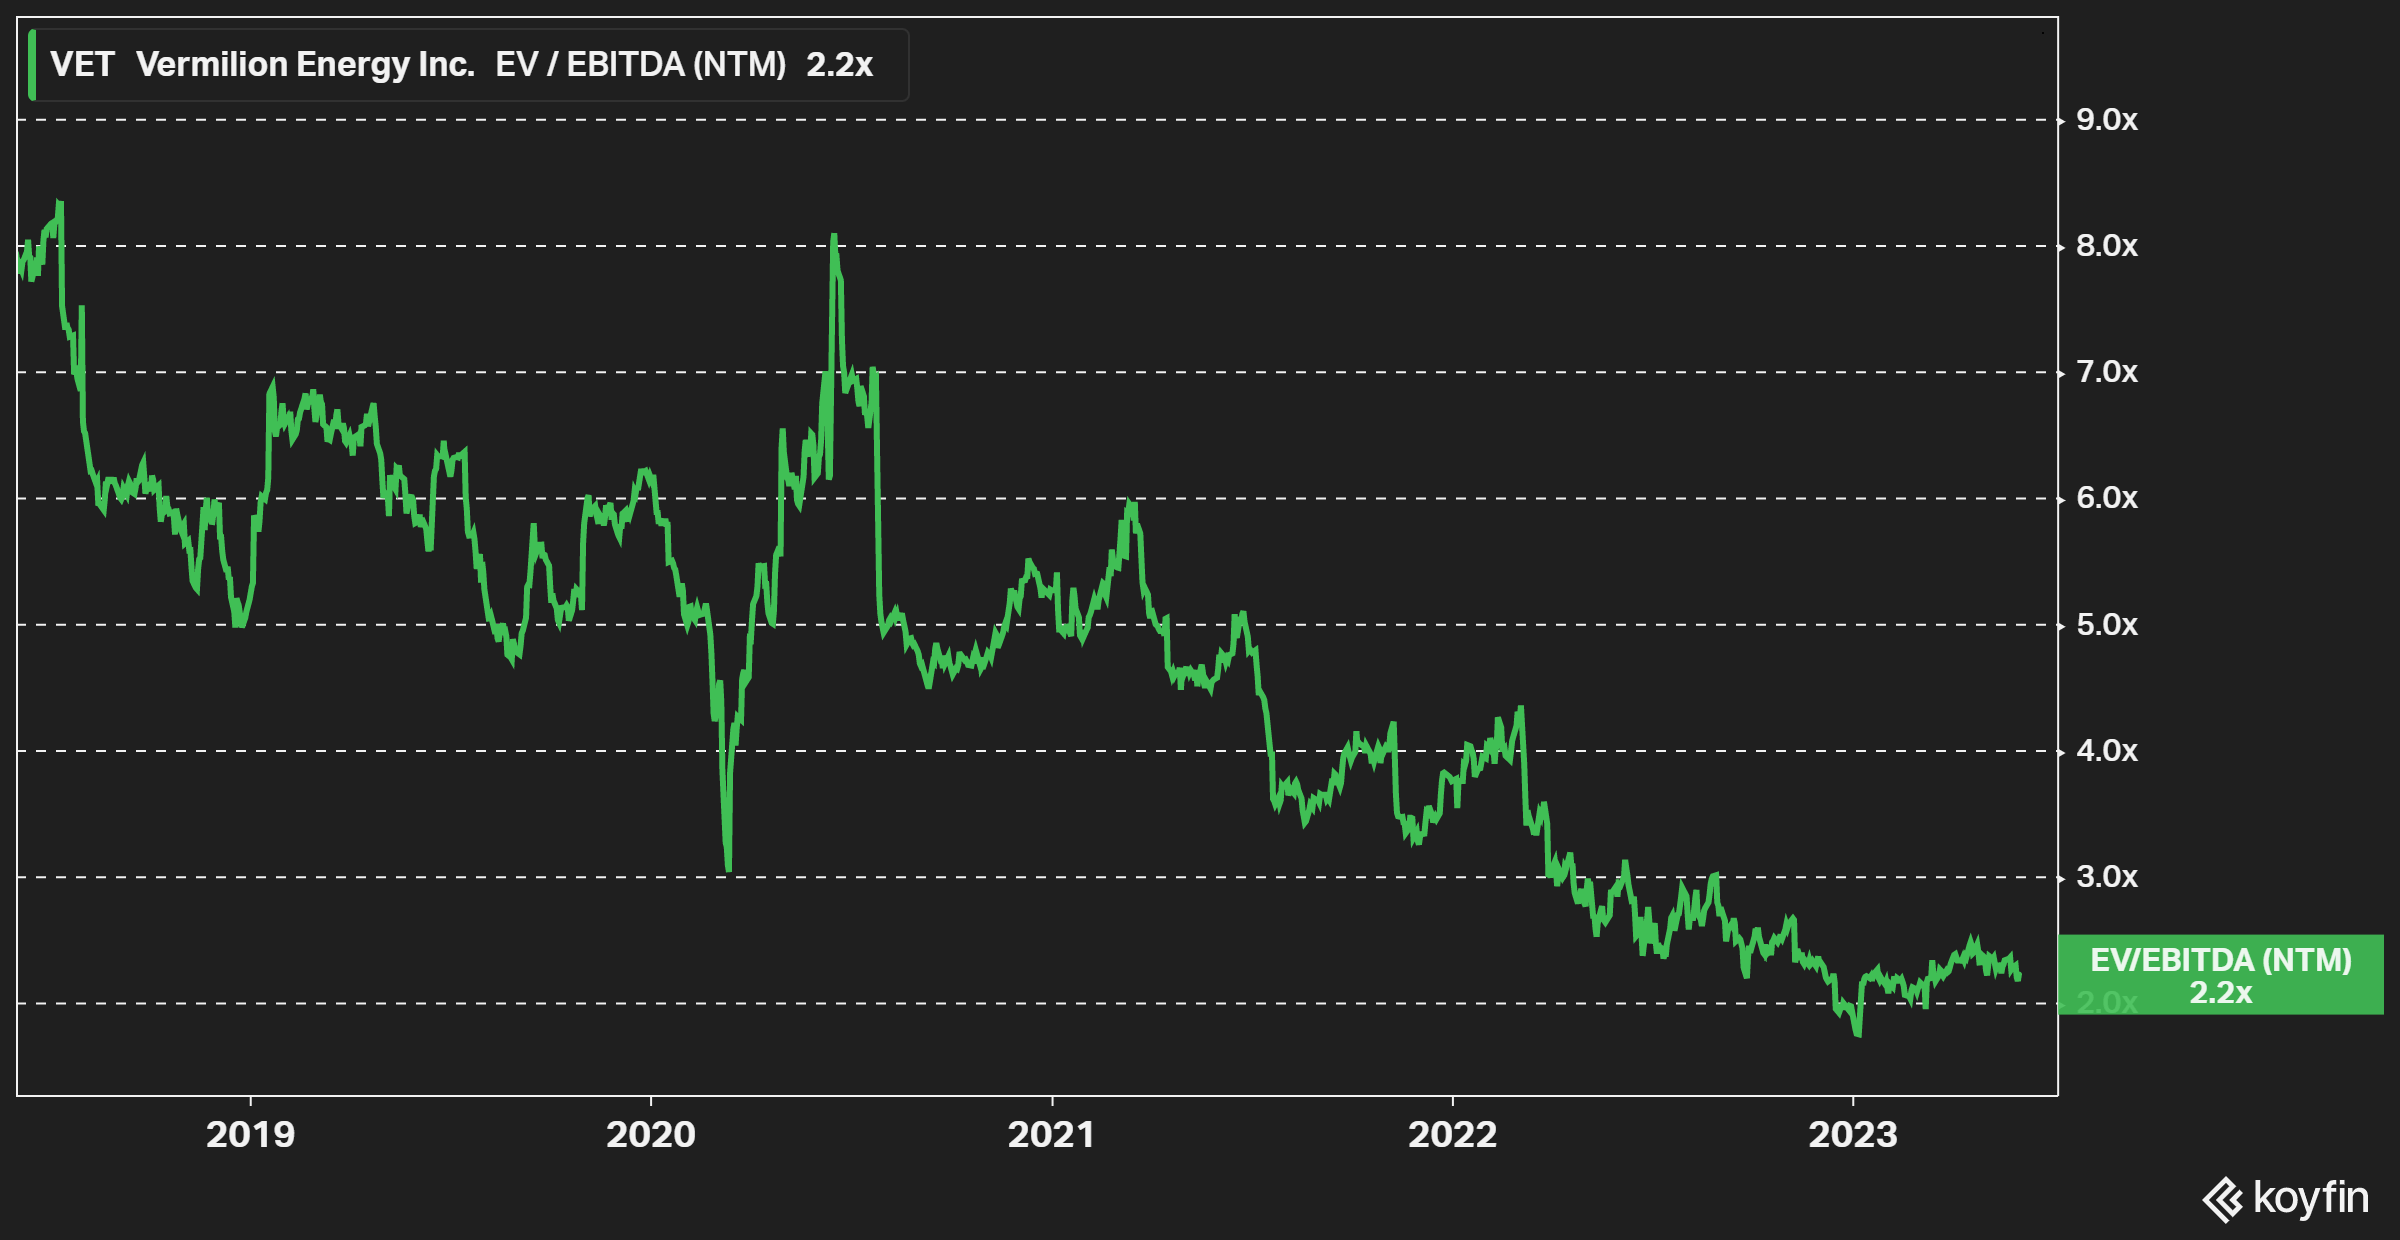
Figure 10 - Source: Koyfin
It remains to be seen what will happen with the European windfall profit taxes next year. The weaker the energy prices, the higher the likelihood of a rollback. That would naturally improve the profitability for Vermilion in 2024 and beyond. If we get another substantial energy price spike leading up to next winter, the probability is higher that some or all windfall profit taxes remain. While I strongly dislike the idea of punishing one specific industry arbitrarily, Vermilion should be able to thrive regardless of the outcome with the windfall profit taxes in the European Union.
If you like this article and is interested in more frequent analysis of my holding companies, real-time notifications on portfolio changes, together with macro and industry analysis. I would encourage you to have a look at my marketplace service, Off The Beaten Path.
I primarily invest in turnarounds in natural resource industries, where I have a typical holding period of 1-3 years. Focusing on value offers good downside protection and can still provide great upside participation. My portfolio generated a return of 81% during 2020, 39% in 2021, -8% in 2022, and is up 2% in March of 2023.
This article was written by

I enjoy my anonymity, which I think is underappreciated in today's world, where I write under the name Bang For The Buck. I hold a BSc and MSc in Financial Economics and I have extensive experience with the investment management industry. I am the CEO of a small investment company. I primarily focus on turnaround stories, with attractive valuations, in cyclical industries.
Presently, I am very focused on the precious metals industry due to current monetary and fiscal policies. I am also invested in the uranium and oil & gas industries, due to underinvestments together with very attractive valuations.
I publish regular articles on Seeking Alpha and offer an investing group service called Off The Beaten Path where subscribers receives real-time updates on the portfolio, in-depth portfolio reports, and frequent updates on holdings companies. As the name suggest, I primarily invest in industries and companies that are underappreciated, which I have found provides more attractive returns.
I am always happy to respond to comments and questions in my articles during the first few days. More in-depth and ongoing discussions are had inside Off The Beaten Path.
Analyst’s Disclosure: I/we have a beneficial long position in the shares of VET either through stock ownership, options, or other derivatives. I wrote this article myself, and it expresses my own opinions. I am not receiving compensation for it (other than from Seeking Alpha). I have no business relationship with any company whose stock is mentioned in this article.
Seeking Alpha's Disclosure: Past performance is no guarantee of future results. No recommendation or advice is being given as to whether any investment is suitable for a particular investor. Any views or opinions expressed above may not reflect those of Seeking Alpha as a whole. Seeking Alpha is not a licensed securities dealer, broker or US investment adviser or investment bank. Our analysts are third party authors that include both professional investors and individual investors who may not be licensed or certified by any institute or regulatory body.