Market
The Nifty50 extended losses for yet another session, but at the same time, the broader markets continued to outperform the benchmark index in both trading sessions, on June 1. Banking & financial services stocks continued to pressurise the market.
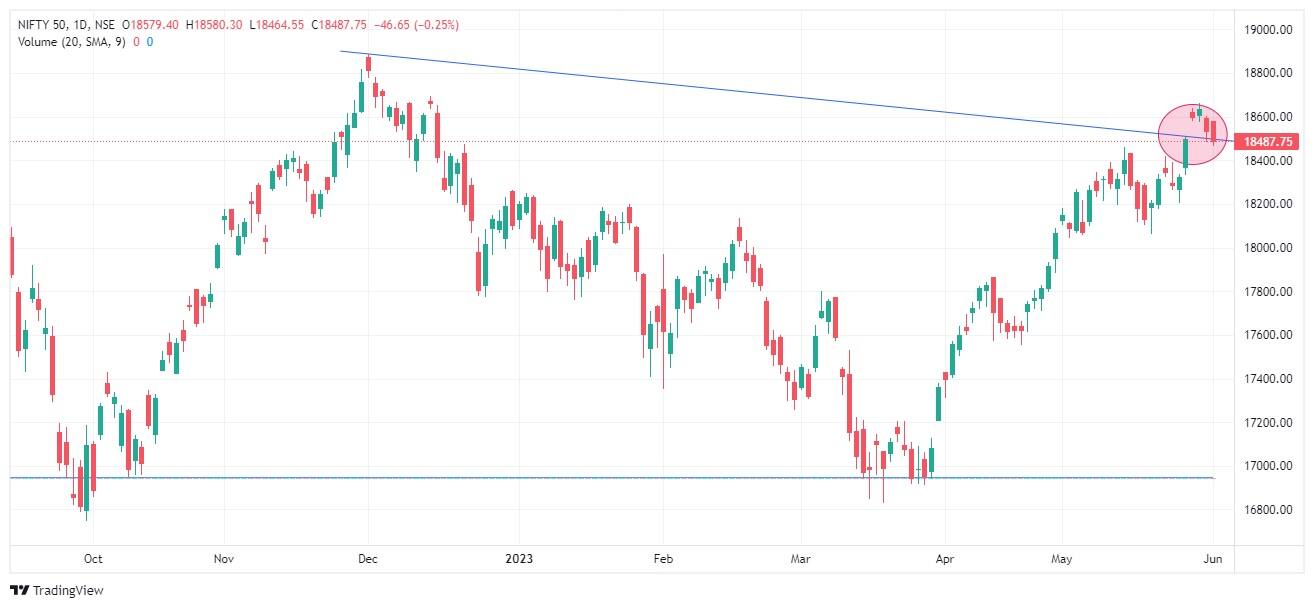
The index opened higher at 18,579.40, which was also its intraday high, and gradually lost momentum as the day progressed, to hit a day's low of 18,465 in late trade. Finally, the index settled at 18,488, down 46.6 points and formed a Bearish Belt Hold kind of pattern on the daily charts, which is a bearish reversal pattern indicating the possibility of a trend reversal from bullish to bearish but requires confirmation in the following session.
The pattern is formed when the opening price becomes the highest point of the day and the index declines throughout the session, making the large body. The candle will either have a small or no upper shadow and a small lower shadow.
The Nifty50 has broken its downward-sloping resistance trendline adjoining highs of December 1, 2022, and May 26, 2023, on the lower side and also closed below the bullish gap created on May 29. Hence if the index decisively breaks the 18,400-18,300 area in coming sessions, further selling pressure towards the 18,200-18,000 levels can be possible, whereas the 18,500-18,700 is expected to be the resistance area, experts said.
"Going ahead, this correction, whether in terms of time or price, may continue. Nevertheless, traders should bear in mind that the primary trend remains positive, and such corrections present opportunities to re-enter long positions," Rajesh Bhosale, Technical Analyst at Angel One said.
In terms of levels, he feels the current prices are situated at crucial support levels around 18,450- 18,400.
If there is any improvement in the global situation, the market ideally should rebound from these levels and regain 18,600- 18,700 and higher in the near term, however, breaching this support zone would shift the focus to the 20-day exponential moving average (20EMA), which previously served as strong support during the last correction, now acting as a critical level at 18,300, Rajesh said.
As per weekly Option data, 18,500 to 18,700 strikes owned the maximum open interest, which is expected to be a key hurdle area on the higher side, with meaningful Call writing at 18,500 strike. However, on the Put side, the maximum open interest was seen at 18,500 strike, followed by 18,400 and 18,300 strikes, with Put writing at 17,700 strike.
The above Option data clearly indicated that 18,500 is expected to be a crucial area for the direction on either side in coming sessions.
"The correction of the last few days should not be considered as a change in trend on the Index but rather a profit booking and a buying opportunity at the appropriate support level. The 18,000 to 18,300 demand band is currently a strong level of support for the index which should give a bounce to the index," Rahul Ghose, Founder & CEO at Hedged said.
Bank Nifty
Bank Nifty was also caught in a bear trap for the second straight session. The index opened higher at 44,172 but could not sustain those levels for long as it remained under pressure after the initial hour of trade and hit a day's low of 43,706. The index fell 338 points to 43,790 and formed a long bearish candlestick pattern on the daily charts making lower highs and lower lows formation.
"Selling pressure was observed from the resistance zone around 44,200, suggesting that sellers were active at that level," Kunal Shah, Senior Technical & Derivative Analyst at LKP Securities said.
He feels if the index sustains below the level of 44,000, it could indicate further downside potential. In such a scenario, the index may witness a decline towards the support zone around 43,500-43,400, he said.
The volatility also cooled down further to below 12 levels, so significant selling pressure is unlikely in the near term. Generally low level of volatility indicates a high level of confidence among market participants. India VIX, the fear index, fell by 3.13 percent to 11.60 levels, from 11.97 levels.
However, the Nifty Midcap 100 and Smallcap 100 indices continued to outperform benchmarks, rising 0.15 percent and 1 percent, respectively.
Disclaimer: The views and investment tips expressed by investment experts on Moneycontrol.com are their own and not those of the website or its management. Moneycontrol.com advises users to check with certified experts before taking any investment decisions.