Multiple-Sector Strength Says S&P 500 Could Move Higher

Summary
- S&P 500 sector trends are in better shape than most believe, with noticeable improvement in Communication Services, Consumer Discretionary, Industrials, and Consumer Staples.
- Consumer Discretionary XLY is in a position to possibly contribute in a more positive manner, and Information Technology XLK is not the only source of strength.
- Bearish wild cards include the potential liquidity drain from the U.S. government issuing new bonds and the possibility of a credit crunch and economic recession if the Fed continues to raise interest rates due to inflation.

matdesign24/iStock via Getty Images
Is It Really All Tech?
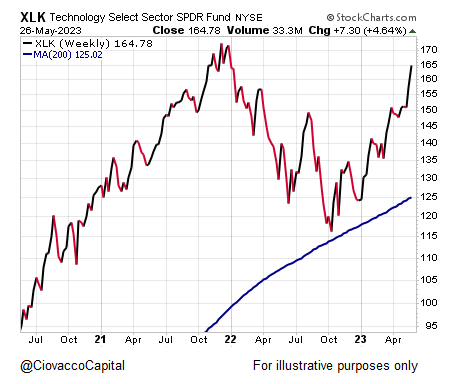
There is no question Information Technology (XLK) is the strongest sector of the market. Tech is being driven by numerous factors including AI growth opportunities and a lower vulnerability to a contraction in the availability of credit. Contrary to the “tech only” narrative, the S&P 500’s recent strength has been assisted by noticeable improvement in Communication Services (XLC), Consumer Discretionary (XLY), Industrials (XLI), and Consumer Staples (XLP).
What Moves The S&P 500?
Before we look at the longer-term health of each S&P 500 sector, it is helpful to review how each sector’s weighting impacts the performance of the S&P 500 ETF (NYSEARCA:SPY).
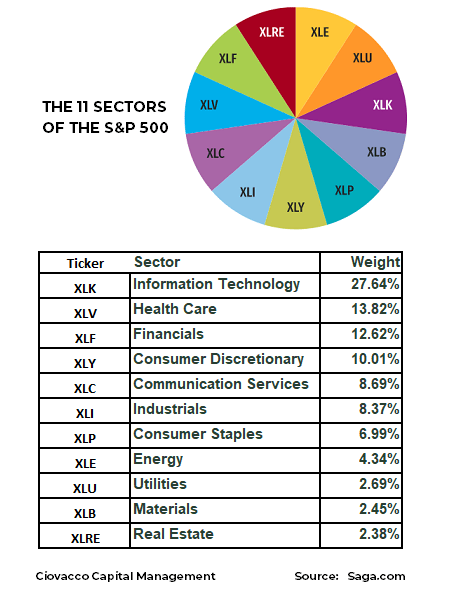
Saga.com Spider ETFs
The table below shows the health of S&P 500 sector trends in October 2022 (left) and May 2023 (right), illustrating discernable improvement relative to the odds of the current rally morphing into a sustained long-term uptrend.
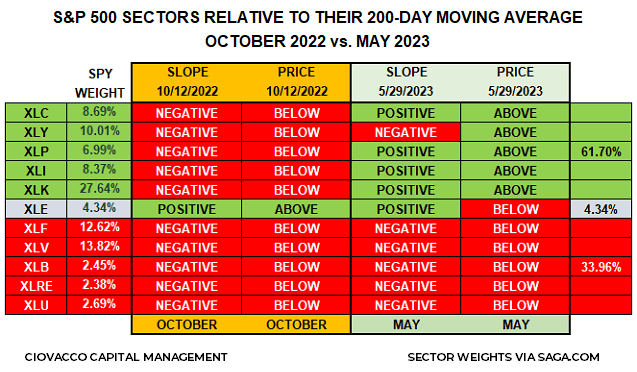
Ciovacco Capital
Lagging Trends In Defensive Sectors
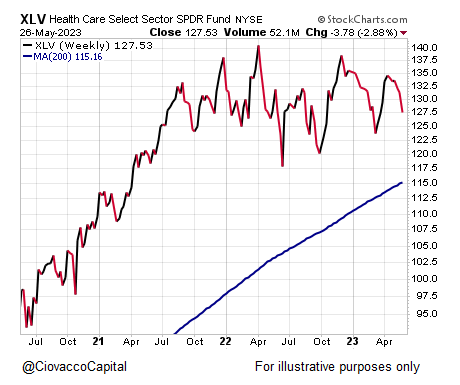
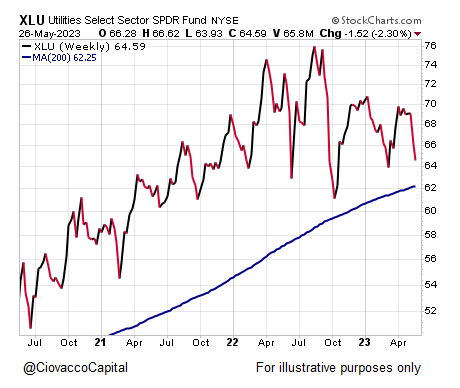
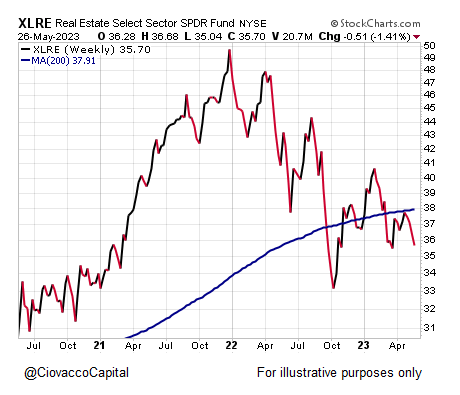
The red lower right portion of the table above shows S&P 500 sectors that remain relatively weak in 2023, including three sectors that tend to be defensive in nature, Health Care XLV, Real Estate XLRE, and Utilities XLU. The charts below show these defensive sectors have been weak relative to SPY, which speaks to improving risk appetite and waning concerns about a major earnings recession, a good sign for the S&P 500.
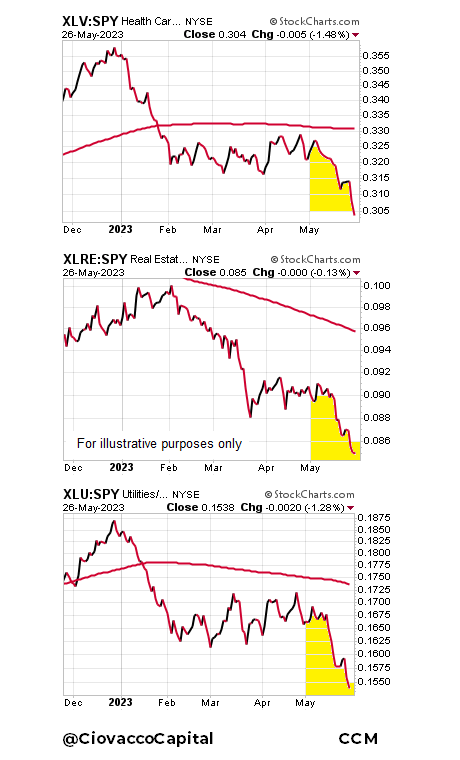
CCM (Ciovacco Capital) Stockcharts.com
66% SPY Weights Sunny to Partly Cloudy
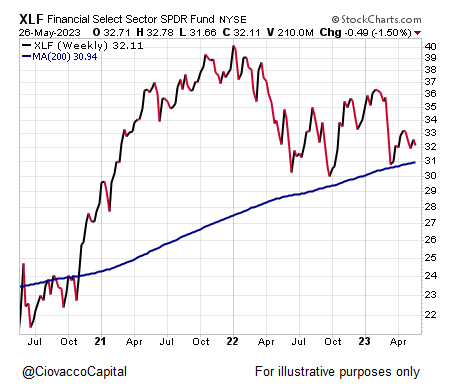
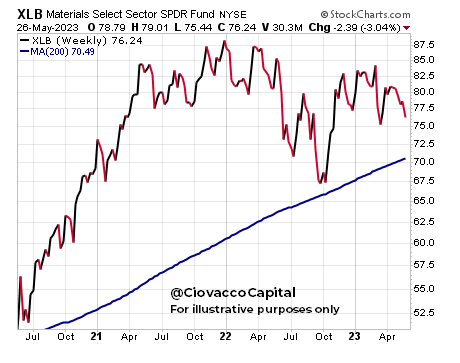
In terms of what moves SPY, 66% of the sector weightings are in good to pretty good shape from a trend perspective. Since XLB, XLRE, and XLU only carry a combined weighting of 7.52%, if the S&P 500 is going to show broader strength, it could come from Financials XLF (12.62%) and/or Health Care (13.82%). The sector with the most promising setup in terms of broadening the S&P 500’s advance may be Consumer Discretionary, which carries a weighting of 10.01%. In the XLY chart below, notice how the trends on multiple timeframes are converging in a favorable manner. The chart shows moving averages spanning from the 20-day to the 250-day. Even if XLY eventually breaks to the upside, some additional consolidation may be required. Regardless, the trend has improved significantly since the end of 2022, which does not align with the theory that we are still in a bear market and a recession is imminent.
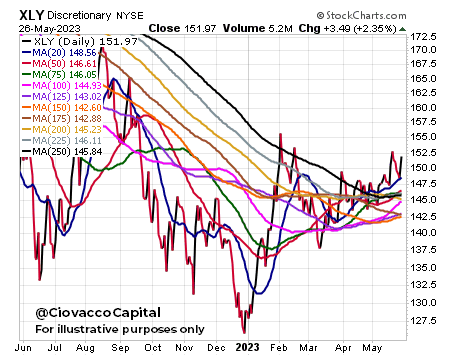
CCM (Ciovacco Capital) Stockcharts.com
Long-Term Trends
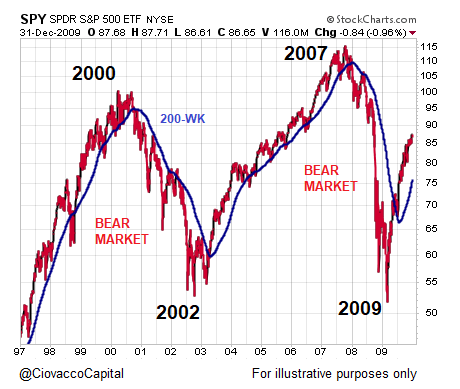
The 200-week moving average can be used as a secular trend reference point. As shown in the S&P 500 SPY chart below (1997-2009), when a position is above an upward-sloping 200-week moving average, it is in a long-term uptrend. Conversely, when a position is below a downward-sloping 200-week it is in a long-term downtrend.
CCM (Ciovacco Capital) Stockcharts.com
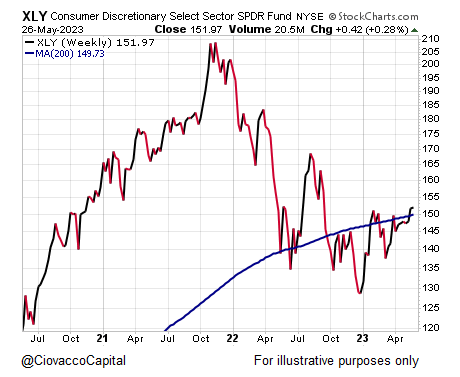
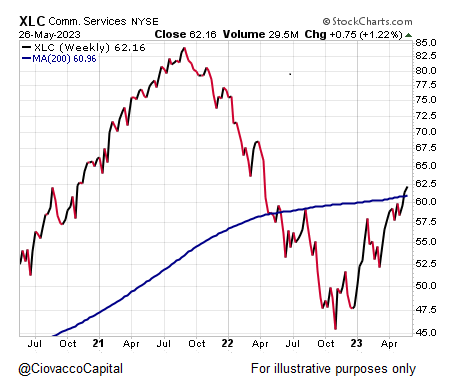
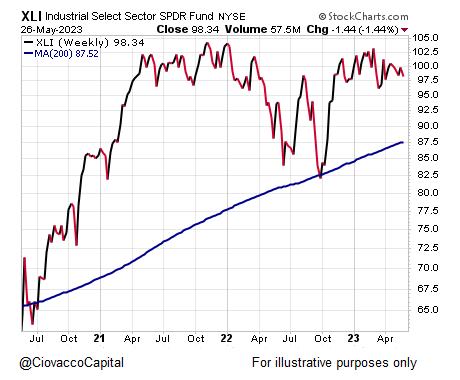
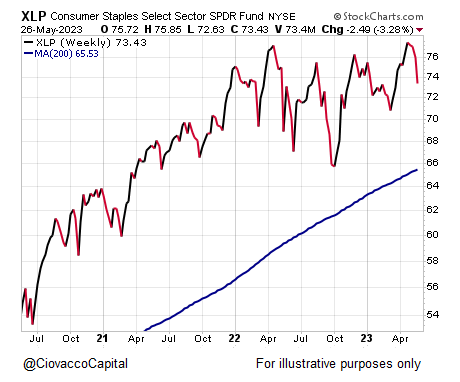
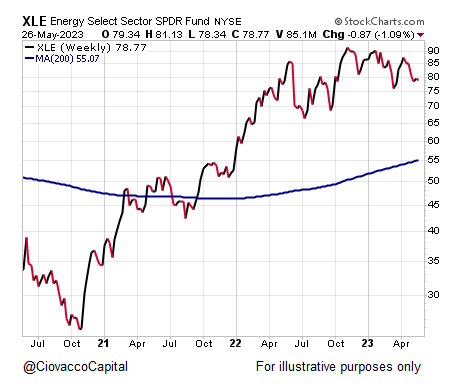
Health of S&P 500 is Better Than Many Believe
If the S&P 500 is going to morph into a 2008-like or 2002-like bearish trend, we would expect many S&P 500 sectors to be below or move below a downward-sloping 200-week moving average, similar to the look on the S&P 500 chart above during the two bear markets. How many S&P 500 sectors are currently trading below a downward-sloping 200-day moving average? The weekly charts of each S&P 500 sector are shown below:
CCM (Ciovacco Capital) Stockcharts.com
CCM (Ciovacco Capital) Stockcharts.com
CCM (Ciovacco Capital) Stockcharts.com
CCM (Ciovacco Capital) Stockcharts.com
CCM (Ciovacco Capital) Stockcharts.com
CCM (Ciovacco Capital) Stockcharts.com
CCM (Ciovacco Capital) Stockcharts.com
CCM (Ciovacco Capital) Stockcharts.com
CCM (Ciovacco Capital) Stockcharts.com
CCM (Ciovacco Capital) Stockcharts.com
CCM (Ciovacco Capital) Stockcharts.com
Key Points
The takeaways from the charts above are: (1) S&P 500 sector trends are in better shape than most believe, (2) if the S&P 500 is going to experience a devastating 2002 or 2008-like next leg down, significant deterioration must occur on the charts above, (3) the current charts tell us to be open to additional upside in the S&P 500 given the improvement since the 2022 low, (4) Consumer Discretionary XLY is in a position to possibly contribute in a more positive manner, and (5) Information Technology XLK is not the only source of strength.
The concepts above are best utilized in the context of a weight of the evidence approach. Additional insight into bull/bear odds can be found in a recent comparison between 2023 and 2002, 2008, 2011, & 2015.
Bearish Wild Cards
As outlined recently, the market appears to be in a better position in the current debt-ceiling window relative to the painful 2011 window. Having said that, once the debt ceiling has been lifted, the U.S. government will issue new bonds, which could put downward pressure on stocks due to a liquidity drain. If inflation continues down a sticky path, the Fed may have to continue to raise interest rates, increasing the odds of a credit crunch and economic recession. The charts presented above do not currently align with that type of bearish scenario. If the evidence shifts in a material manner, we must be willing to reassess the odds tied to negative outcomes.
This article was written by

Analyst’s Disclosure: I/we have a beneficial long position in the shares of SPY, XLK, XLI either through stock ownership, options, or other derivatives. I wrote this article myself, and it expresses my own opinions. I am not receiving compensation for it (other than from Seeking Alpha). I have no business relationship with any company whose stock is mentioned in this article.
Seeking Alpha's Disclosure: Past performance is no guarantee of future results. No recommendation or advice is being given as to whether any investment is suitable for a particular investor. Any views or opinions expressed above may not reflect those of Seeking Alpha as a whole. Seeking Alpha is not a licensed securities dealer, broker or US investment adviser or investment bank. Our analysts are third party authors that include both professional investors and individual investors who may not be licensed or certified by any institute or regulatory body.