3 Reasons To Consider Eastman Chemical Company

Summary
- Eastman Chemical Company's forward valuations don't capture the degree of superior operating leverage that is poised to come through over the next 2 years.
- EMN's dividend narrative is underappreciated.
- We like the risk-reward on the charts and are also encouraged with recent insider positioning.
imaginima/iStock via Getty Images
Introduction
The stock of Eastman Chemical Company (NYSE:EMN), a specialty materials enterprise, with a history of over 100 years, has been a source of pain for investors over the past year. Whilst the broader markets have managed to eke out low single-digit gains, EMN has lost its way, giving up over 23% of its market cap, and also underperforming its peers from the materials sector by roughly 2x.
YCharts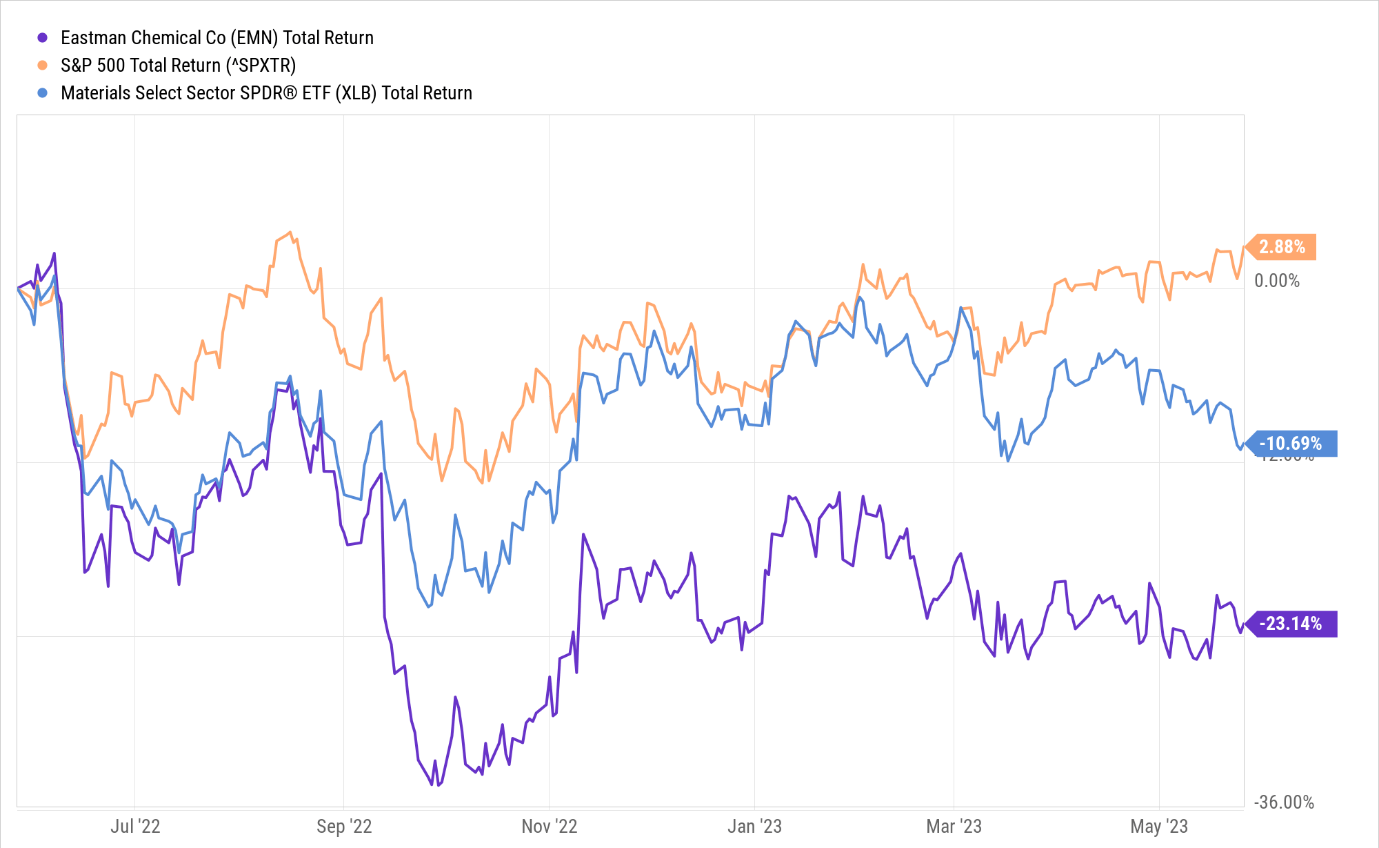
Eastman may not have the wind in its sails, but we've spotted a few silver linings which could help tilt sentiment more favorably toward the stock. Here, we provide three reasons why we think EMN should be considered at this point.
Forward Valuations Don't Adequately Reflect The Degree Of Superior Operating Leverage That Will Come Through Over The Next Two Years
As things stand, EMN continues to be hampered by customer inventory destocking activities in some of its key markets, such as durables, building & construction, personal care, water treatment, etc. Management pointed to the long supply chain in some of these end markets, the effects of which are likely to linger in Q2 as well.
EMN is also facing some market share challenges simply because they are refusing to play the pricing game (especially in markets where their Additives & Functional Products, and Chemical Intermediate divisions are exposed to). However, I believe once it can get FY23 out of the way, the outlook looks a lot more positive.
First, it's worth highlighting that even though EMN looks set to witness a topline decline of -3% in FY23, group operating margins this year are still poised to increase by 60bps to 17.8% and this is due to its unwillingness to not compromise on pricing. I believe it also helps that EMN is well exposed to lucrative segments within the auto market (15% exposure to the entire auto market, which is its largest market) such as premium EVs, where the opportunity to leverage its interlayer product portfolio is expected to be over 3.5x more than what it is with ICEs.
Q1 Presentation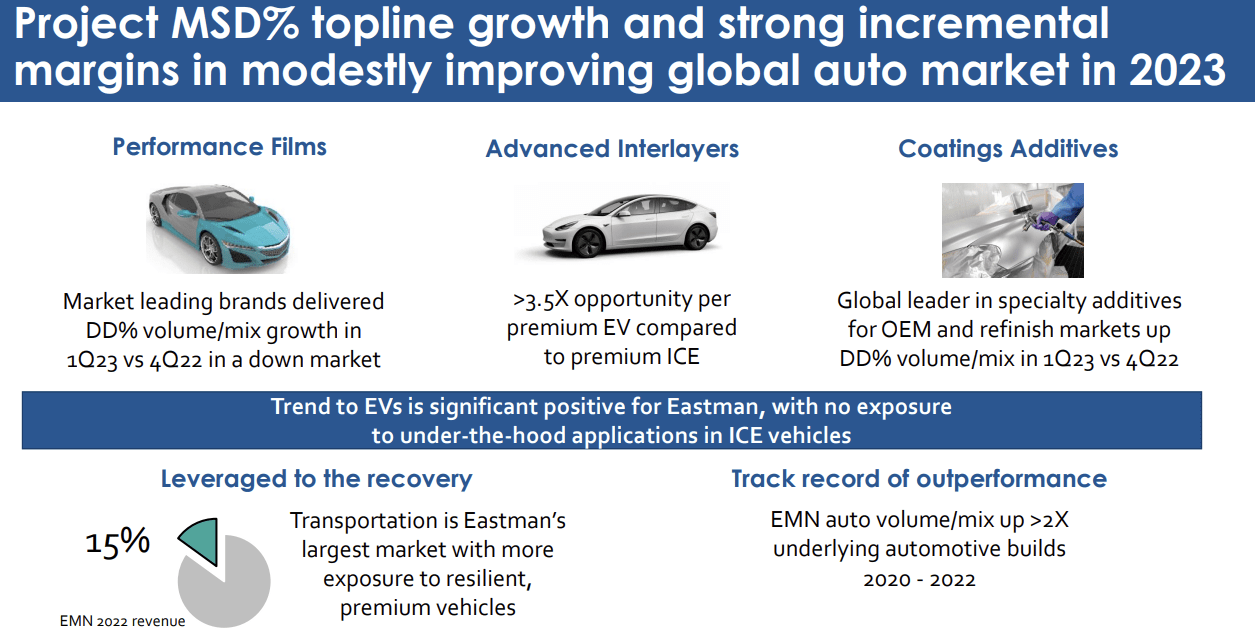
This positioning towards markets that have the appetite to digest premium pricing is reflected in the texture of sell-side estimates two years out (in FY24 and FY25). Note that over the next two years, EMN's EBITDA growth and EPS growth will likely come in at a much higher cadence than revenue growth (even as operating margins look set to improve by 150bps in aggregate over two years) highlighting the potential of operating leverage on the cards.
YCharts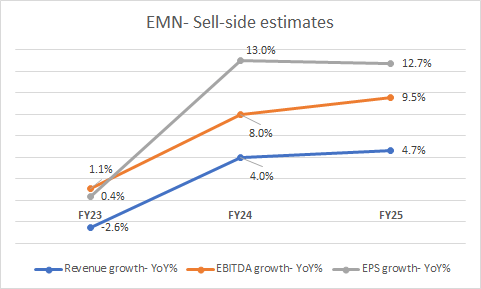
All in all, for a business that is poised to generate 13% earnings growth (on average) over the next two years, it doesn't quite feel right that it is only trading at 9.1x forward P/E (an implied Price to earnings growth ratio of just 0.69x). Besides, also note that this multiple represents a 21% discount to the stock's 5-year average P/E multiple of 11.52x!
YCharts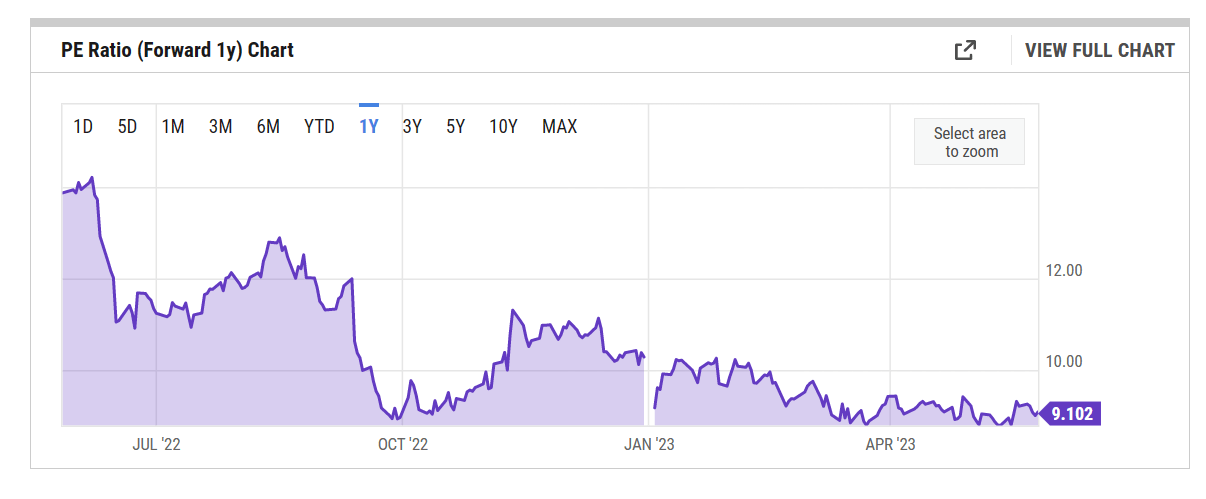
EMN's Ever-Present Dividend Sub-Plot Looks Even More Alluring After The Recent Correction
With investor attention primarily centered around weak demand and destocking effects, it's easy to forget the consistent dividend sub-plot associated with EMN. However, if one scrutinizes the company's "use of cash" policy in the Annual Report, it appears as though the priority first goes towards paying quarterly dividends, followed by M&A, buybacks, and debt pay downs.
Given the recent weak operating dynamics, some investors may be wondering if EMN will have enough in the tank to fund these dividends solely via internally generated cash flow (operating cash flow came in at negative $2m in Q1) but do also note that operating cash flow generation has traditionally proven to be more H2 weighted. In fact, despite the weak Q1, EMN management guided to FY23 operating cash flow of around $1.4bn which would represent very impressive growth of roughly 40% YoY from last year's level! When you consider that EMN's annual dividend cash outflow will likely be around $0.4bn, that's a pretty solid coverage of 3.5x
If we may shed more insight on EMN's dividend qualities, note that this is a business that has been distributing dividends for 28 years now (and growing it for 13 straight years), whilst most companies from the materials universe have been doing so for just eight years or so. Meanwhile also note that out of the 46 specialty chemical stocks covered by Seeking Alpha, only 61% of these names pay dividends.
Interestingly enough, EMN's payout levels (the 4-year average is 37% whilst most recently it has been 42%) too are typically more generous than what other specialty chemical entities pay (4-year average of ~30%, and a recent average of 33%).
Then, over the last five years, EMN's yield has averaged less than 3% (2.95% to be precise), but currently, you can pocket a figure that is around 80-90bps higher than the historical average. This figure could serve as a useful cushion in case you face further drawdowns.
YCharts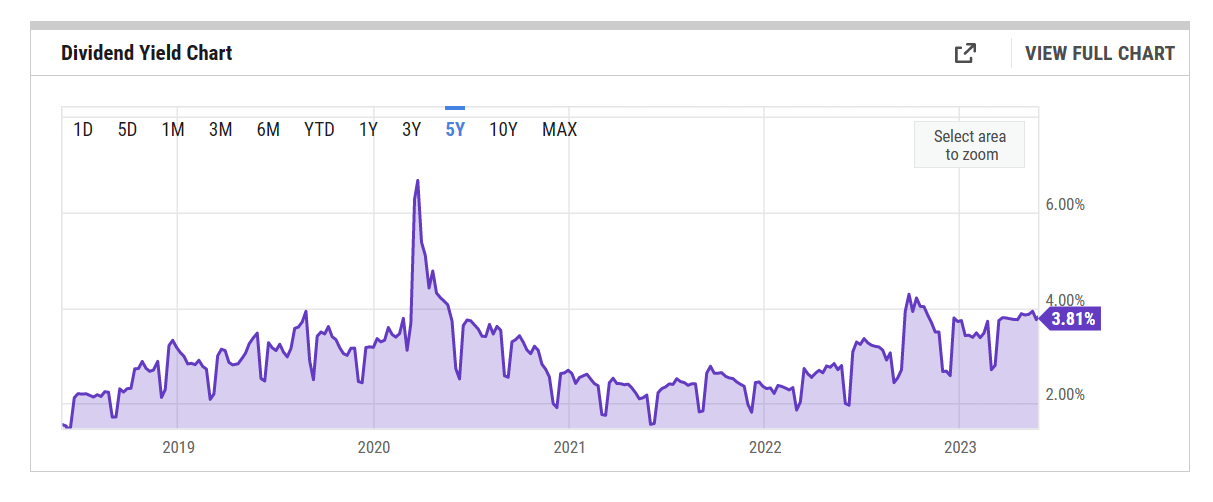
Crucially, also consider that EMN's current forward yield is almost 180bps superior to the average yield (2.08%) available on other specialty chemical stocks that pay dividends.
Good Risk-Reward On The Charts, Backed By Decent Insider Support
StockCharts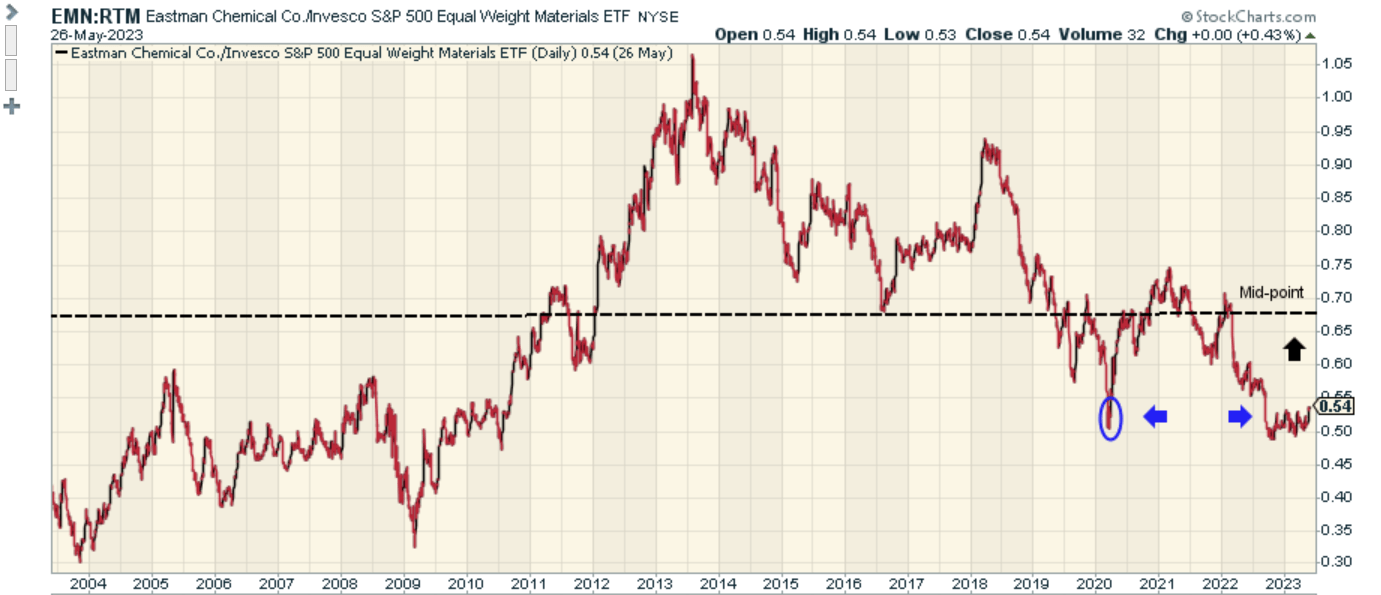
Just over 10 years ago, EMN's strength relative to its material peers in the S&P500 had peaked; since then, we've seen a slow drift over the years as other names have received more attention, even as EMN lost its clout. During the pandemic lows, this relative strength ratio had fallen below the mid-point of the long-term range and bottomed out at the 0.5 levels before bouncing back sharply. Once again, we're witnessing something similar with this ratio flattening out at the 0.5 levels in recent weeks, positioning EMN nicely to benefit from some mean-reversion momentum going forward.
Investing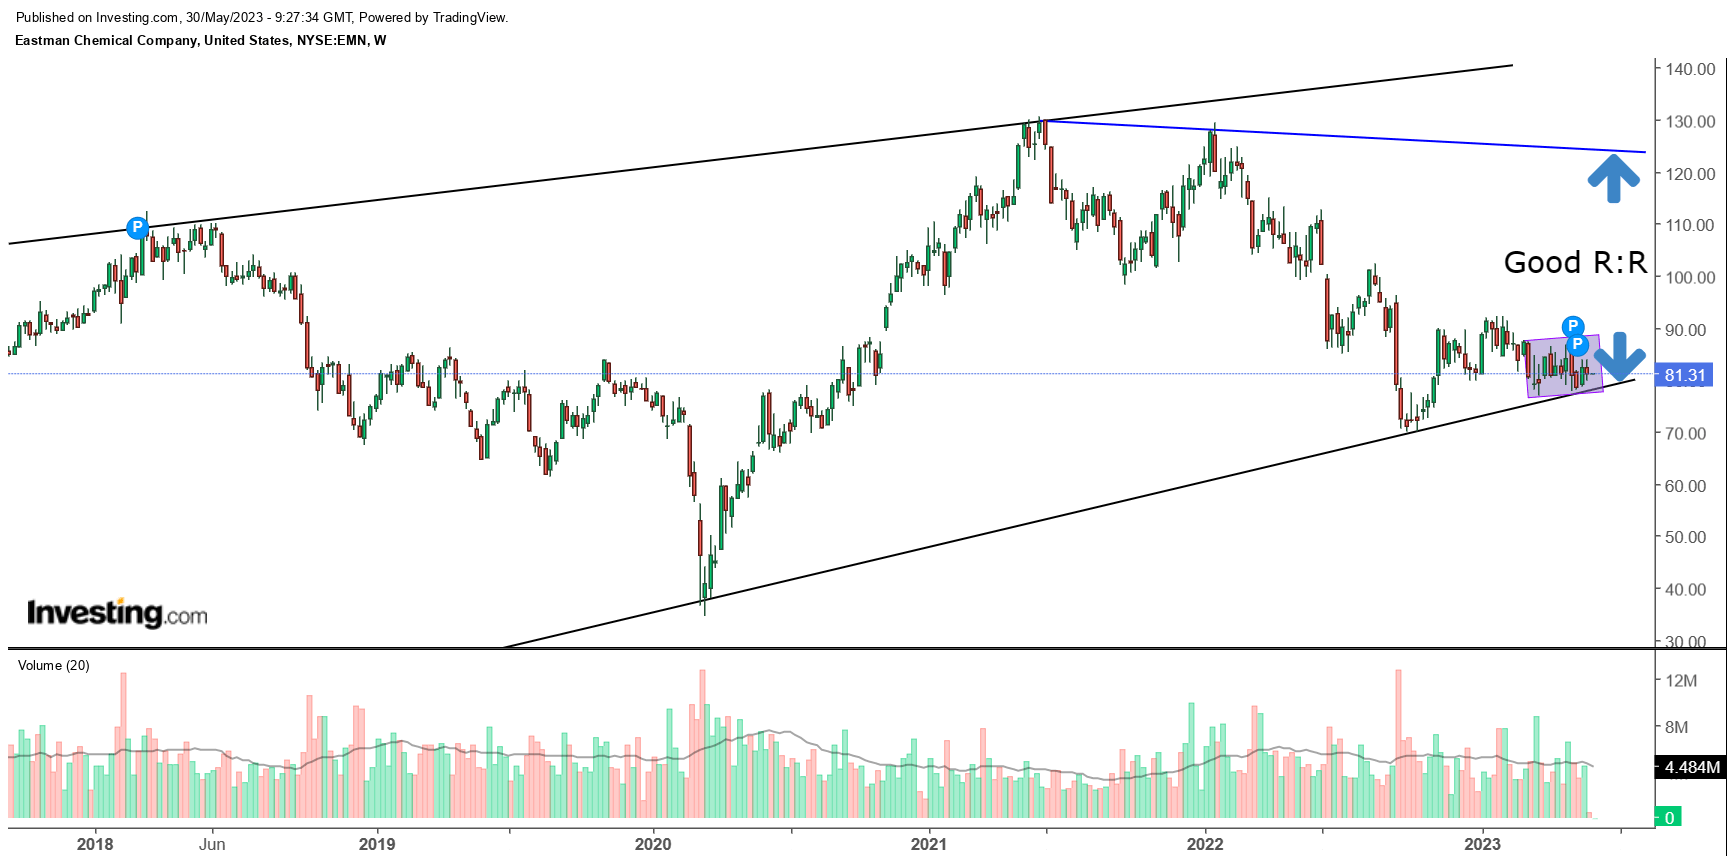
Then, if we study EMN's long-term price imprints on the weekly chart, we can see that it has been chopping along within a broad ascending channel, with the price currently taking support at the lower boundary of the channel. Since March, we've also seen the stock build a base around the $76-$86 range, which would provide an ideal terrain to get in for those considering a long position.
Nasdaq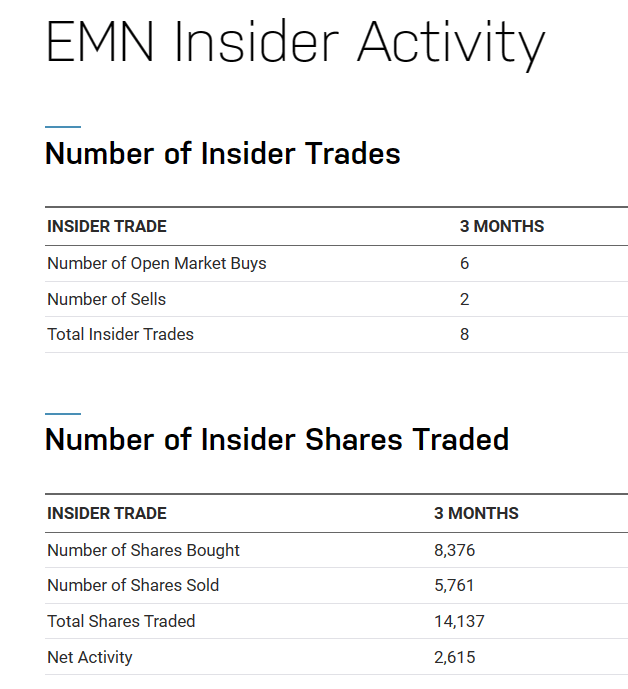
Interestingly enough, it appears as though notable insiders have been using the recent flattening of the price action to increase their stake. For context, 75% of the total insider trades carried out over the past three months were open market buys, with 60% of these shares traded, accounting for share purchases, rather than share sales.
This article was written by

Analyst’s Disclosure: I/we have no stock, option or similar derivative position in any of the companies mentioned, and no plans to initiate any such positions within the next 72 hours. I wrote this article myself, and it expresses my own opinions. I am not receiving compensation for it (other than from Seeking Alpha). I have no business relationship with any company whose stock is mentioned in this article.
Seeking Alpha's Disclosure: Past performance is no guarantee of future results. No recommendation or advice is being given as to whether any investment is suitable for a particular investor. Any views or opinions expressed above may not reflect those of Seeking Alpha as a whole. Seeking Alpha is not a licensed securities dealer, broker or US investment adviser or investment bank. Our analysts are third party authors that include both professional investors and individual investors who may not be licensed or certified by any institute or regulatory body.