HIBL: Technology Fund In Disguise

Summary
- HIBL provides 3x 1-day returns of the S&P 500 High Beta Index.
- Daily rebalancing of exposures can introduce significant tracking errors over the long run.
- The HIBL is really just a technology fund in disguise, as 45% of the underlying index is invested in the technology sector.
- Given my concerns regarding the emerging AI bubble, I will pass on the HIBL ETF.
Claudiad
I came across the Direxion Daily S&P 500 High Beta Bull 3X Shares ETF (NYSEARCA:HIBL) while screening for top performing funds that were not related to information technology. While I appreciate the transformative impact of artificial intelligence ("AI"), I feel the whole area had become highly speculative with 'bubble-like' qualities and I do not wish to invest in bubbles.
However, after further analysis, I believe the HIBL's outperformance is really derived from the fund's 45% weight in the technology sector combined with positive convexity from its levered ETF structure. The HIBL ETF is a pass for me.
Fund Overview
The Direxion Daily S&P 500 High Beta Bull ETF seeks daily returns that are 3x the return of the S&P 500 High Beta Index ("SP5HBIT Index"). Beta measures the volatility of an individual stock compared to the market. The SPHBIT Index selects 100 securities from the S&P 500 Index that have the highest 'beta' over the past 12 months.
The HIBL ETF achieves this 3x levered return by holding the stocks underlying the SP5HBIT Index and entering into total return swaps with the large investment banks that are reset nightly (Figure 1).
Figure 1 - HIBL partial list of holdings (Author created with data from direxion.com)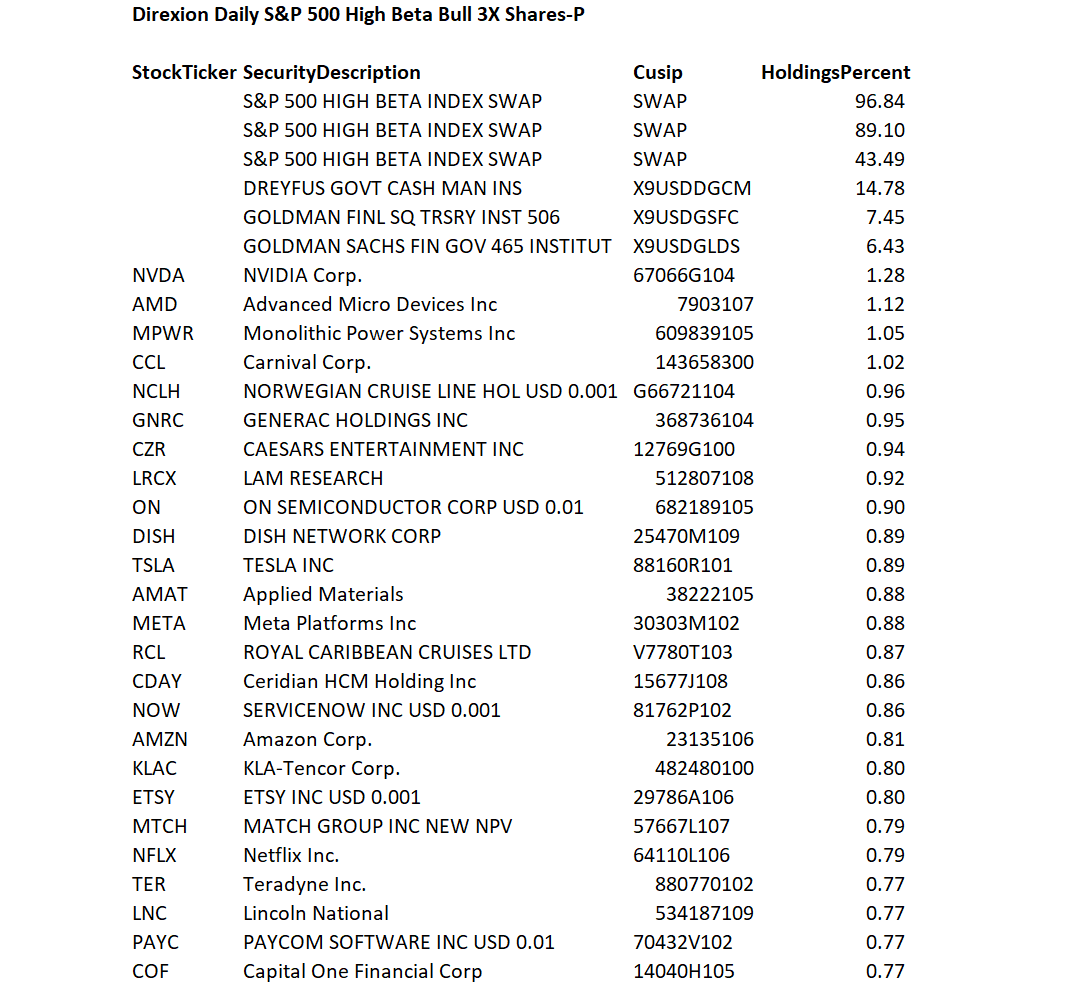
Risks With Levered ETFs
First, before proceeding further, I must go over the risks of investing in levered ETFs for those not familiar. Levered ETFs like the HIBL only work as intended (provide 3x exposure) on short time-horizons. When we look beyond the 1-day horizon, volatility and convexity will introduce tracking error.
For example, if we started off with $100 invested in HIBL, if the SP5HBIT Index returned 3% on day 1, the position will grow to $109 (3 times 3% return). If the index returns 3% again on day 2, the position will grow to $118.81, more than three times the theoretical 2-day compounded return of 18.27% or $118.27. This difference is due to the 'positive convexity' of levered ETFs in the direction of the bet; i.e. the daily reset feature keeps increasing our exposure when the trad is going our way.
Conversely, if the returns were consecutive -3% on the index, our initial investment will end up at $82.81, versus three times the 2-day compounded loss of 17.73% or $82.27. Positive convexity can help reduce declines if the bet goes against us.
In the case of a +3% return followed by a -3% return, investors end up with $99.19, significantly less than the three times the 2-day compounded loss of 0.09% or $99.73. This is 'decay' from volatility.
Traders considering levered ETFs need to keep in mind 'positive convexity' and 'volatility decay' when making their investment decisions.
Levered Long ETFs As Medium-Term Plays
While levered ETFs suffer from 'volatility decay', some traders like to utilize them for 'swing trading' precisely because of their positive convexity. For example, if we look at the returns of the HIBL ETF compared to the returns of the Invesco S&P 500 High Beta ETF (SPHB), an ETF that is based on the same underlying index, we can see that from the end of March 2020 until the end of November 2021, the HIBL ETF delivered an incredible 905% total return, more than 5x the 168% return of the SPHB ETF (Figure 2).
Figure 2 - Positive convexity in action (Seeking Alpha)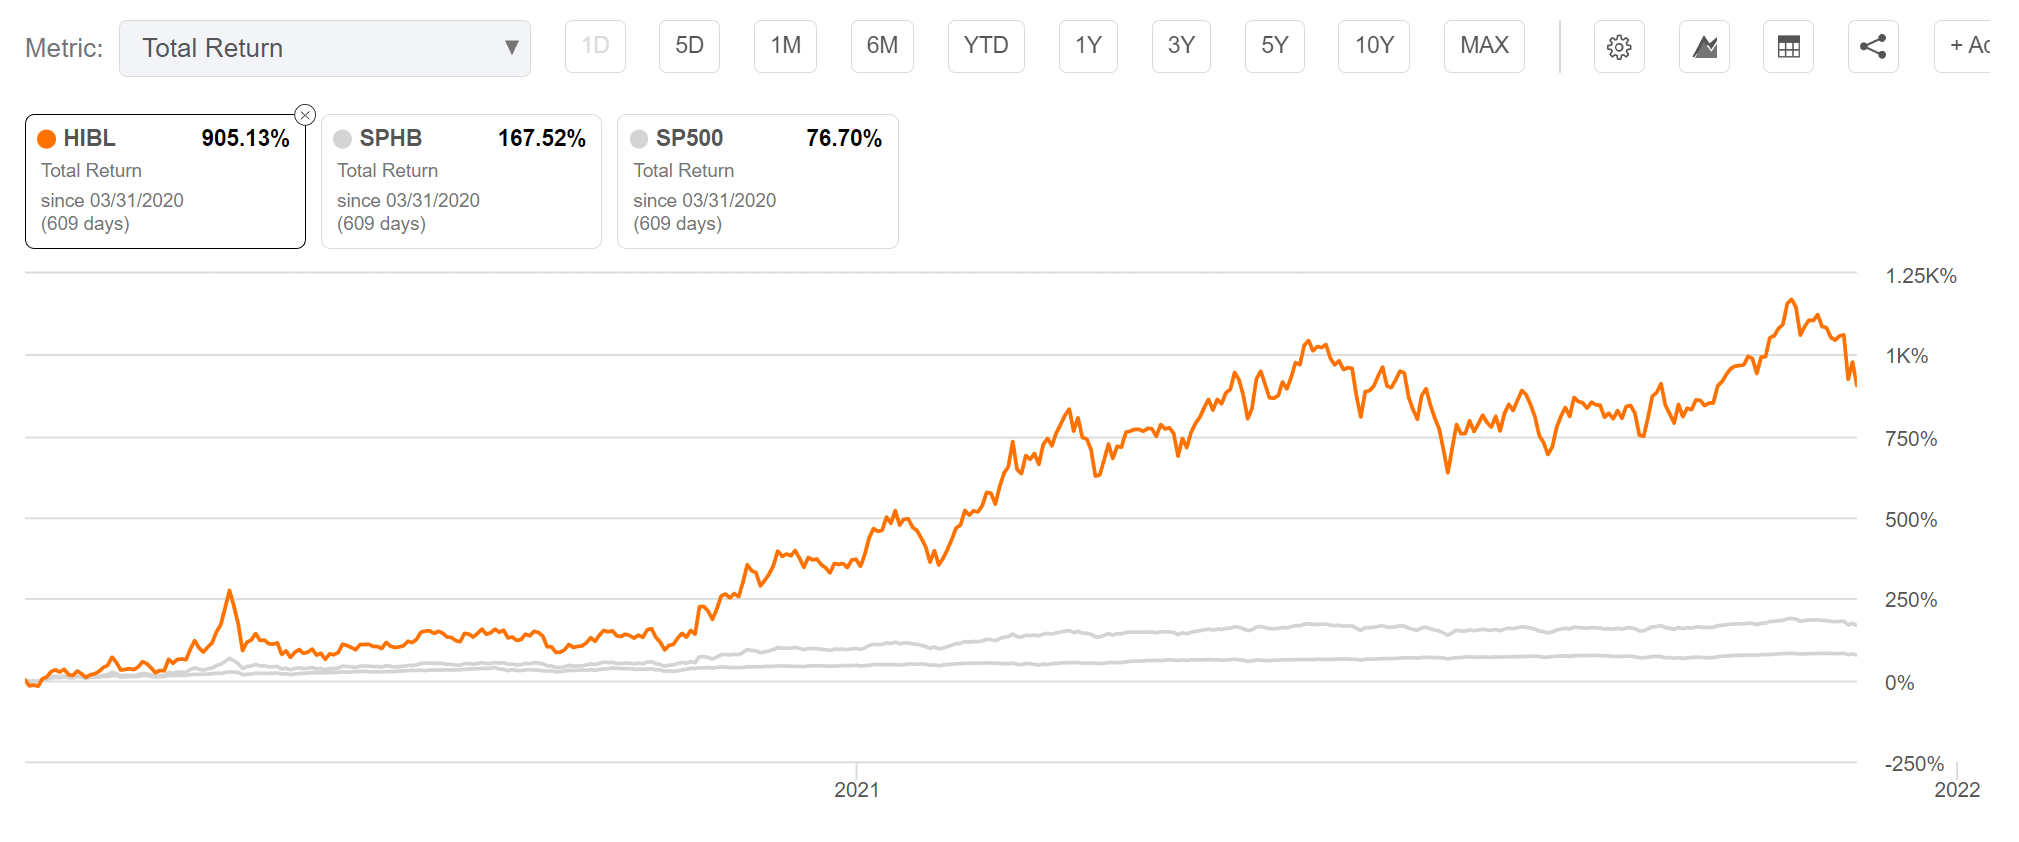
The challenge, of course, is to figure out when to take profits on these 'swing trades', as the position size can grow very quickly on levered ETFs and if profits are not taken, they can disappear very quickly on pullbacks because the drawdowns are also magnified.
For example, within the incredible 900% run-up in HIBL in Figure 2, the HIBL ETF suffered many 30%+ drawdowns, including a 57% drawdown in the span of a month in June 2020 (Figure 3).
Figure 3 - Profits can disappear quickly on levered ETFs (Seeking Alpha)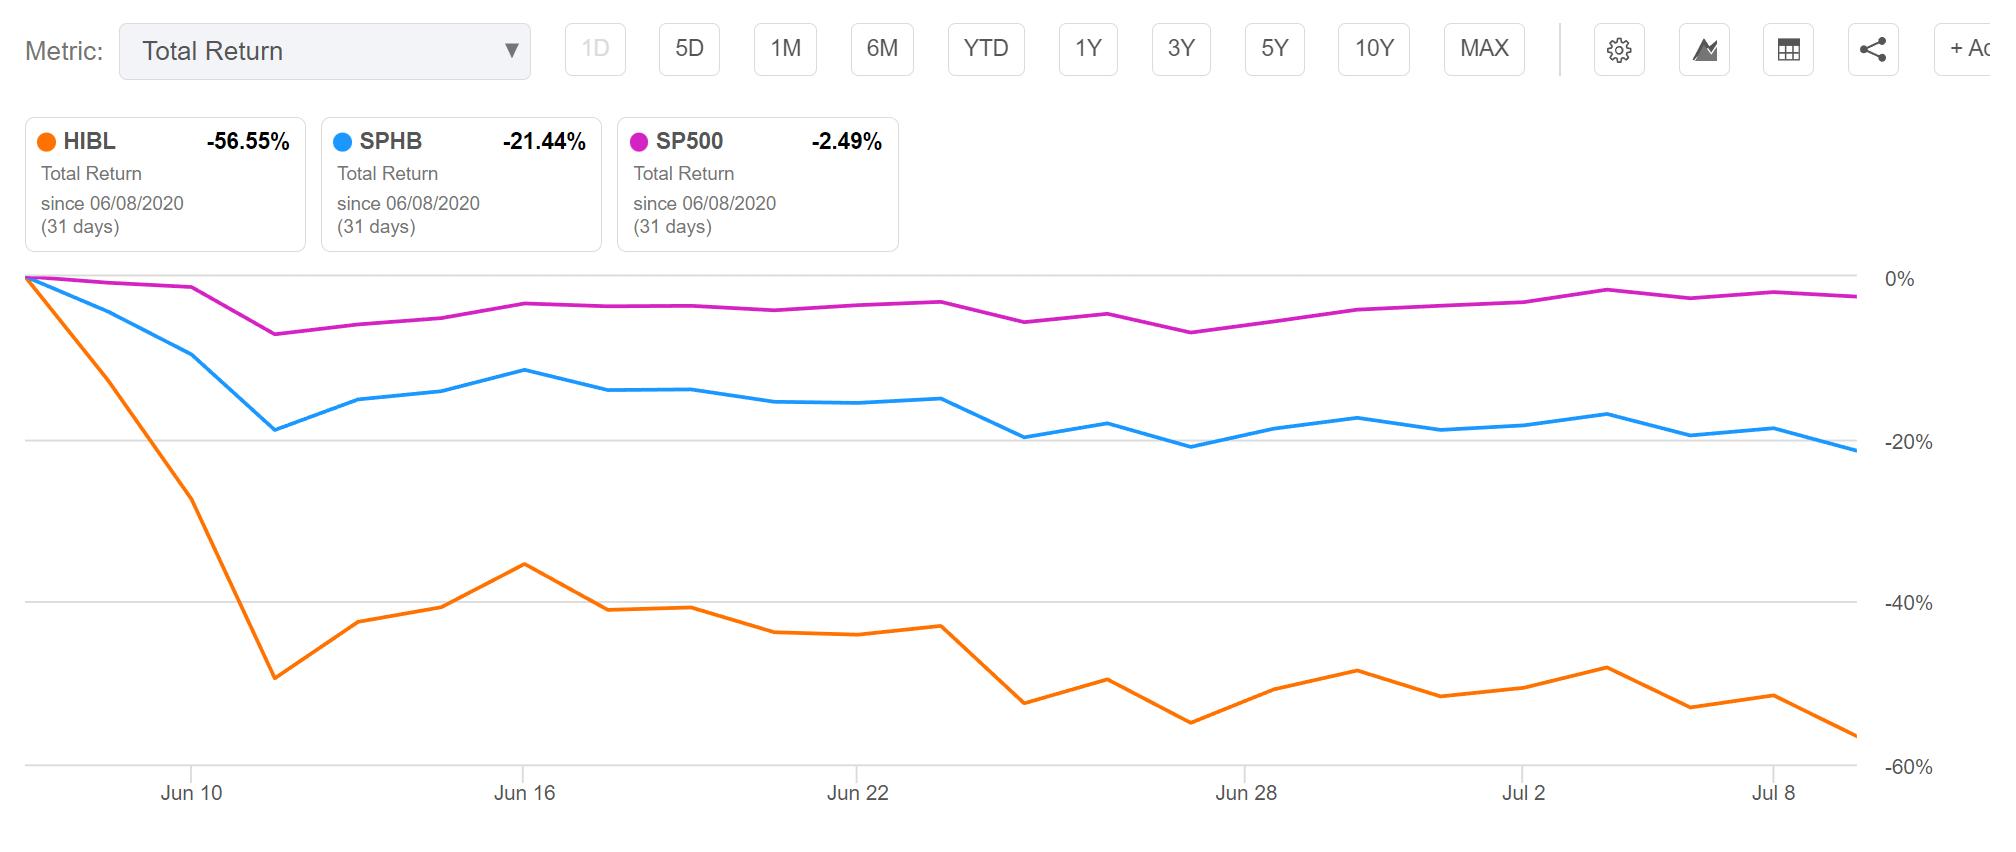
Technology Fund In Disguise
Returning to the main reason for my article, why did the HIBL ETF perform so strongly in recent days while many non-technology related sector ETFs that I monitor are trading at or near their 2023 lows (Figure 4)?
Figure 4 - Many non-technology related sectors are trading at or near 2023 lows (stockcharts.com)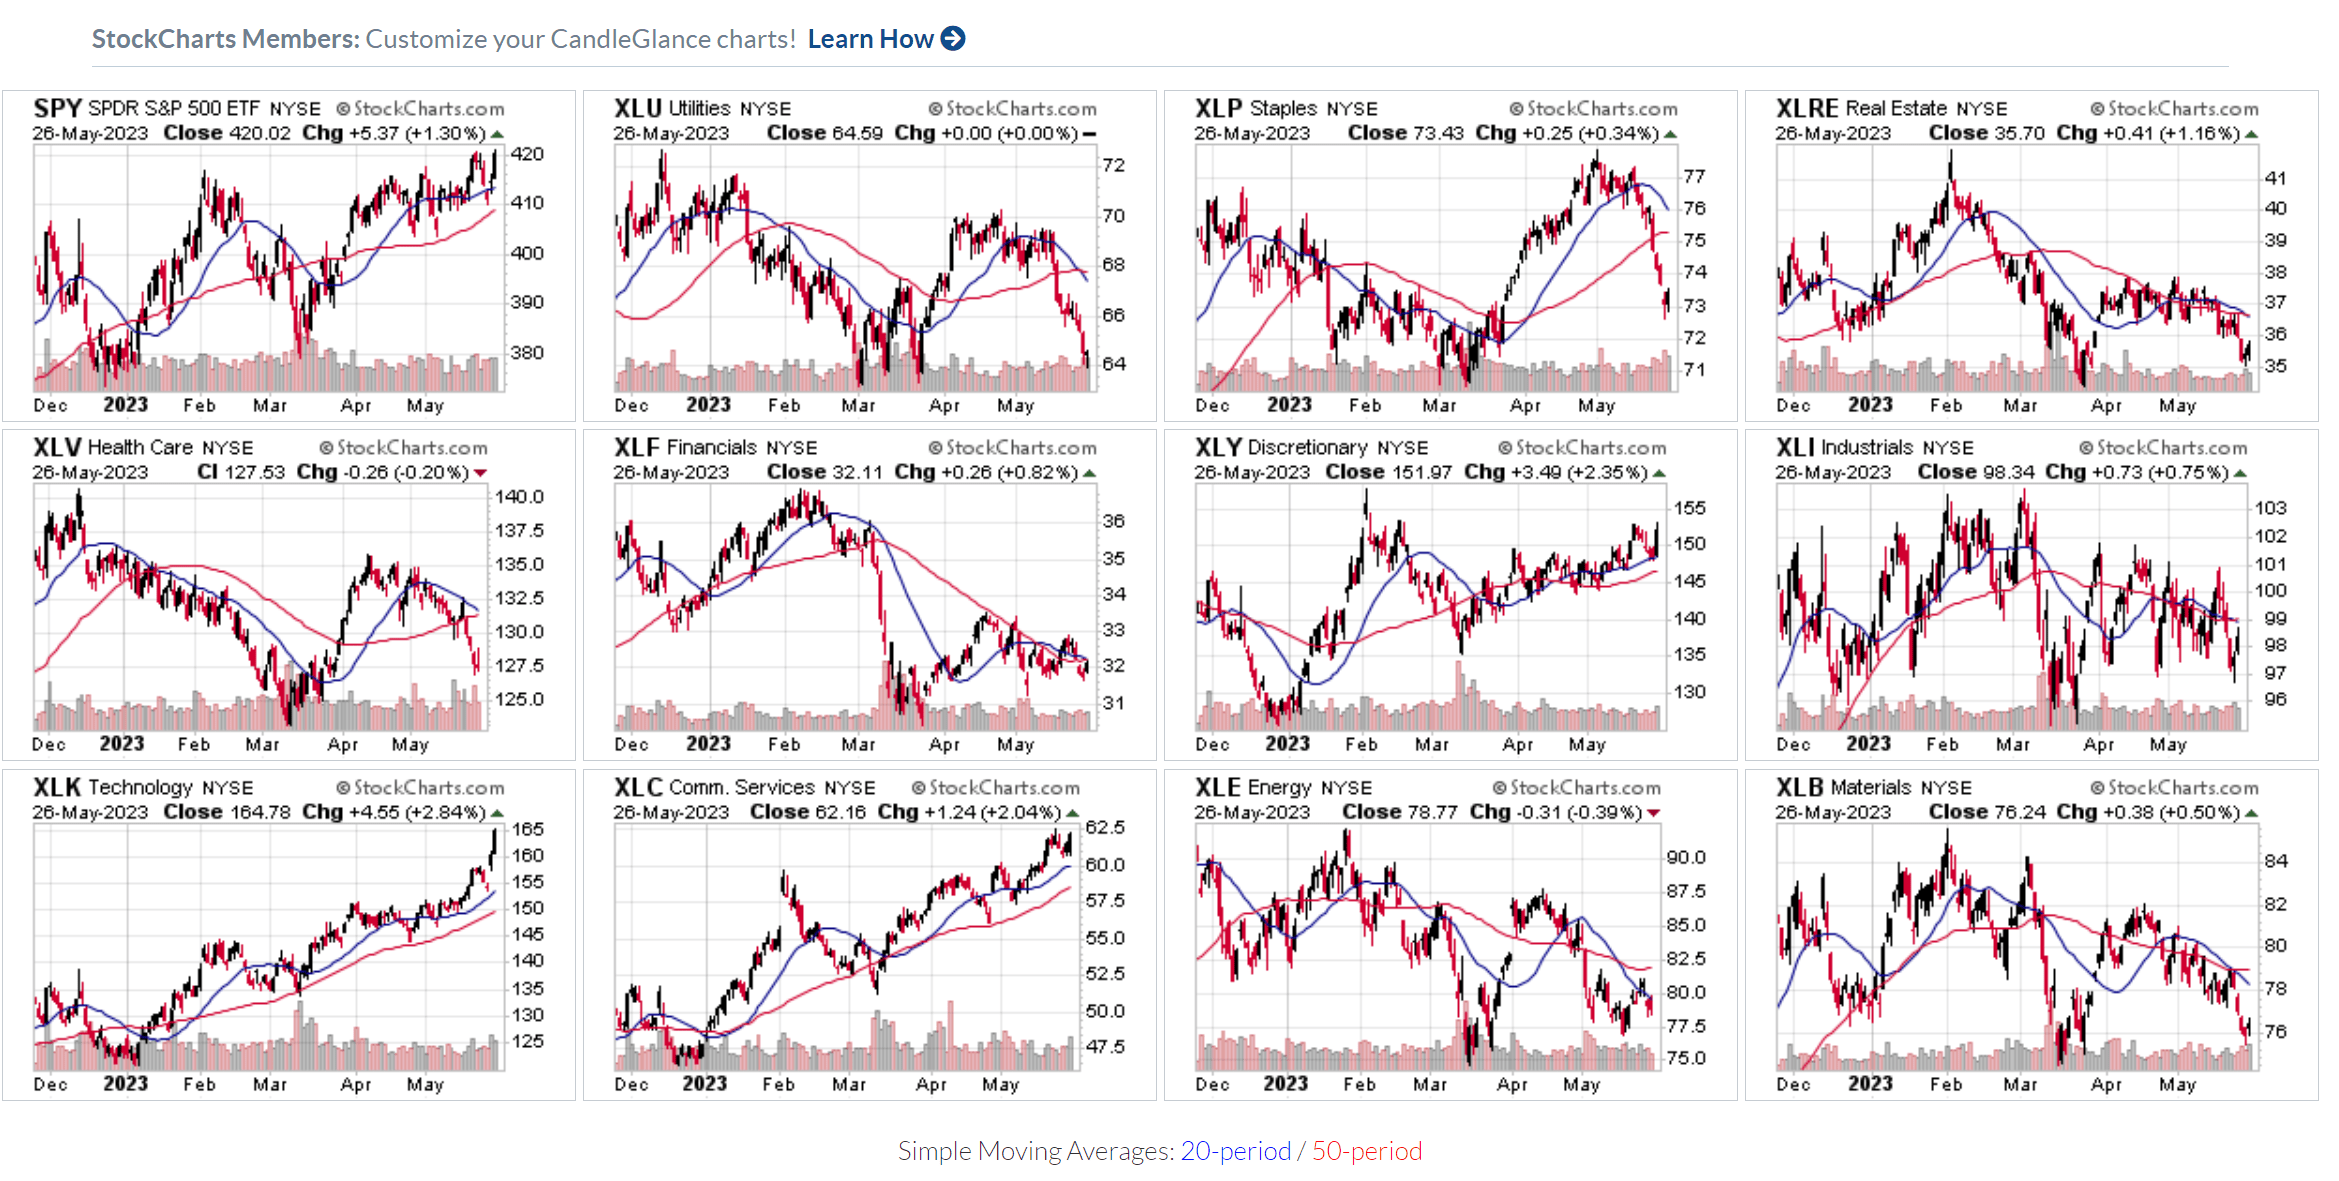
Looking at the composition of the underlying SP5HBIT Index, I believe the reason is that the HIBL ETF is actually a closet technology fund. Although the index is designed to capture 'high beta' stocks, it actually has a 45.1% sector weight in Information Technology and a 23.3% sector weight in Consumer Discretionary (Figure 5).
Figure 5 - HIBL index top holdings and sector allocation (direxion.com)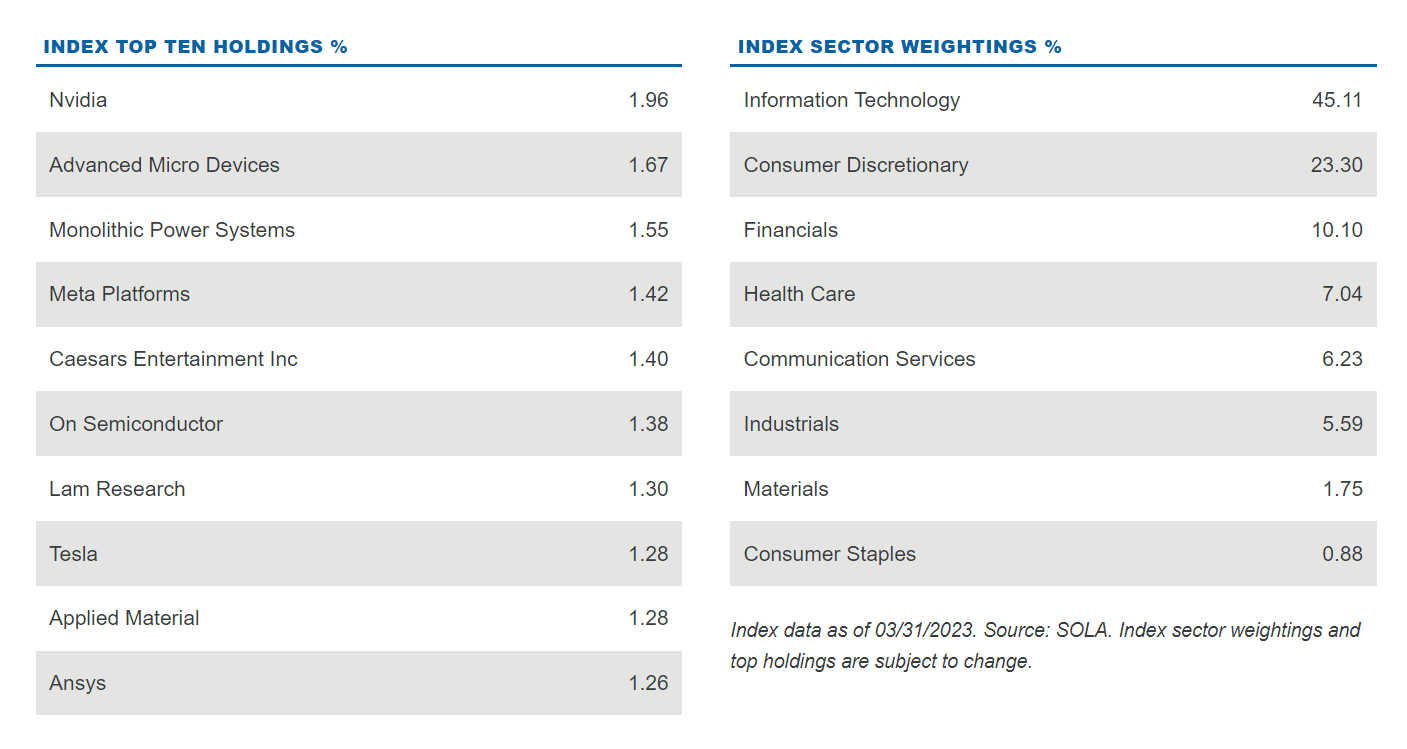
In fact, 3 of the top 10 holdings of the index, Nvidia (NVDA), Advanced Micro Devices (AMD), and Meta Platforms (META) happen to be 3 of the strongest stocks YTD, so it is no wonder that the HIBL has performed so well.
HIBL Vs. Levered Sector ETFs
After understanding the main driver for HIBL's recent performance, HIBL's outperformance becomes much less impressive. For example, comparing HIBL's YTD performance against the Direxion Daily Semiconductor 3X Bull Shares ETF (SOXL), the Direxion Daily Technology Bull 3x Shares ETF (TECL), and the Direxion Daily Consumer Discretionary Bull 3x Shares ETF (WANT), we can see HIBL's 25.4% YTD return pales in comparison (Figure 6).
Figure 6 - HIBL's performance becomes much less impressive when viewed in right lens (Seeking Alpha)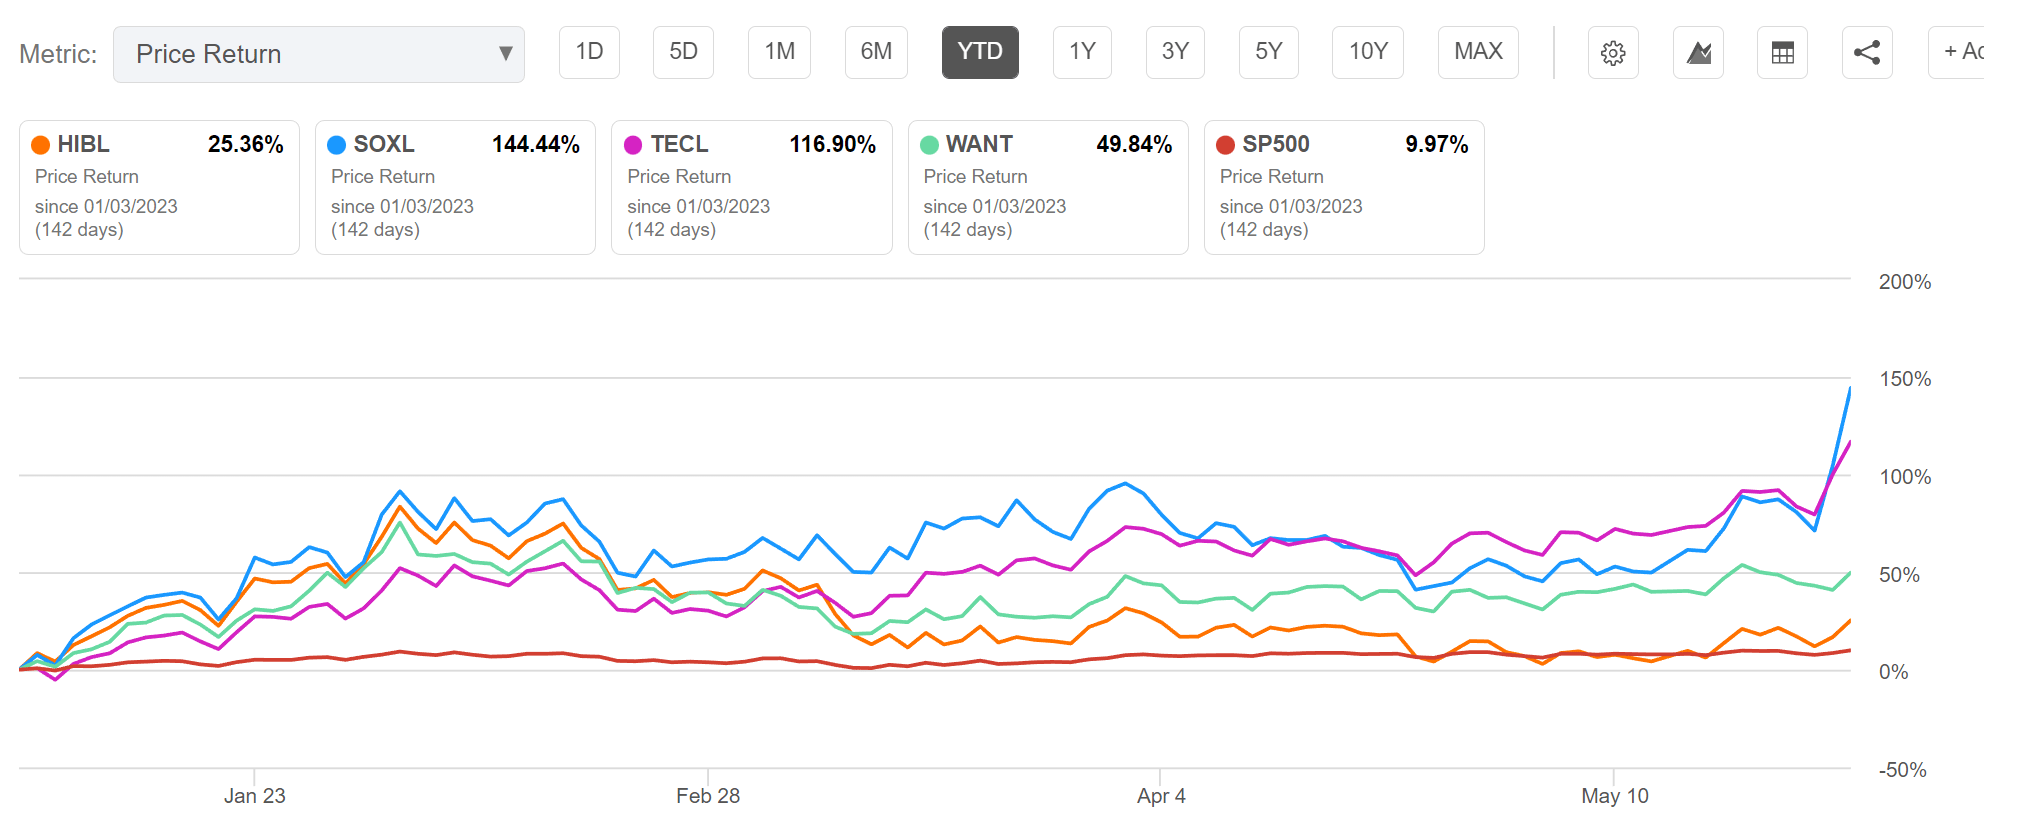
If investors are bullish on the current mega-cap technology driven market rally, I believe they are better off betting directly in those sectors rather than a factor ETF like HIBL.
Conclusion
Given my concern about the current AI-driven mania in the equity markets, I am hesitant about investing in technology-related stocks and ETFs. The HIBL ETF's recent performance caught my eye as it is based on the 'high beta' factor.
However, further analysis shows that the HIBL ETF is really a technology fund in disguise, as technology makes up 45% of the underlying index. When viewed from this lens, the HIBL ETF actually underperforms targeted technology ETFs like the SOXL and the TECL, since HIBL's returns are negatively impacted by weakness in other sectors.
For me personally, the HIBL ETF is a pass.
This article was written by

Analyst’s Disclosure: I/we have no stock, option or similar derivative position in any of the companies mentioned, and no plans to initiate any such positions within the next 72 hours. I wrote this article myself, and it expresses my own opinions. I am not receiving compensation for it (other than from Seeking Alpha). I have no business relationship with any company whose stock is mentioned in this article.
Seeking Alpha's Disclosure: Past performance is no guarantee of future results. No recommendation or advice is being given as to whether any investment is suitable for a particular investor. Any views or opinions expressed above may not reflect those of Seeking Alpha as a whole. Seeking Alpha is not a licensed securities dealer, broker or US investment adviser or investment bank. Our analysts are third party authors that include both professional investors and individual investors who may not be licensed or certified by any institute or regulatory body.