Canadian National: Riding The Rails Of Profit

Summary
- In this article, we go over the full operating and financial history of the company from 2012 to 2022.
- We will look at how the company has been executing in terms of efficiency.
- We will consider the company's FCF generation to see how it is used to generate sustainable distributions to the shareholders.
CHENG FENG CHIANG
Introduction
This article is part of the "Riding The Rails Of Profit" series. I am writing it to share further research on North-American railroads, always keeping the BNSF case study as the model to start from. This time we will look at Canadian National Railway Company (NYSE:CNI). Please be aware that financial data are reported in CAD$, unless otherwise stated.
Summary of previous coverage
Railroads are the backbone of the economy. Warren Buffett understood this well as he explains over and over to Berkshire's shareholders the importance of the BNSF acquisition. It is from here that I started getting interested in the industry and I share my first findings in the article "Learning from Buffett and Berkshire About Investing In Railroads: The BNSF Case Study". Here, I spent a few words sharing what I was learning from Buffett and the criteria he used to assess a railroad. We learned together how Buffett values a lot the following aspects: earning power (how well interest expense is covered), efficiency (operating ratio, fuel consumption), use of capital (only excess capital should be returned).
Then I started publishing some research using the same method to look at the other 5 publicly traded Class 1 railroad companies. You can find them in my SA profile by searching for the respective ticker symbols. Recently, I came back to BNSF and shared deeper research on the total returns Berkshire had from this investment.
Regarding Canadian National, we saw more than once how it is one of the best-managed railroads. In terms of earning power, it stood at 12.3 at the end of 2022, making its interest expense very well covered even in case of a major economic downturn. Its operating ratio was 60% during Q4 of last year; its fuel efficiency was best-in-class with only 0.886 US gallons of fuel consumed per 1,000 GTMs. Its balance sheet was healthy as Canadian National has been much more conservative compared to other peers. The company also raised its dividend by 7.8% and announced a $4 billion buyback plan to be completed by the end of January 2024.
Now, it is time to zoom out and look at the larger picture over the span of many years.
Operating History
Freight Revenues
When we consider railroads, we are before a business where operating efficiency is one of the king measures. No surprise investors look quarterly at the operating ratio to quickly (and sometimes too rashly) assess whether a company is performing well or not. Usually, an operating ratio below 60% is considered good; above 60% we are in inefficiency territory.
Why is efficiency so important? Part of what makes railroads so interesting is their property network that is almost unassailable by new competitors. However, what creates a huge barrier of entry can also be a limit for the business. In fact, a railroad is somewhat stuck to its tracks. How can it expand and grow? It can try to grow its top-line. This can be achieved in two ways. If the economy performs well, it is reasonable to expect higher freight volumes. This usually leads to revenue growth. But this is something railroads don't control. The other way to achieve top-line growth is to leverage their pricing power, linked to the unique tracks they own.
In any case, it is easy to understand how top-line growth is not the item railroads can control best. On the other hand, they have almost full control (weather and some accidents being unpredictable) on how they execute their business, that is, how well they operate their network and how effectively they use their equipment. This is why among the industry we see different performances as we move to the bottom line of the income statement.
While we have seen the two western railroads - BNSF and UNP - having almost no top-line growth in the past decade, Canadian National shows a different situation. Here we are before a railroad whose freight revenue has increased by 86% from $8.9 billion in 2012 to $16.6 billion at the end of 2022. As the graphs below show, intermodal has been the best-performing sector with 146% growth, followed by petroleum and chemicals with 101% growth. All other sectors have indeed grown, but at a rate between 31% (coal) and 75% (grain and fertilizers). To be honest, I expect 2023 to push grain and fertilizer above the overall average due to the fifth largest harvest of the century in Canada.
Author, with data from CNI Annual Reports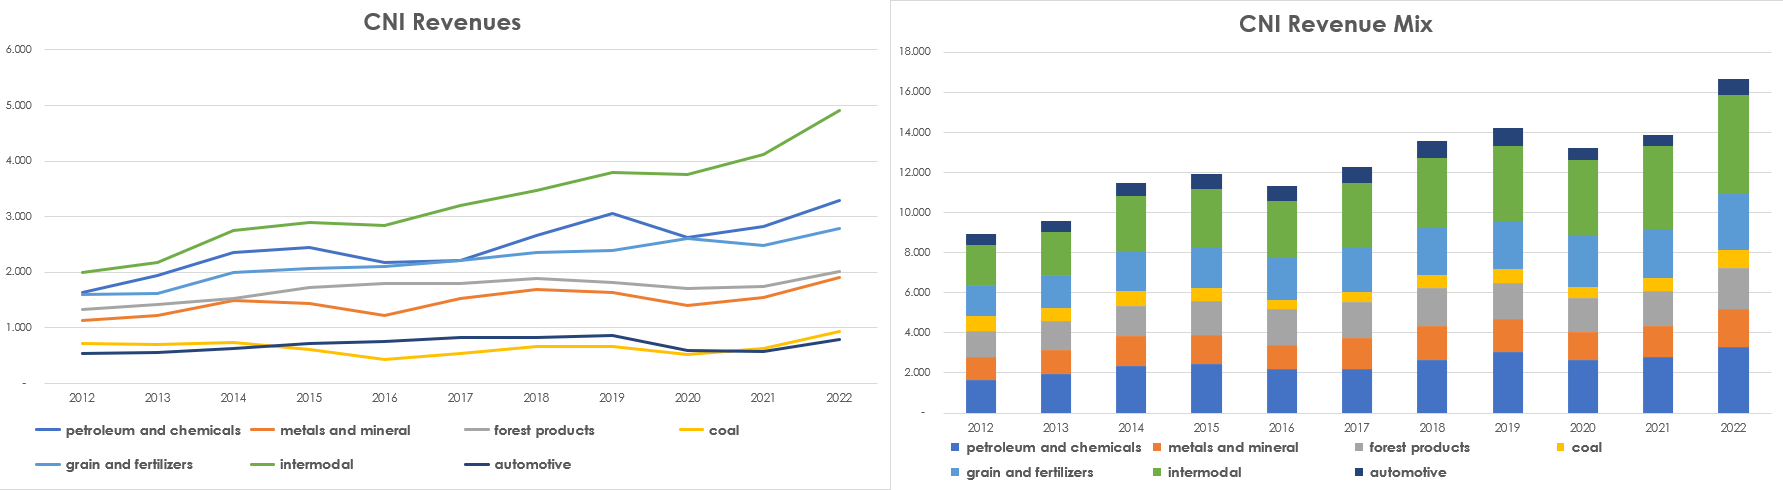
What can we read from these two graphs? Intermodal shows how well a company is able to intercept global freight volumes. Canadian National, under this perspective, has an incredible moat due to its three-coastal network linking the Pacific to the Atlantic and the Gulf. This means that the company is able to deal with many different economic regions linked to different economic cycles and speeds.
Let's consider for a moment the number of carloads and the revenue per carload. In this way, we can see if the company is being able to transport high-value freight or not. In fact, not every carload of freight generates the same revenue.
Author, with data from CNI Annual Reports
We see how carloads, more or less, are in a range between 5 and 6 million per year. The range is somewhat linked to what we said above: infrastructure is also a material limit.
Nonetheless, while carloads increased just 12% from 2012 to 2022, the revenue per carload the company achieved is 65%. Last year was indeed exceptional as the economy was booming after the pandemic and railroads could flex the muscles of their incredible pricing power. If we go back to 2021, revenue per carload had grown by only 38% compared to 2012. Still, it is a much faster growth compared to carloads.
This shows, how Canadian Pacific is not relying as much on carloads per se, as on increasing revenue per carload.
Operating Expenses
So far we focused mostly on what builds up the top-line of Canadian National's income statement. However, to assess the company's efficiency we have to see what percentage of total revenues is used to finance operating expenses.
As we can see from this table from the last annual report, we find out that, as usual with railroads, there are four major expenses: labor, purchased services and material, fuel, and D&A.
CNI 2022 Annual Report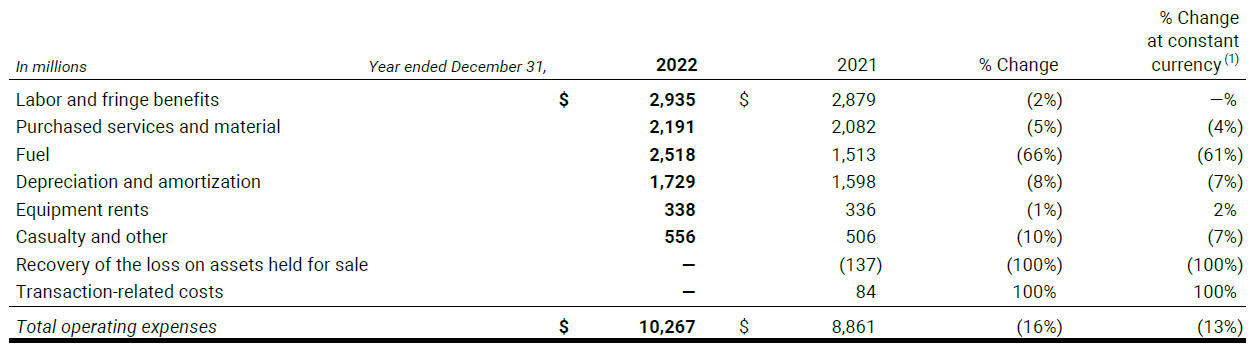
Unlike the two western railroads, Canadian National, though it was the first big to implement PSR, has not seen a major headcount reduction, keeping its full-time employee number around 25,000. In 2012, the company had 23,430 workers and a labor and fringe benefits expense of $1.952 billion. This gives us a compensation per employee of $83,311. At the end of FY 2022, the company employed 23,971 workers who received labor compensation and fringe benefits for a total amount of $2.935 billion. With average compensation per employee being now at $122,439, we are before a 47% increase since 2012. It seems like Canadian National has paid more attention to its labor force compared to other peers. Still, its compensation expense is only 17% of total revenues.
Regarding fuel, Canadian National is an industry leader in terms of efficiency. As we know, fuel expense can be rather volatile. This has a double-sided effect. At first, as fuel prices increase, the company faces a dent in its margins. Then the fuel surcharge program kicks off, generally speaking with a time lag of about 60 days, and the company is able to shake off a fuel price surge and actually earn an extra on top of it. This creates also a certain top-line volatility which is mainly linked to this program.
Therefore, the operating ratio becomes even more important than revenues because it shows in a better way how the company is organically performing. The company, at the end of 2021, had an operating ratio of 61.2% which, considering the overall environment, was acceptable. However, before the pandemic, Canadian National had gotten investors used to an operating ratio below 60%. I believe 2023 could be the right year for the company to go once again below 60% as the benefit of the fuel surcharge program will still boost revenue while some operating expenses start contracting.
Overall, since 2012, Canadian National has been able to generate $61 billion of operating income which is close to 60% of the current market cap the stock trades at on the Toronto Stock Exchange.
Balance Sheet History
Let's consider now what happened to Canadian National's capital structure over the past decade or so.
Author, with data from CNI Annual Reports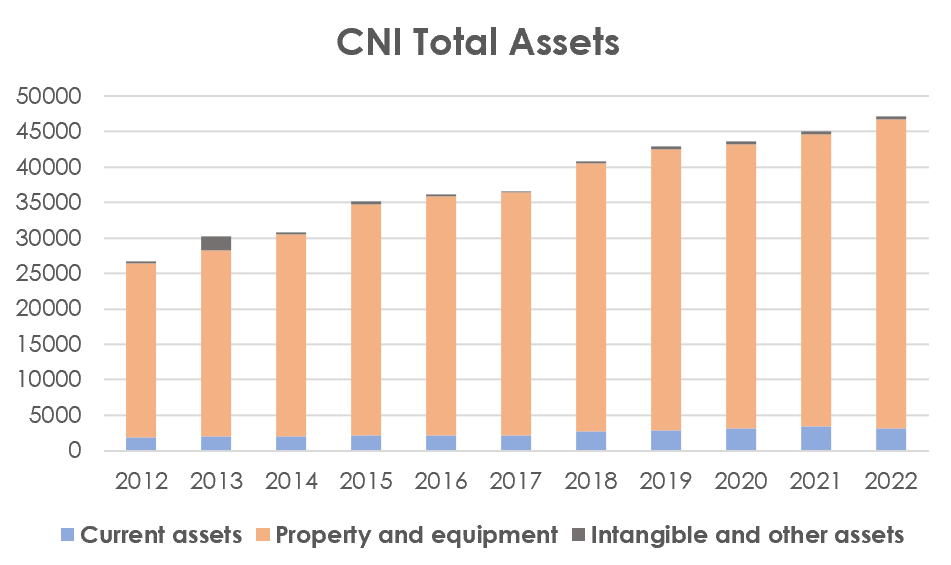
We have gotten used by now to a key item: property and equipment. This has always been the lion's share when considering a railroad's total assets. Since 2012, Canadian National has seen property and equipment increase from $24.5 billion to $43.5 billion, which is equal to a 67.8% increase.
Let's now look at total liabilities and equity to see if we can understand how the company financed its increase in assets. We see a company whose LT debt has grown from $6.3 billion at the end of 2012 to $14.4 billion at the end of last year. However, the operating income/LT debt ratio is still below a 2. In addition, the sum between LT debt and equity is not equal to the value of property and equipment, showing a different situation from BNSF.
Author, with data from CNI Annual Reports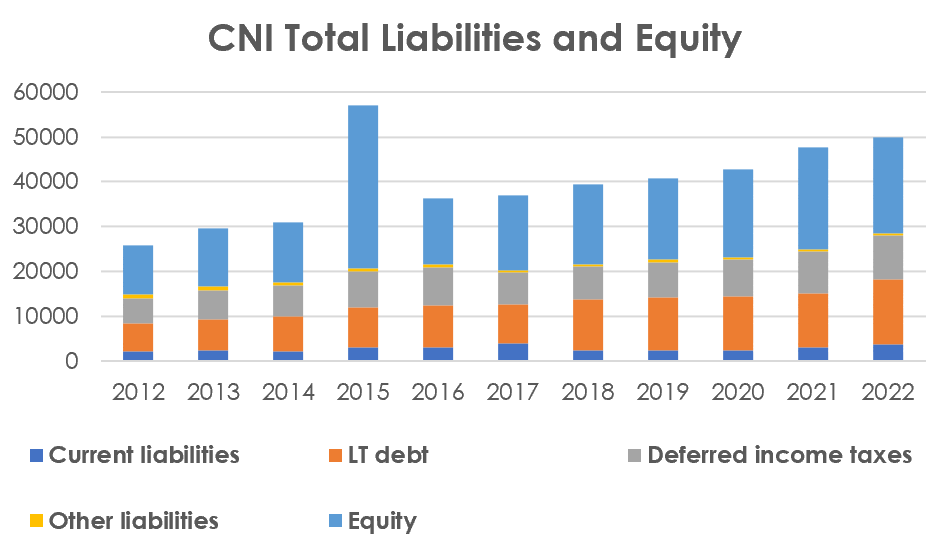
By having an increase in assets greater than the increase of the sum between LT debt and equity, we see a company that is able to finance by itself through strong cash flow generation of at least part of its investments.
Cash Flow History
So here we are, ready to look at the company's cash flows coming from operating activities. Between 2012 and 2022, the company generated $58.5 billion of operating cash, while spending just a little bit less than $30 billion in capex. This leaves us with approximately $29 billion of free cash flow. The graph below shows clearly, through the yellow line, how the company has been free cash flow positive in all these years.
Author, with data from CNI Annual Reports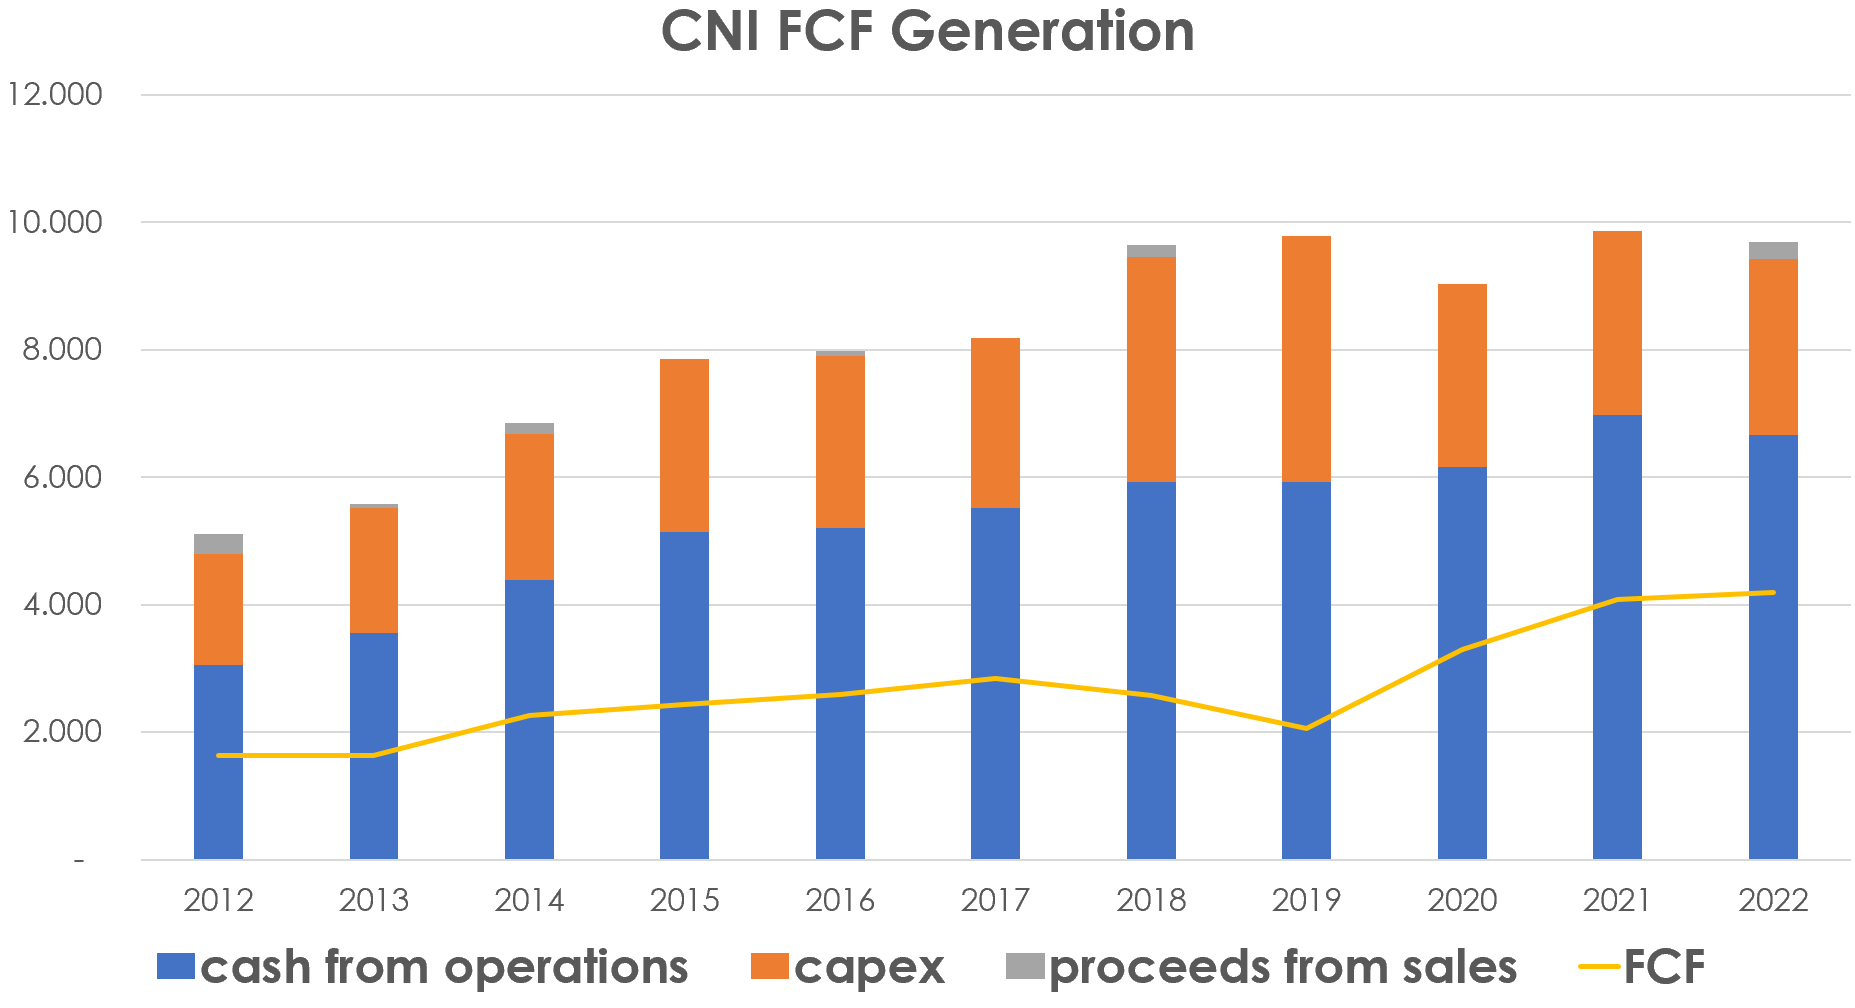
What has the company done with its FCF? We can see from this other graph below how it was returned to its shareholders through a well-supported dividend and a buyback policy.
Author, with data from CNI Annual Reports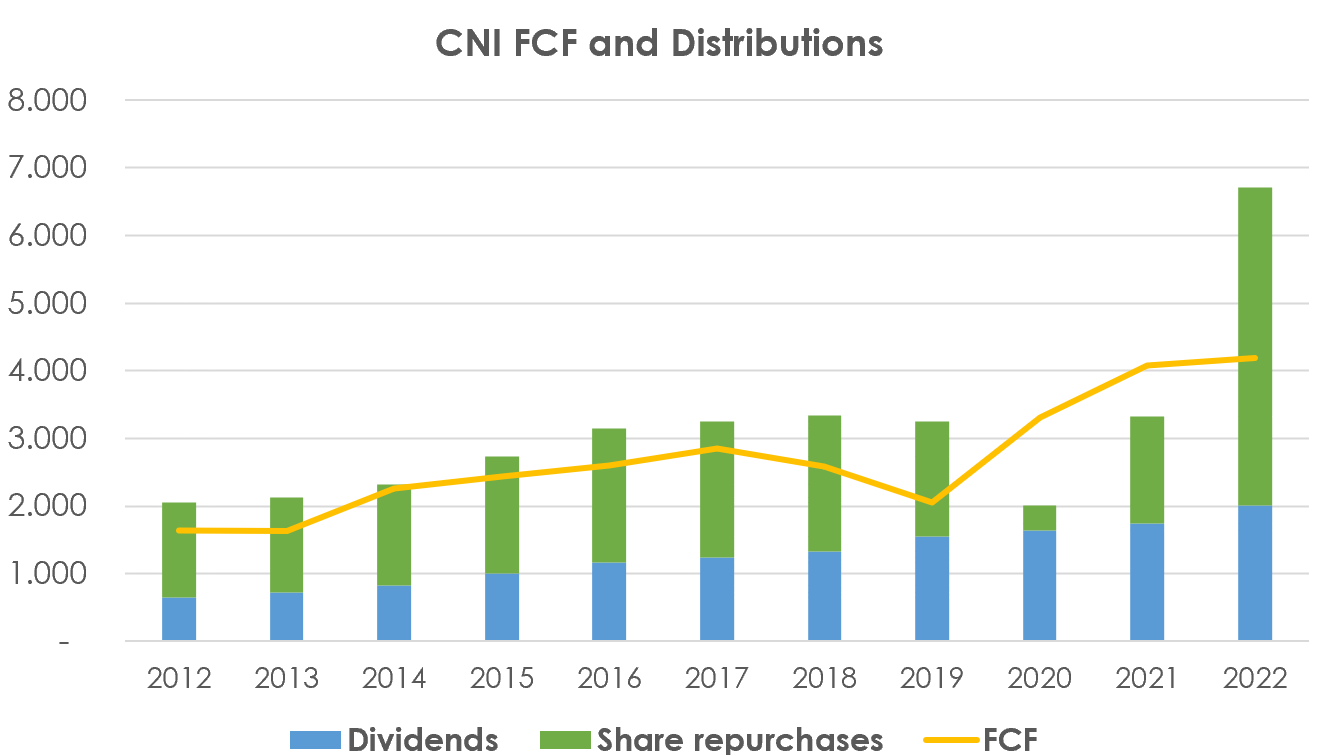
Regarding buybacks, we clearly see a situation that needs to be addressed. In fact, for the majority of these years, the company has spent on buybacks a little more than its FCF would have allowed. In other words, a little bit of these share buybacks were funded through debt. However, Canadian National has also been able to cut on share repurchases when the pandemic hit and the situation was uncertain. Last year, it seems, the company returned to its shareholders the portion of FCF it had held for itself during the toughest part of the pandemic. Overall, I see a manageable situation, where the company doesn't take too much debt to fund its share buybacks. Canadian National is known to be one of the most conservative railroads and this is why I think it sometimes underperforms its peers: it just spends less on share repurchases in order to keep safe its balance sheet.
Conclusion
Overall, Canadian National is a reliable company that doesn't take too much risk to boost short-term financials. On the contrary, it seems like a company whose focus is to keep on running its business for many years to come. I still think the company is trading around its fair value, which, in the case of a company with such a moat and high-quality financials, is already a good long-term deal.
Seeing the stock dropping a bit recently is tempting me to add a few more shares to my initial position and dollar cost average down. A free cash flow yield of 4.19%, in fact, is quite a good metric for a company whose business is able to generate predictable future cash flows. Reviewing the company's financials from 2012 to 2022 has helped me become more convinced this is a railroad I want to own, both because of its moat and its operations and because of the way it is managed.
This article was written by

Analyst’s Disclosure: I/we have a beneficial long position in the shares of CNI either through stock ownership, options, or other derivatives. I wrote this article myself, and it expresses my own opinions. I am not receiving compensation for it (other than from Seeking Alpha). I have no business relationship with any company whose stock is mentioned in this article.
Seeking Alpha's Disclosure: Past performance is no guarantee of future results. No recommendation or advice is being given as to whether any investment is suitable for a particular investor. Any views or opinions expressed above may not reflect those of Seeking Alpha as a whole. Seeking Alpha is not a licensed securities dealer, broker or US investment adviser or investment bank. Our analysts are third party authors that include both professional investors and individual investors who may not be licensed or certified by any institute or regulatory body.