EES Vs. IJS: Earnings Strategy Matches Value In Small-Cap Compare

Summary
- The WisdomTree U.S. SmallCap Fund invests based on its internal index: WisdomTree U.S. SmallCap Index, with an earnings bent.
- The iShares S&P Small-Cap 600 Value ETF invests based on the popular S&P SmallCap 600 Value Index.
- When looking at the return and risk data, it shows a toss-up between these two Value-focused ETFs. Seeking Alpha's rating system shows better choices, too.
- Looking for more investing ideas like this one? Get them exclusively at Hoya Capital Income Builder. Learn More »
NicoElNino
(This article was co-produced with Hoya Capital Real Estate)
Introduction
There is a growing assortment of ETFs covering the Small-Cap segment of both the US, International for both the Developed and/or Emerging Markets, or ones that cover the whole range. Besides the usual Growth versus Value sub-parts, I have reviewed others recently for which I provide links at the end of this article. Here I compare a popular Value ETF against one with an Earnings focus, those being:
Historical returns for Small-Cap stocks
While it has not been the case for most of the past decade thanks to technology stocks, longer history shows that smaller is better.
PortfolioVisualizer.com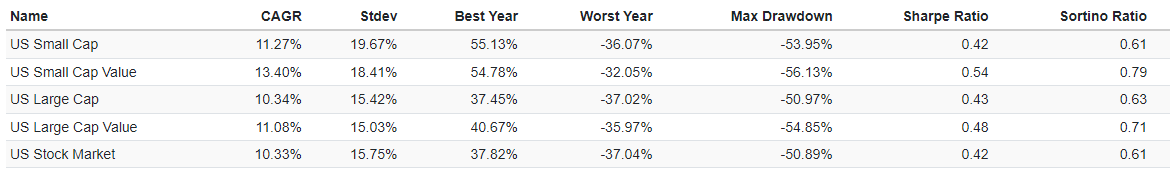
Small-Cap Value has the best CAGR, and despite having the second highest StdDev, SCV stocks still have the best Sharpe and Sortino ratios.
iShares S&P Small-Cap 600 Value ETF review
seekingalpha.com IJS charting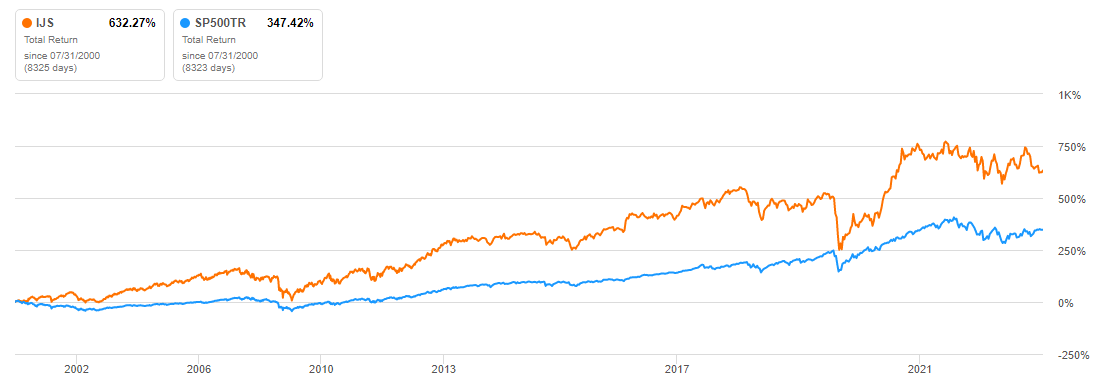
Seeking Alpha describes this ETF as:
The iShares S&P Small-Cap 600 Value ETF managed by BlackRock Fund Advisors. The investment seeks to track the investment results of the S&P SmallCap 600 Value Index, composed of small-capitalization U.S. equities that exhibit value characteristics. IJS started in 2000.
Source: seekingalpha.com IJS
IJS has $6.6b in AUM and has a TTM Yield of 1.52%. Fees are 18bps.
Index review
S&P describes the index as:
We measure value stocks using three factors: the ratios of book value, earnings, and sales to price. S&P Style Indices divide the complete market capitalization of each parent index into growth and value indices. Constituents are drawn from the S&P SmallCap 600®.
Source: spglobal.com index
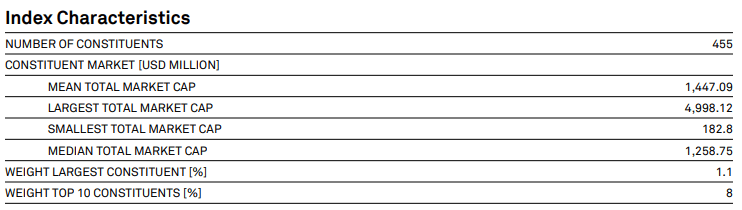
They also provided some basic data around the index.
spglobal.com index spglobal.com index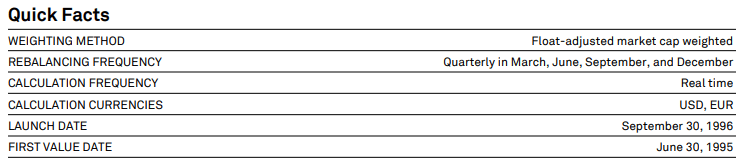
An important note about S&P Value/Growth indices is that can hold the same stocks at weights determined by company-level value/growth factors. They provide this chart to show that spectrum.
spglobal.com Methodology PDF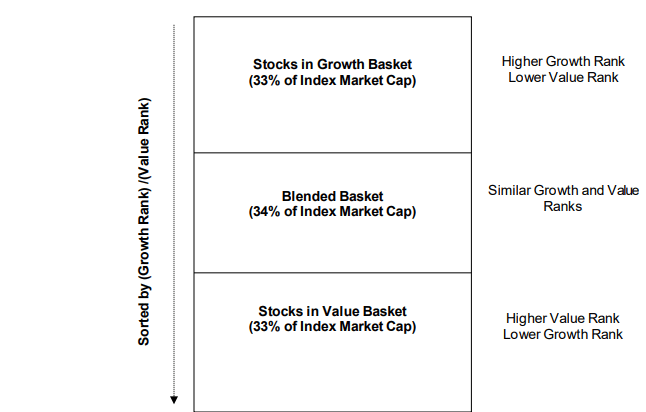
This results in 188 stocks being in both the S&P 600 Value and Growth indices.
IJS holdings review
I will start with the portfolio characteristics that iShares provides.
ishares.com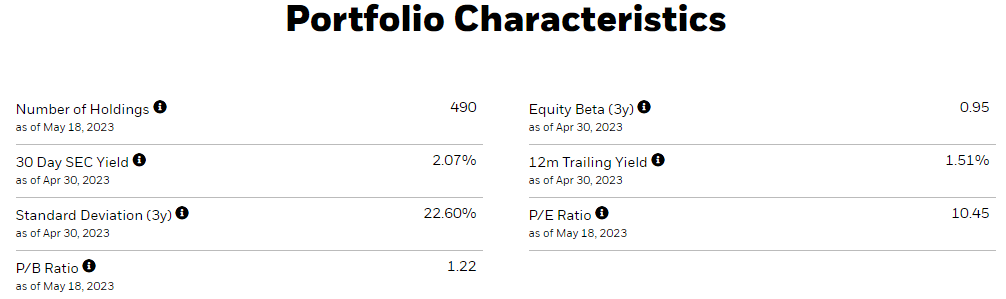
Next, I looked at the sector, which will be compared to EES later.
ishares.com IJS sectors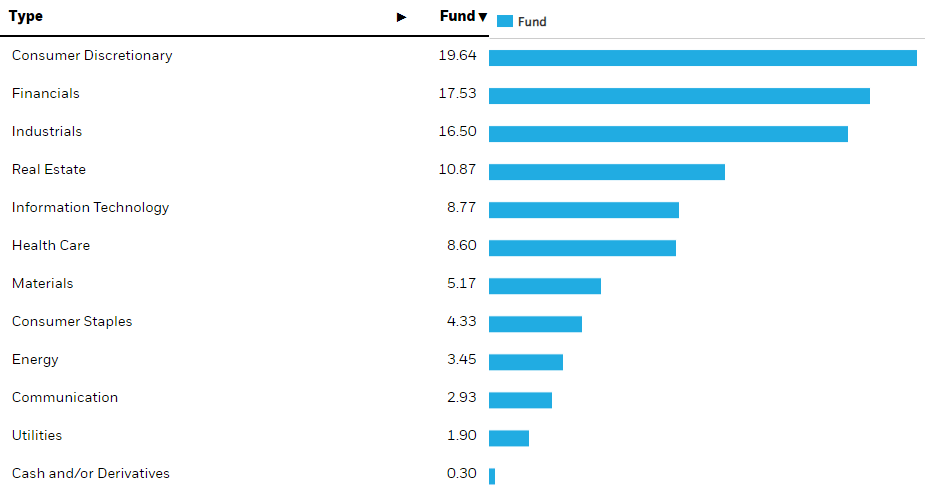
Of the top four sectors, Morningstar classifies all but Industrials as Cyclical; hopefully the FOMC won't push the US into a recession then.
Top holdings
ishares.com; compiled by Author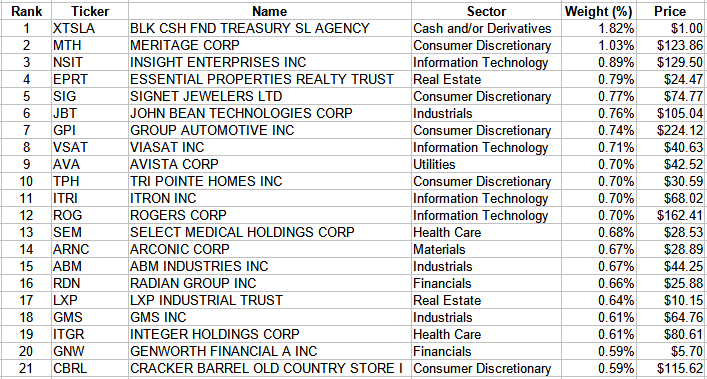
Ignoring the top holdings, cash, the next 20 stocks account for 14% of the portfolio of just under 500 stocks. The bottom half of the portfolio comes in at 19%, about average from what I have seen for that part of an ETF's allocation. Unlike some Large-Cap ETFs, this ETF is not dependent on one sector or a few positions to drive its results.
IJS distribution review
seekingalpha.com IJS DVDs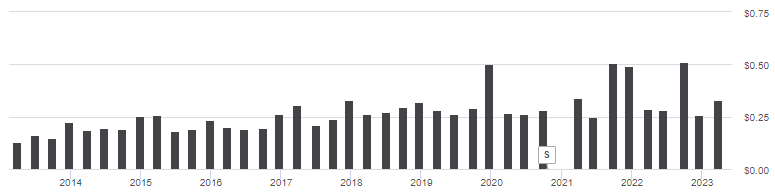
Eliminate the outliers, and IJS has shown very little improvement in what they send investors. iShares shows even the extra-large payouts came from income, not any capital gains or ROC, the latter being extremely rare for an ETF. Most likely source were companies paying year-end extra dividends. Due to a missing payout, the payout grade is low at a "D+".
seekingalpha.com IJS scorecard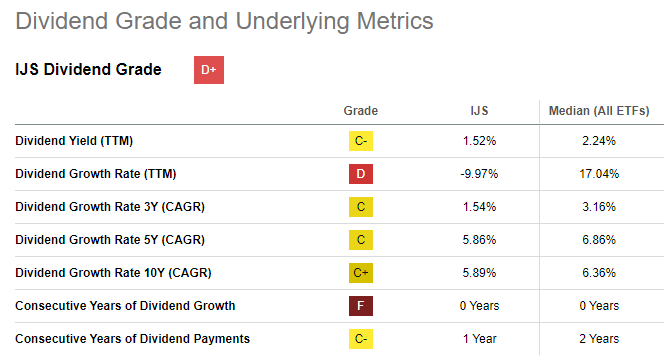
WisdomTree U.S. SmallCap Fund review
seekingalpha.com EES charting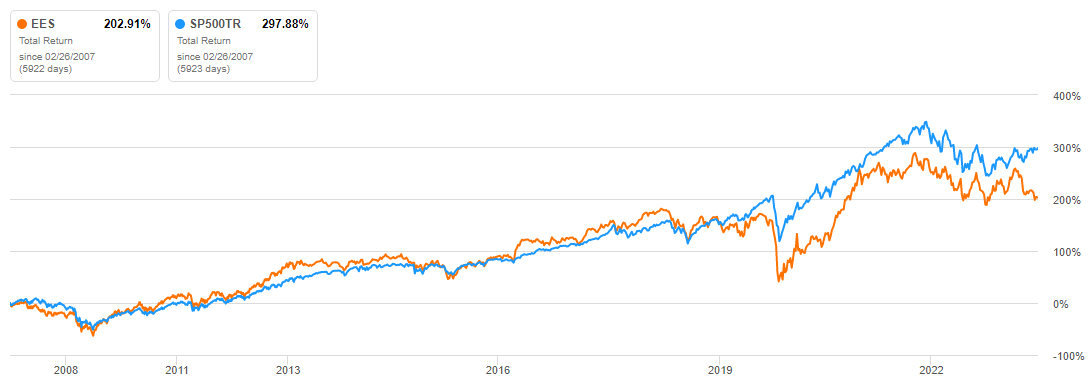
Seeking Alpha describes this ETF as:
The investment seeks to track the price and yield performance, before fees and expenses, of the WisdomTree U.S. SmallCap Index. Under normal circumstances, at least 95% of the fund's total assets (exclusive of collateral held from securities lending) will be invested in component securities of the index and investments that have economic characteristics that are substantially identical to the economic characteristics of such component securities. The index is a fundamentally weighted index that is comprised of earnings-generating companies within the small-capitalization segment of the U.S. stock market. EES started in 2007.
Source: seekingalpha.com EES
EES is much smaller than IJS at $553m in AUM. The Forward Yield is 1.09% and the fees are 38bps, giving the IJS ETF a 20bps cost edge.
Index review
WisdomTree describes their index as:
The WisdomTree U.S. SmallCap Index is a fundamentally weighted index that measures the performance of earnings-generating companies within the small-capitalization segment of the U.S. Stock Market. The index is comprised of the companies in the bottom 25% of the market capitalization of the WisdomTree U.S. Total Market Index after the 500 largest companies have been removed. Companies must be incorporated and listed in the U.S. and have generated positive cumulative earnings over their most recent four fiscal quarters prior to the index measurement date. The index is earnings-weighted in December to reflect the proportionate share of the aggregate earnings each component company has generated. Companies with greater earnings generally have larger weights in the index.
Source: wisdomtree.com/investments/index
EES holdings review
The sector allocation shows EES more concentrated in its largest sector allocations, most of which also top IJS's allocations, just at higher levels.'
wisdomtree.com EES sectors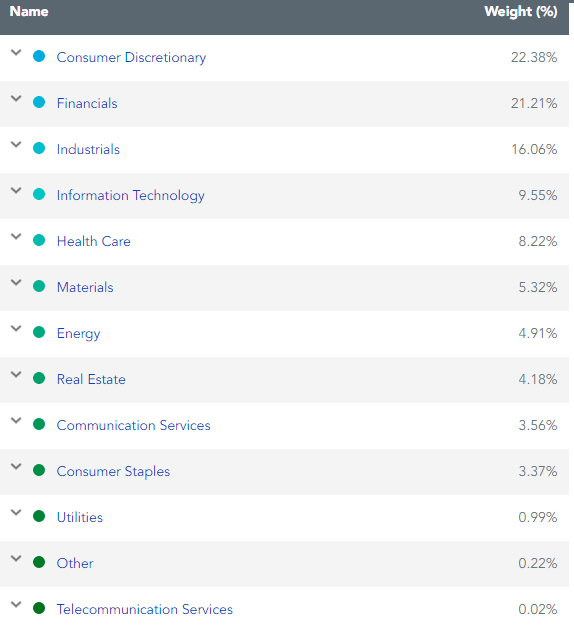
Top holdings
wisdomtree.com; compiled by Author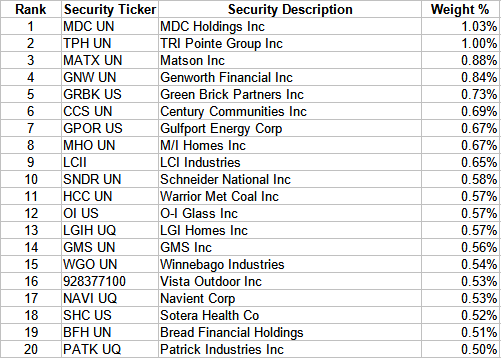
Despite holdings 400 more positions, the Top 20 allocation is only slight less than IJS's: 13%. Here, the bottom half allocation is 20%, again close to what IJS has. While about 70% of the allocation is in four sectors, only two stocks have a 1+% weight.
EES distribution review
seekingalpha.com EES DVDs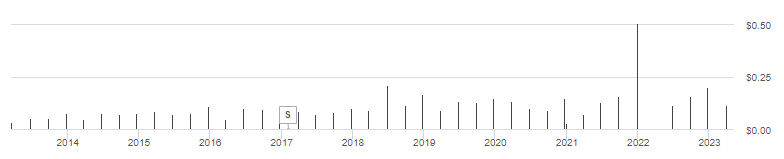
Like IJS, EES shows little payout growth. Also, like IJS, they skipped a payment, which hurts the grade received by Seeking Alpha; here being a "D+".
seekingalpha.com EES scorecard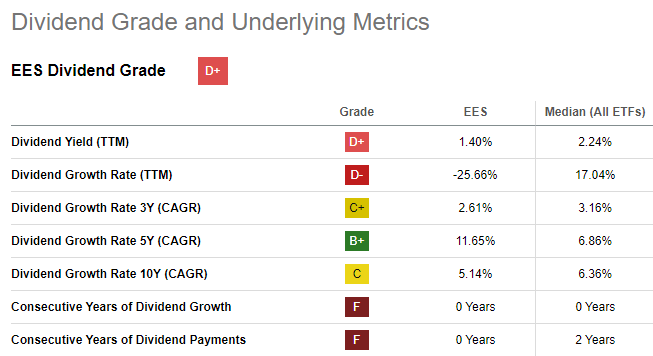
Comparing ETFs
Using Fidelity plus some Seeking Alpha, we see they favor EES over IJS: Green cells are the preferred value.
multiple pages; compiled by Author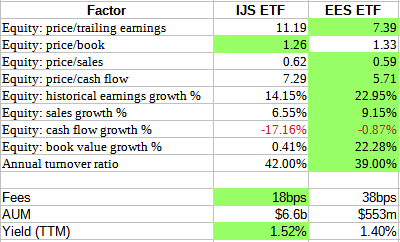
It is very unusual for the same ETF in a comparison to appear better in both value and growth data points. As for Value/Growth stock allocations, Vanguard provides the following.
advisors.vanguard.com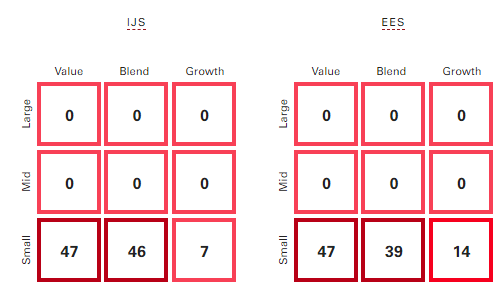
The big allocation difference is in the percent listed as Growth stocks, with EES having twice the weight as IJS, but all that comes from the Blend allocation.
The ETFs have the following overlap and sector differences.
ETFRC.com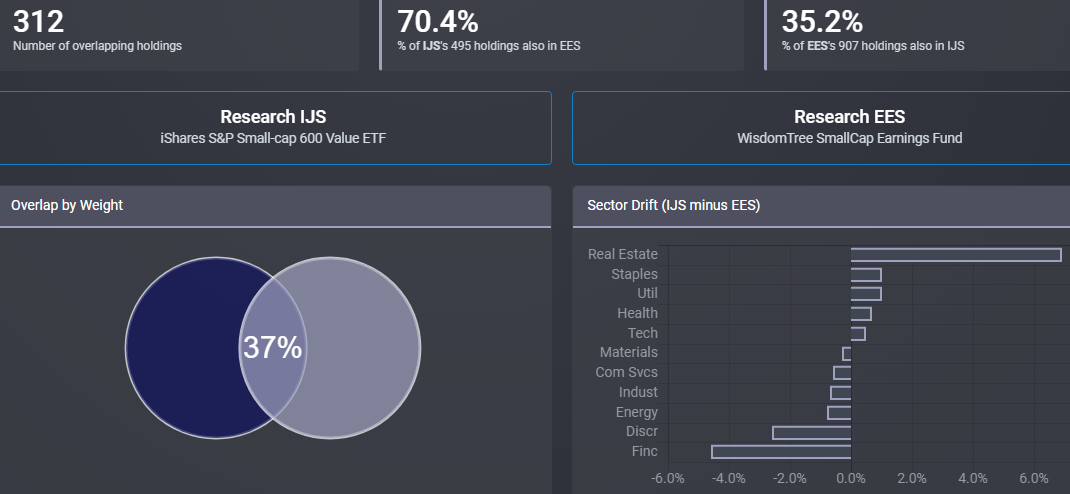
EES holders also own 70% of the stocks held by IJS. IJS's biggest allocation difference over EES is in Real Este stocks; EES's is in Financials.
Since some investors measure every other ETF against the SPDR S&P 500 ETF (SPY), I included it here.
seekingalpha.com IJS charting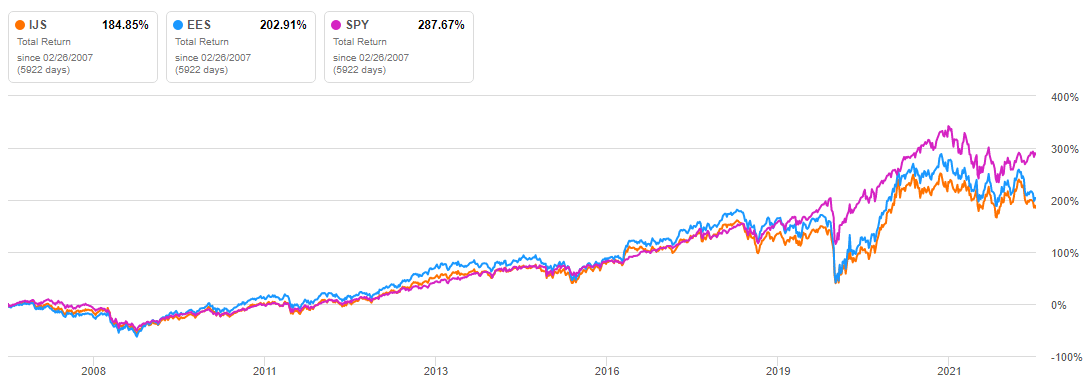
As other have commented, time does matter. So, while SPY is best since 2007, the post-COVID year shows a different result.
seekingalpha.com IJS charting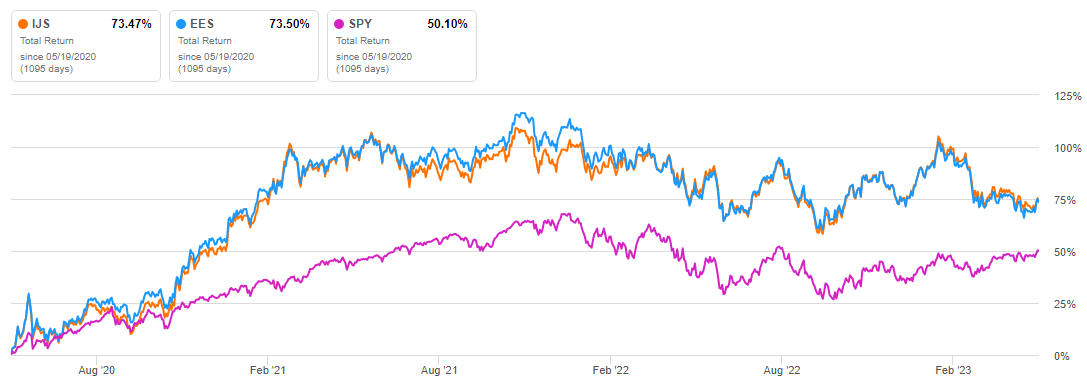
Both time periods show IJS and EES close, with their correlation factor being 98%. It seems to come down to which manager an investor prefers and their future opinion on Real Estate and Financial stocks, the big sector differences each ETF currently exposes investors too.
Portfolio strategy
One important question to ask after deciding a Small-Cap allocation is desired is Value, as reviewed here, or Growth stocks. For that, I added the iShares S&P Small-Cap 600 Growth ETF (IJT).
PortfolioVisualizer.com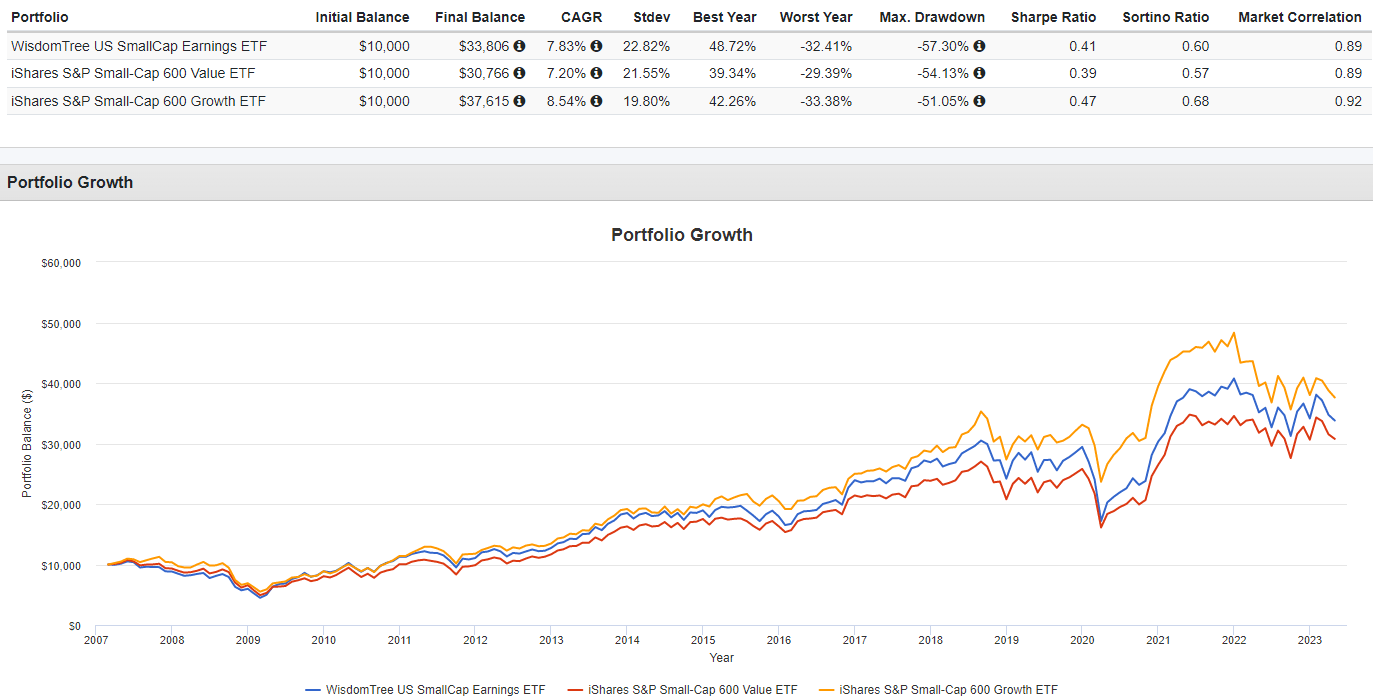
Data shows that investors have done better owning IJT compared to either of these Value-oriented ETFs. That isn't to say there is not a Value ETF that still might be better, as the actively managed AVUV ETF has shown.
When looking at the return and risk data, it show a toss-up between these two Value-focused ETFs. Seeking Alpha's rating system shows better choices too.
Related links
Here are links to my other recent articles covering Small-Cap funds.
- I Replaced IJS ETF With XSVM ETF: Good Timing?
- IJS Vs.VBR: Comparing Small-Cap Value ETFs That Use Different Indices
- AVUV Vs. XSVM: Active Small-Cap Value ETFs Use Different Strategies
- RZV Vs. AVUV: No Consistent Winner In The Small-Cap Value Space
For those wanting international exposure, read AVDV Vs. SCZ: The New ETF Has Proven Its Worth So Far.

I ‘m proud to have asked to be one of the original Seeking Alpha Contributors to the 11/21 launch of the Hoya Capital Income Builder Market Place.
This is how HCIB sees its place in the investment universe:
Whether your focus is high yield or dividend growth, we’ve got you covered with high-quality, actionable investment research and an all-encompassing suite of tools and models to help build portfolios that fit your unique investment objectives. Subscribers receive complete access to our investment research - including reports that are never published elsewhere - across our areas of expertise including Equity REITs, Mortgage REITs, Homebuilders, ETFs, Closed-End-Funds, and Preferreds.
This article was written by

I have both a BS and MBA in Finance. I have been individual investor since the early 1980s and have a seven-figure portfolio. I was a data analyst for a pension manager for thirty years until I retired July of 2019. My initial articles related to my experience in prepping for and being in retirement. Now I will comment on our holdings in our various accounts. Most holdings are in CEFs, ETFs, some BDCs and a few REITs. I write Put options for income generation. Contributing author for Hoya Capital Income Builder.
Analyst’s Disclosure: I/we have no stock, option or similar derivative position in any of the companies mentioned, and no plans to initiate any such positions within the next 72 hours. I wrote this article myself, and it expresses my own opinions. I am not receiving compensation for it (other than from Seeking Alpha). I have no business relationship with any company whose stock is mentioned in this article.
Seeking Alpha's Disclosure: Past performance is no guarantee of future results. No recommendation or advice is being given as to whether any investment is suitable for a particular investor. Any views or opinions expressed above may not reflect those of Seeking Alpha as a whole. Seeking Alpha is not a licensed securities dealer, broker or US investment adviser or investment bank. Our analysts are third party authors that include both professional investors and individual investors who may not be licensed or certified by any institute or regulatory body.