2 REITs Similar To Realty Income But Cheaper

Summary
- Realty Income Corporation has long been the gold standard within the net lease REIT sector.
- However, today we will look at two up and coming REITs that are building a similar portfolio and trading at a fraction of Realty Income's multiple.
- These REITs are smaller and come with higher risk but also faster growth opportunities.
- This idea was discussed in more depth with members of my private investing community, iREIT on Alpha. Learn More »
alexsl
One of the most popular real estate investment trusts, or REITs, if not the most popular REIT, is Realty Income Corporation (O), also known as "The Monthly Dividend Company." For years, the REIT has been not only a top performer, but also one of the most consistent performers.
Consistent in terms of TOTAL RETURN
Consistent in terms of Dividend Increases
Given that Realty Income has long been the gold standard within the REIT sector, I often look for similar REITs, as Realty Income has been consistent and safe over the years, but the growth has slowed considerably. Slow growth and a premium valuation are reasons why I look for similar REITs. This is one way I came across STORE Capital about five years ago and I am taking the same approach today.
As such, today we will look at two REITs that are built similarly to Realty Income, but trading at a CHEAPER valuation.
2 REITs Similar To Realty Income
REIT #1: Netstreit Corp. (NTST)
Netstreit, similar to Realty Income, is a net lease REIT operating within the retail sector primarily. The REIT has a market cap of $1.1 billion and over the past 12 months, shares of NTST have fallen 15%.
Seeking Alpha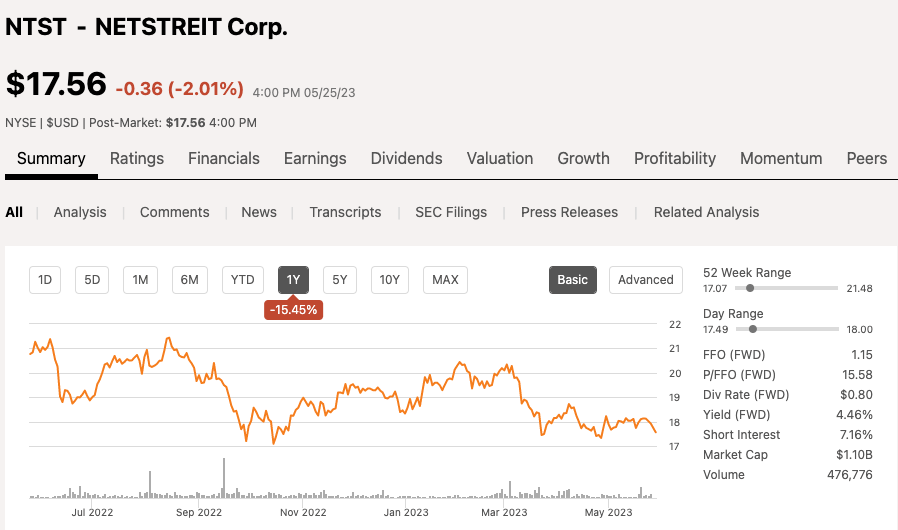
As I mentioned at the open, I found NTST similar to the way I came across STORE Capital years back. Knowing how great Realty Income is, but looking for an up and coming REIT that has a nice growth trajectory. As you will see below, NTST is constructed very similar in many aspects.
Netstreit recently reported Q1 earnings that saw the company generate:
- Funds From Operations ("FFO"): $0.30 per share compared to $0.28 per share expected
- Revenue: $28.47 million vs $28.13 expected.
The company is maintaining their 2023 guidance of $1.17 to $1.23 FFO per share.
Netstreit has nearly 500 investments within 45 states, which make up 8.8 million in leasable space and an impressive 100% occupancy rate.
NTST Q1 Investor Presentation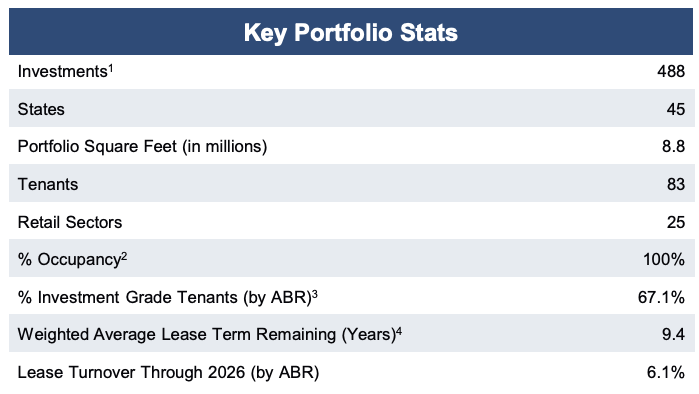
Many investors like the safety that comes with Realty Income, as many of their top tenants are investment grade. In totality, Realty Income has roughly 33% exposure to IG tenants and when you include tenant affiliates, it climbs to 41%.
Looking at the chart below, Netstreit Corp., although they are smaller in size, has an even higher exposure to IG tenants at 67%.
NTST Q1 Investor Presentation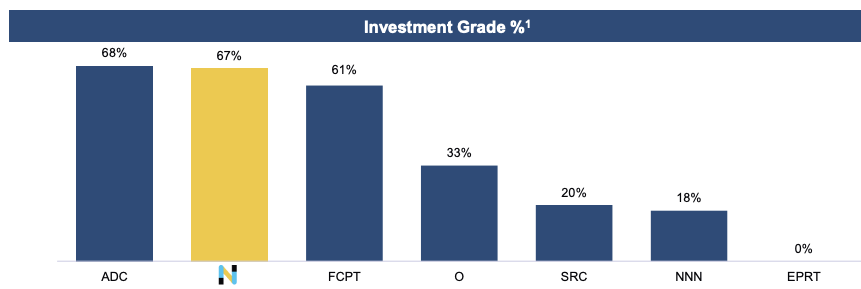
In addition, Netstreit has a lease rollover rate a third of what Realty Income is at currently and the two REITs have similar weighted average lease terms.
NTST Q1 Investor Presentation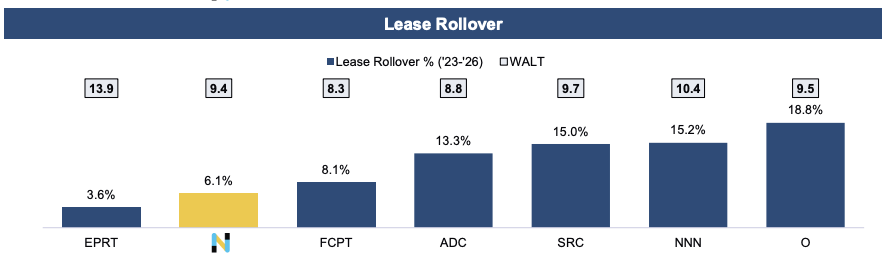
Next, lets take a look at top tenants.
Top 10 tenants for Realty Income include:
- Dollar General (DG)
- Walgreens (WBA)
- 7-Eleven
- Dollar Tree (DLTR)
- Wynn Resorts (WYNN)
- FedEx (FDX)
- LA Fitness
- B&Q
- Sansbury
- BJ’s Wholesale (BJ)
Now let’s take a look at Netstreit's top 10 tenants:
NTST Q1 Investor Presentation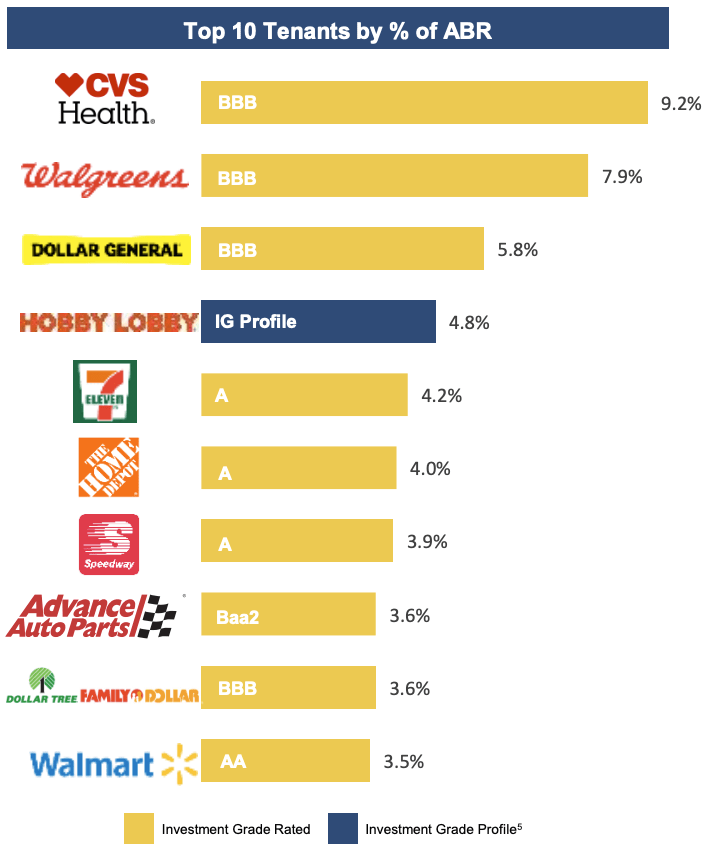
All of the top 10 are investment grade tenants and they account for roughly 50% of the company's annual base rent. For comparable purposes, Realty Income's top 10 tenants account for 26%, as expected given they have a much larger portfolio. As such, as an investor, you want to be much more comfortable with the top tenants of NTST given the high exposure rate.
Looking here, you can see the diversification of the NTST portfolio with 17.1% exposure to Pharmacy and Drug Stores, 12.2% Grocery Exposure, and 11.9% Home Improvement, 9.4% Dollar Store, and 8.9% exposure to Convenience stores, all relatively safe sectors.
NTST Q1 Investor Presentation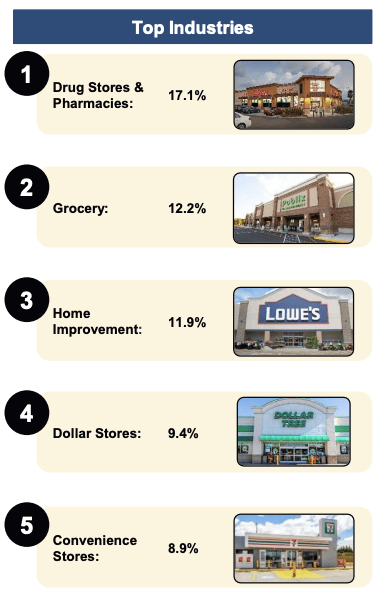
Netstreit Corp. continues to grow and expand all while maintaining a solid Balance Sheet with over $400 in total liquidity. The company has a net debt to adjusted EBITDA ratio of 5.1x with 80% of their debt being fixed rate debt.
In terms of the dividend, Realty Income pays a MONTHLY dividend that yields 5.1%, whereas Netstreit currently yields a dividend of 4.5%. The dividend is well covered with a low FFO payout ratio of 68%
Now for valuation. For starters, Realty Income, which tends to trade at a premium with a five year average AFFO (adjusted FFO) multiple of 19x, is trading at just 15x 2023 earnings. So, shares of O look intriguing in the own right.
As for Netstreit, this REIT has only been around for 2.5yrs on the public market, so not a lot in terms of average multiples. As for expectations, analysts are calling for 2023 AFFO of $1.21 which equates to a 2023 AFFO multiple of 14.8x, slightly cheaper than Realty Income. Since going public, shares of NTST have traded closer to 20x as AFFO has grown at a clip of 36% and 23% respectively the past 2 years.
Fast Graphs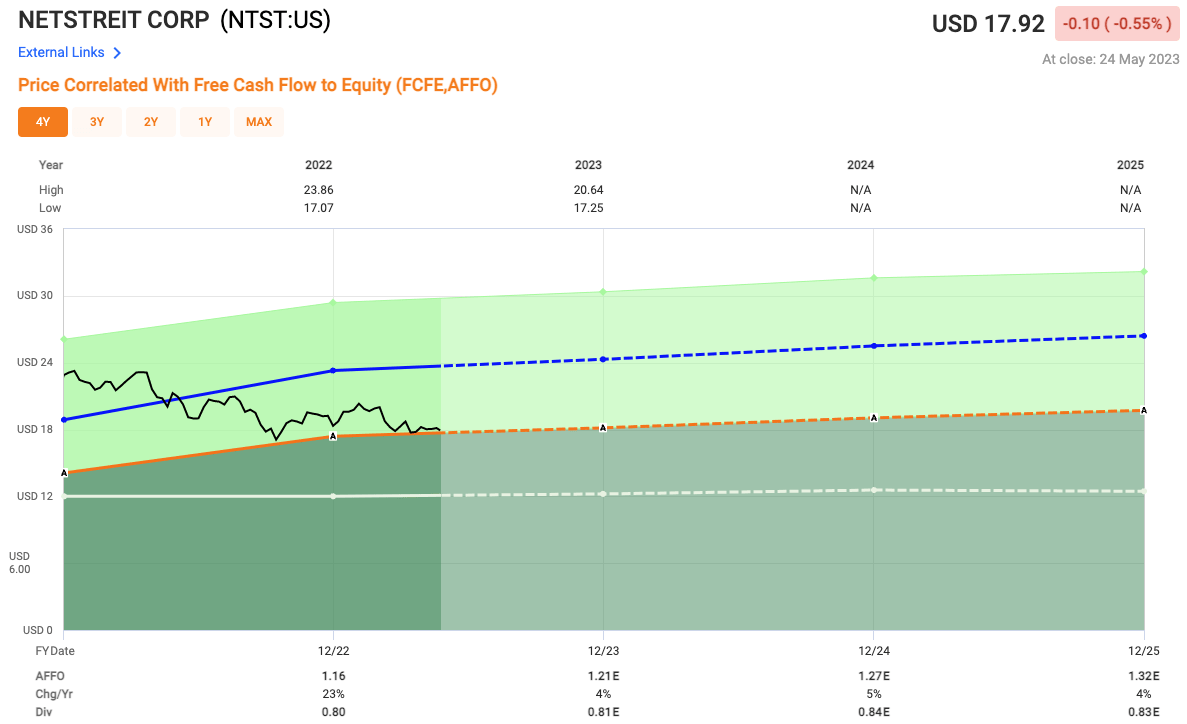
So as you can see, A LOT of similarities between both Netstreit Corp. and Realty Income. NTST is a MUCH younger company, but growing at a much faster clip. They are smaller in size, so it could add more volatility but also higher growth potential as well.
REIT #2 - Alpine Income Property Trust, Inc. (PINE)
Alpine is yet another net lease Retail REIT, similar to both Netstreit and Realty Income, but even smaller in size. PINE currently has a market cap of just $251 million, and over the past 12 months, shares of PINE are down 13%.
Seeking Alpha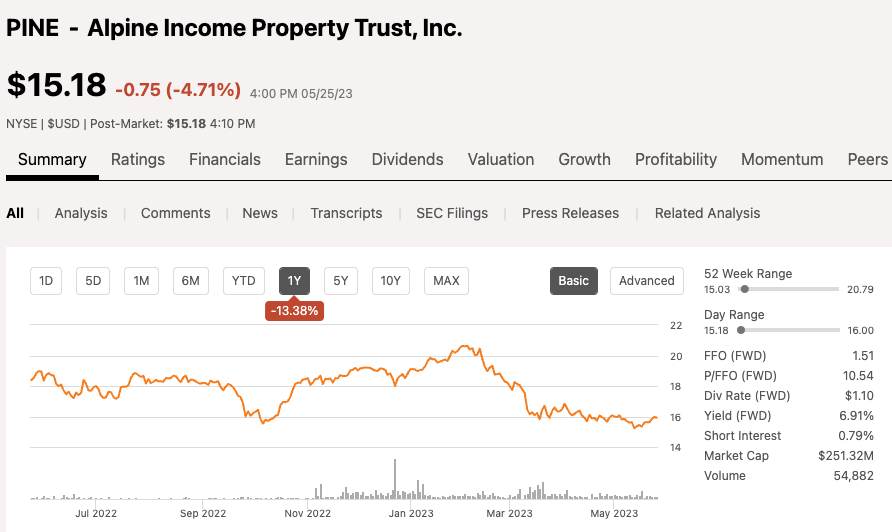
Alpine recently reported Q1 earnings that saw the company generate:
- FFO $0.36 per share compared to $0.37 per share expected
- Revenue: $11.17 million vs $11.80 expected.
The company missed revenues expectations and slightly missed FFO expectations for the quarter. In addition, the REIT sold 10 properties during the quarter which amounted to total gains of $4.5 million. Management also announced a small 2% dividend hike as well during the earnings event.
Alpine has 138 properties within 34 states which make up 3.5 million in leasable space, less than half the size of NTST and much smaller than Realty Income. PINE ended the most recent quarter with a high occupancy rate of 99.4%. When we looked at NTST’s investment grade exposure, we saw 67% was IG tenants, which can speak to the REITs safety. However, when we look at Alpine, they too have a high exposure rate of 58%.
PINE Q1 Investor Presentation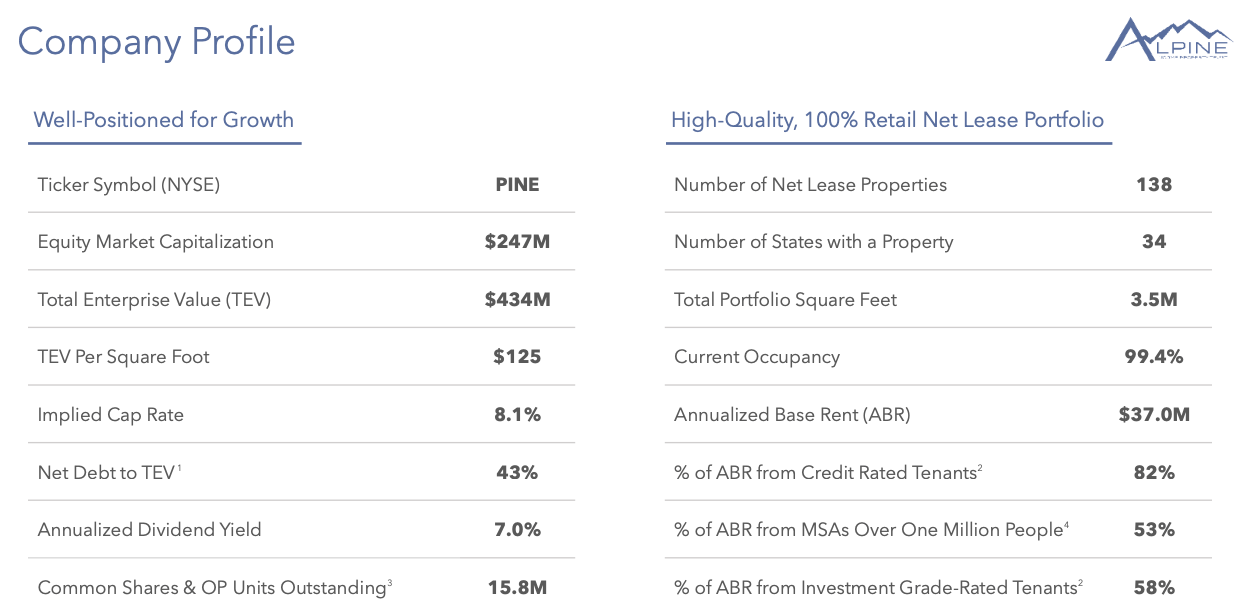
Next, let's take a look at top tenants. In the slide below, you can see the comparison to both NTST as well as Realty Income. There is a lot of crossover with the big exception being Dick's Sporting Goods, Inc. (DKS) for PINE. Shares of DKS have been on a tear the past year, with shares up over 55%.
PINE Q1 Investor Presentation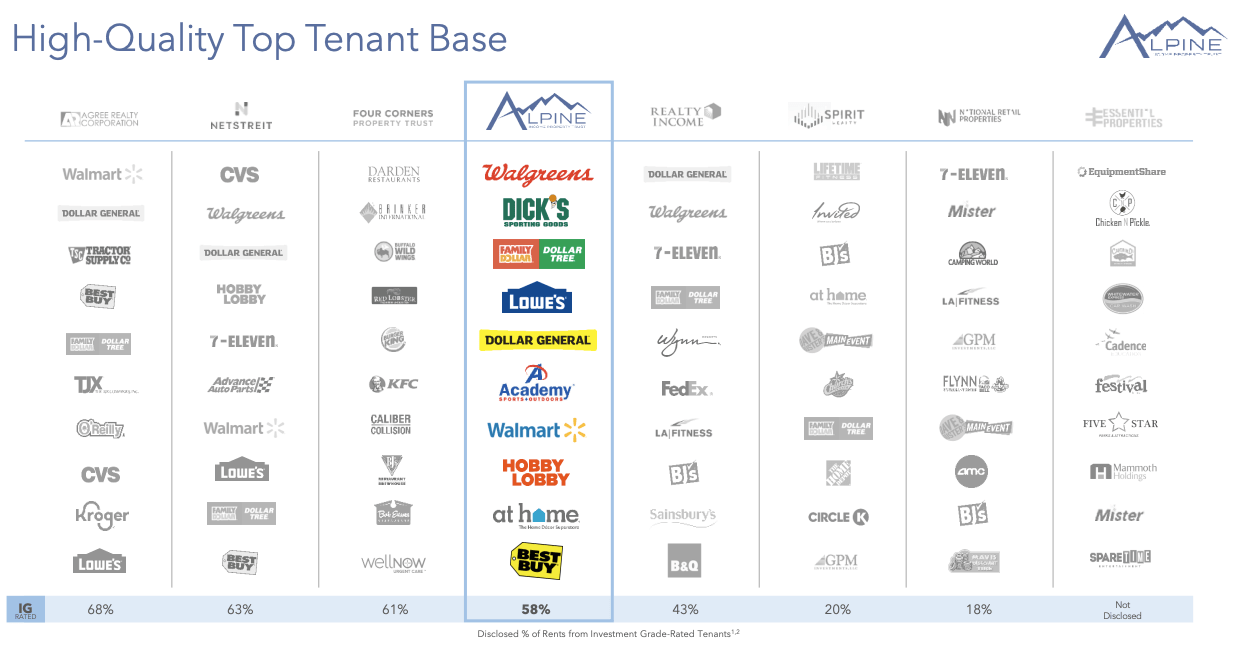
The top 10 tenants for Alpine account for 62% of annualized base rent, or ABR, an even higher exposure rate than NTST, and much more top heavy with Walgreens accounting for 13%.
Looking here you can see the diversification of the PINE portfolio with 15% exposure to Sporting Goods, 14% Dollar Stores, 14% Pharmacy, 9% Home Improvement, and 8% exposure to Home Furnishings
PINE Q1 Investor Presentation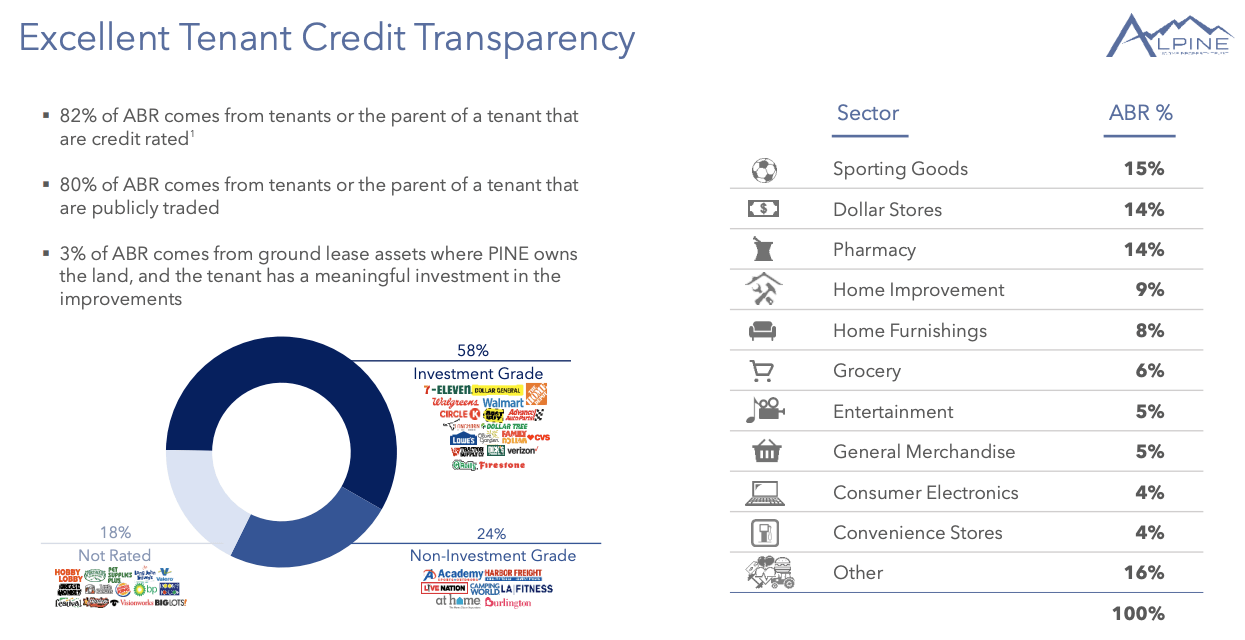
Alpine has $260 million in potential liquidity, which is much less than the $400 million NTST had and they have net debt to adjusted EBITDA of 6.4x. The REIT is also well insulated from rising interest rates as they have no current floating rate debt.
In terms of the dividend, Alpine pays a quarterly dividend, one that is MUCH higher than both Netstreit and Realty Income, as their dividend currently yields 6.9%. The dividend is well covered with an FFO payout ratio of 74%.
Now let's take a look at valuation. Alpine is another REIT that has not been around all that long, as they started trading in 2019. Analysts are calling for 2023 AFFO of $1.52 which is the low end of the range from management's guidance, which equates to a 2023 AFFO multiple of just 10.5x. Since going public, shares of PINE have traded closer to 12.6x as AFFO has grown at a clip of 53% and 11% respectively the past 2 years. Alpine shares are trading near all-time lows in terms of valuation.
Fast Graphs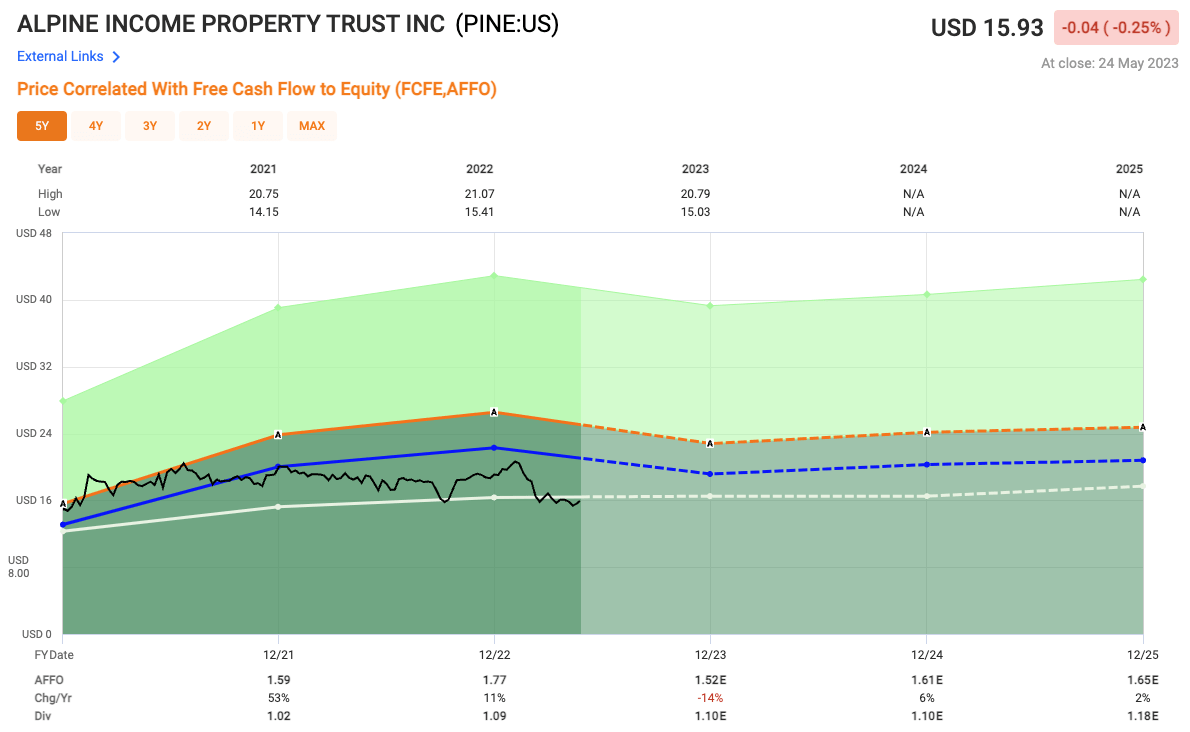
Investor Presentation
As you can see, there are some similarities when it comes to the make up between these REITs. They are not identical by any means.
With Realty Income, you get safety and consistency, but a REIT that is slower growing, largely due to size. In fact, shares of O are trading at a steep discount to their historical average as well right now.
With Netstreit Corp. and Alpine Income Property Trust, Inc., you get MUCH smaller REITs, that are still building out their portfolio, but they are doing it in the right way. Focusing on leasing to high-quality tenants that can withstand economic headwinds, which also lead to higher occupancy rates.
If you are looking for more growth, but with it comes higher risk, definitely give these two REITs a second look.
COMMENT BELOW: Which of these two REITs would you be more comfortable buying at these levels?
Disclosure: This article is intended to provide information to interested parties. I have no knowledge of your individual goals as an investor, and I ask that you complete your own due diligence before purchasing any stocks mentioned or recommended.
No marketing to add
This article was written by

Mark Roussin is an active Certified Public Accountant (CPA) in the state of California. Mark has worked as a CPA, serving both public and private Real Estate corporations for over 10 years. Today, he provides his followers insights to both undervalued dividend stocks mixed with high-growth opportunities with a goal of them reaching financial freedom in the long-term. Mark tends to invest primarily in dividend stocks with a strong emphasis on Real Estate Investment Trusts (REITs).
Mark has partnered with "iREIT on Alpha”, which is the premiere marketplace service that provides the best daily in-depth REIT research. The service boasts a community of like minded investors that also receive complete access to our various portfolios that you can track in real-time. Come check out all the exclusive content today!
-----------
DISCLAIMER: Mark is not a Registered Investment Advisor or Financial Planner. The Information in his articles and his comments on SeekingAlpha.com or elsewhere is provided for information purposes only. He asks that you perform your own due diligence or seek the advice of a qualified professional. You are responsible for your own investment decisions.
Analyst’s Disclosure: I/we have a beneficial long position in the shares of NTST, O either through stock ownership, options, or other derivatives. I wrote this article myself, and it expresses my own opinions. I am not receiving compensation for it (other than from Seeking Alpha). I have no business relationship with any company whose stock is mentioned in this article.
Seeking Alpha's Disclosure: Past performance is no guarantee of future results. No recommendation or advice is being given as to whether any investment is suitable for a particular investor. Any views or opinions expressed above may not reflect those of Seeking Alpha as a whole. Seeking Alpha is not a licensed securities dealer, broker or US investment adviser or investment bank. Our analysts are third party authors that include both professional investors and individual investors who may not be licensed or certified by any institute or regulatory body.