DHI Group Should See Slow 2023 Revenue Growth As Small Clients Falter

Summary
- DHI Group, Inc. reported its Q1 2023 financial results on May 10, 2023.
- The firm operates the online recruiting sites Dice.com and ClearanceJobs.com.
- DHI Group, Inc. management guided 2023 revenue growth to mid-single-digit growth.
- Given the macroeconomic slowdown possibly already underway and reduced hiring by technology companies, I'm Neutral [Hold] on DHI Group in the near term.
- Looking for more investing ideas like this one? Get them exclusively at IPO Edge. Learn More »
Thanakorn Lappattaranan/iStock via Getty Images
A Quick Take On DHI Group
DHI Group, Inc. (NYSE:DHX) reported its Q1 2023 financial results on May 10, 2023, beating both revenue and EPS consensus estimates.
The firm operates online recruitment websites Dice.com and ClearanceJobs.
Given the two potential catalysts of increased AI hiring and the potential for a pause in the rising cost of capital environment, the stock is likely to be rangebound for the near term, as I see no major organic catalyst ahead.
Accordingly, my outlook is Neutral [Hold] for DHX in the short-term.
DHI Group Overview
Centennial, Colorado-based DHI Group was founded in 1991 to provide jobseekers and employers with the ability to connect with each other for employment opportunities.
The firm is headed by Chief Executive Officer Art Zeile, who has been with the firm since 2018 and was previously founder and CEO of HOSTING and founder and CEO of Inflow.
The company’s primary offerings include the following:
Dice.com - IT and technology professional jobs
ClearanceJobs.com - employment requiring security clearances.
The firm acquires employers and jobseekers by marketing its services online and through its business development efforts.
DHI’s Market & Competition
According to a 2022 market research report by Sky Quest, the global market for online recruitment was estimated at $29.3 billion in 2021 and is forecast to reach $58.2 billion by 2030.
This represents a forecast CAGR (Compound Annual Growth Rate) of 7.1% from 2022 to 2030.
The main drivers for this expected growth are a robust employment market combined with increasing usage of AI technologies to improve efficiencies in finding the best employees for each organization.
Also, in 2021, the permanent segment accounted for the highest market share in the online recruitment industry. The IT category garnered the most activity during that year.
The Asia-Pacific region is expected to grow at the fastest rate of growth through 2030 even while the North American region retains the highest market share by region.
Industry participants include:
Indeed
Glassdoor
Monster Worldwide
CareerBuilder
SimplyHired
ZipRecruiter
Jobvite
iCIMS
ManpowerGroup
Others.
DHI Group’s Recent Financial Trends
Total revenue by quarter has risen according to the following chart:
Total Revenue (Seeking Alpha)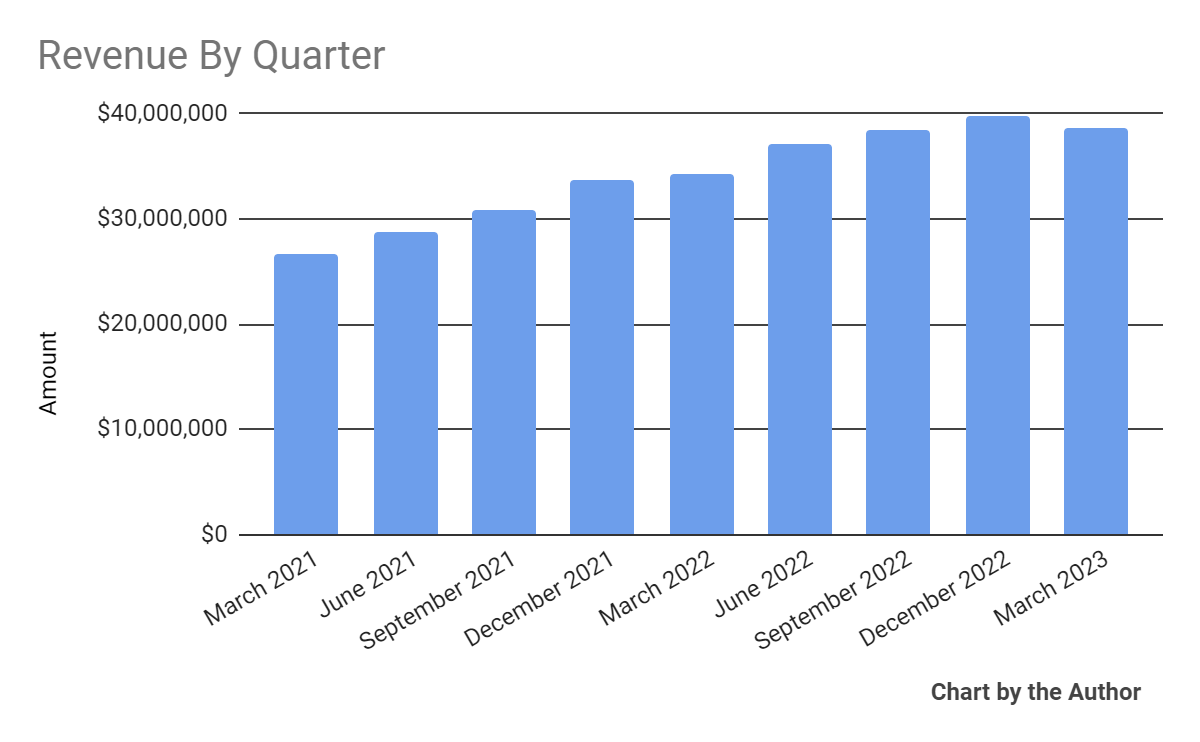
Gross profit margin by quarter has remained stable:
Gross Profit Margin (Seeking Alpha)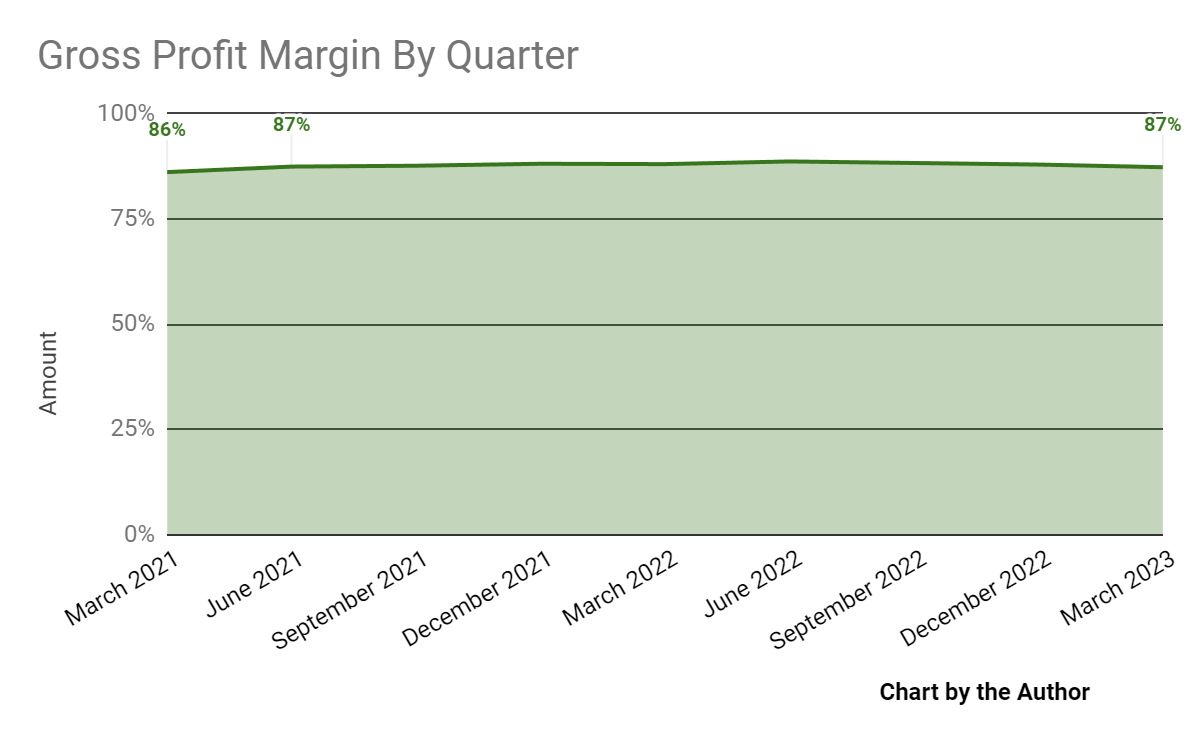
Selling, G&A expenses as a percentage of total revenue by quarter have slowly trended higher:
Selling, G&A % Of Revenue (Seeking Alpha)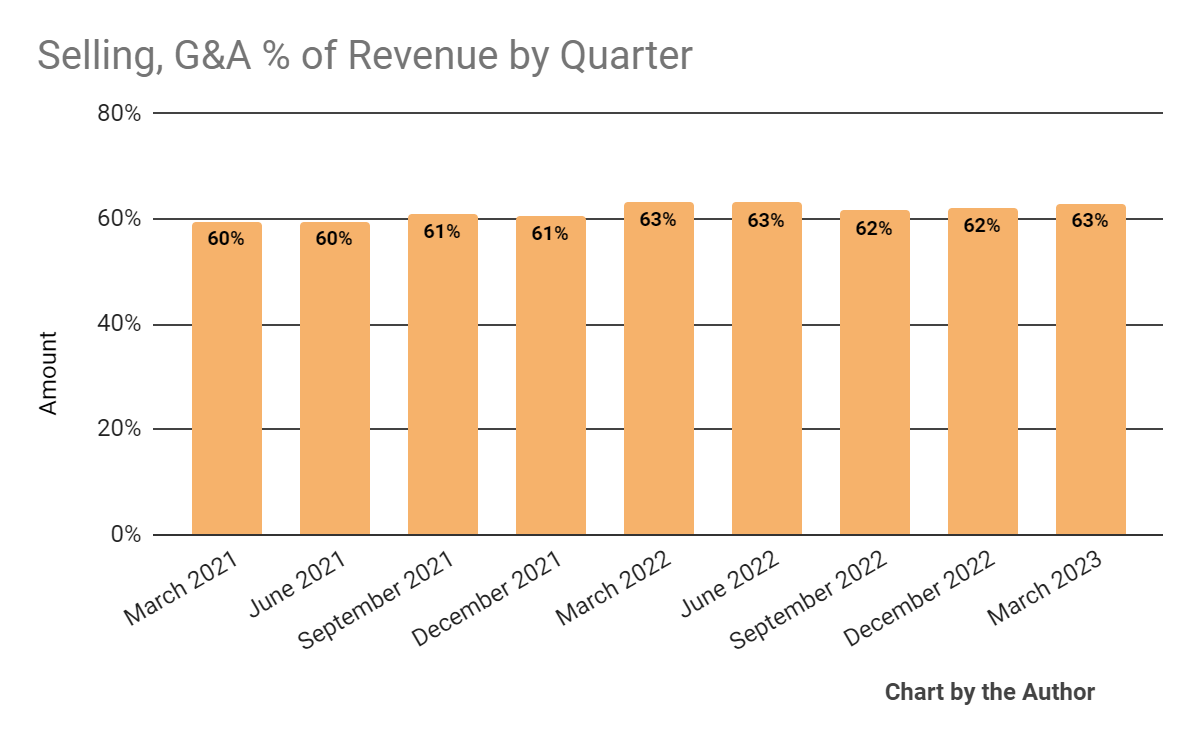
Operating income by quarter has risen in recent quarters:
Operating Income (Seeking Alpha)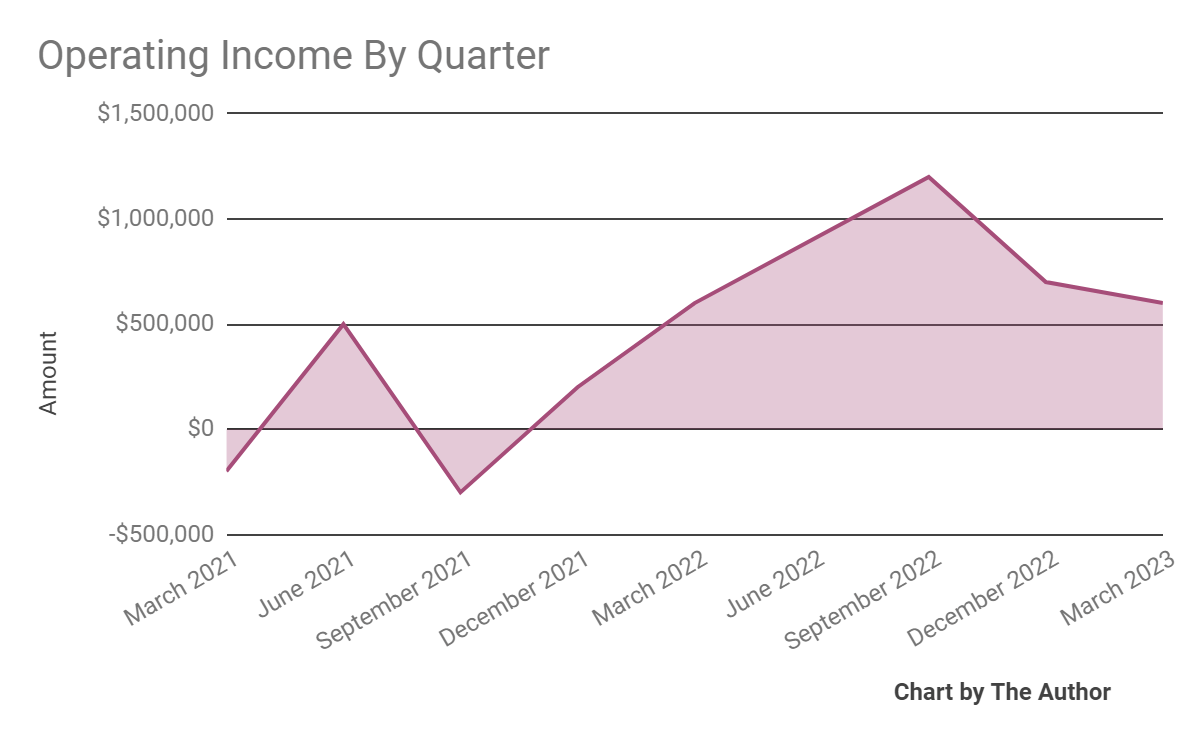
Operating leverage by quarter has trended lower in recent quarters:
Operating Leverage (Seeking Alpha)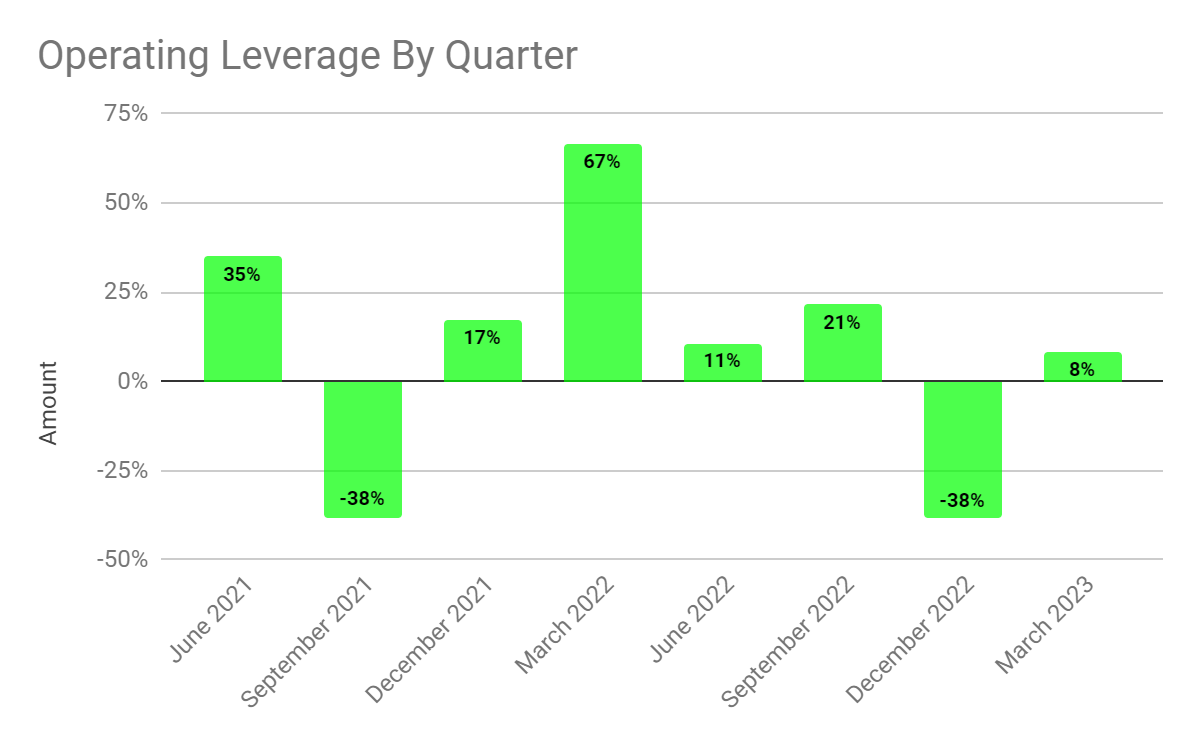
Earnings per share (Diluted) have produced no discernible trend recently:
Earnings Per Share (Seeking Alpha)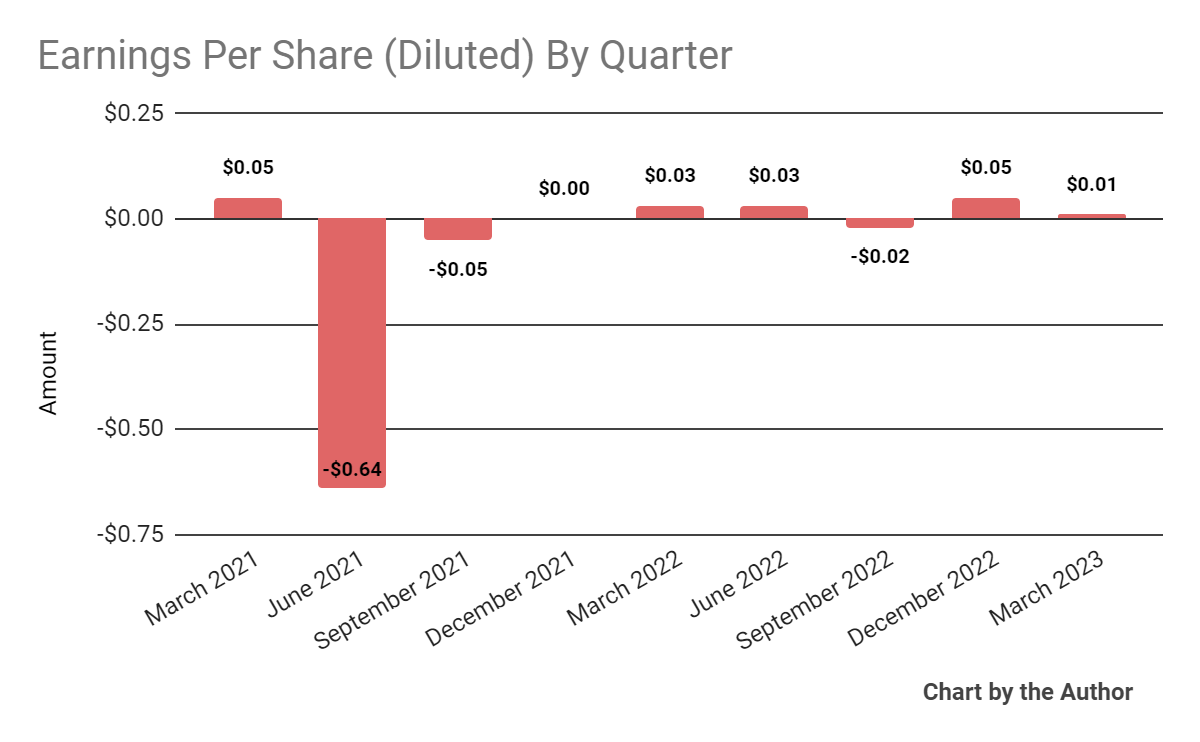
(All data in the above charts is GAAP.)
In the past 12 months, DHX’s stock price has fallen 42.94% vs. the ZipRecruiter, Inc. (ZIP) drop of 13.19%, as the chart indicates below:
52-Week Stock Price Comparison (Seeking Alpha)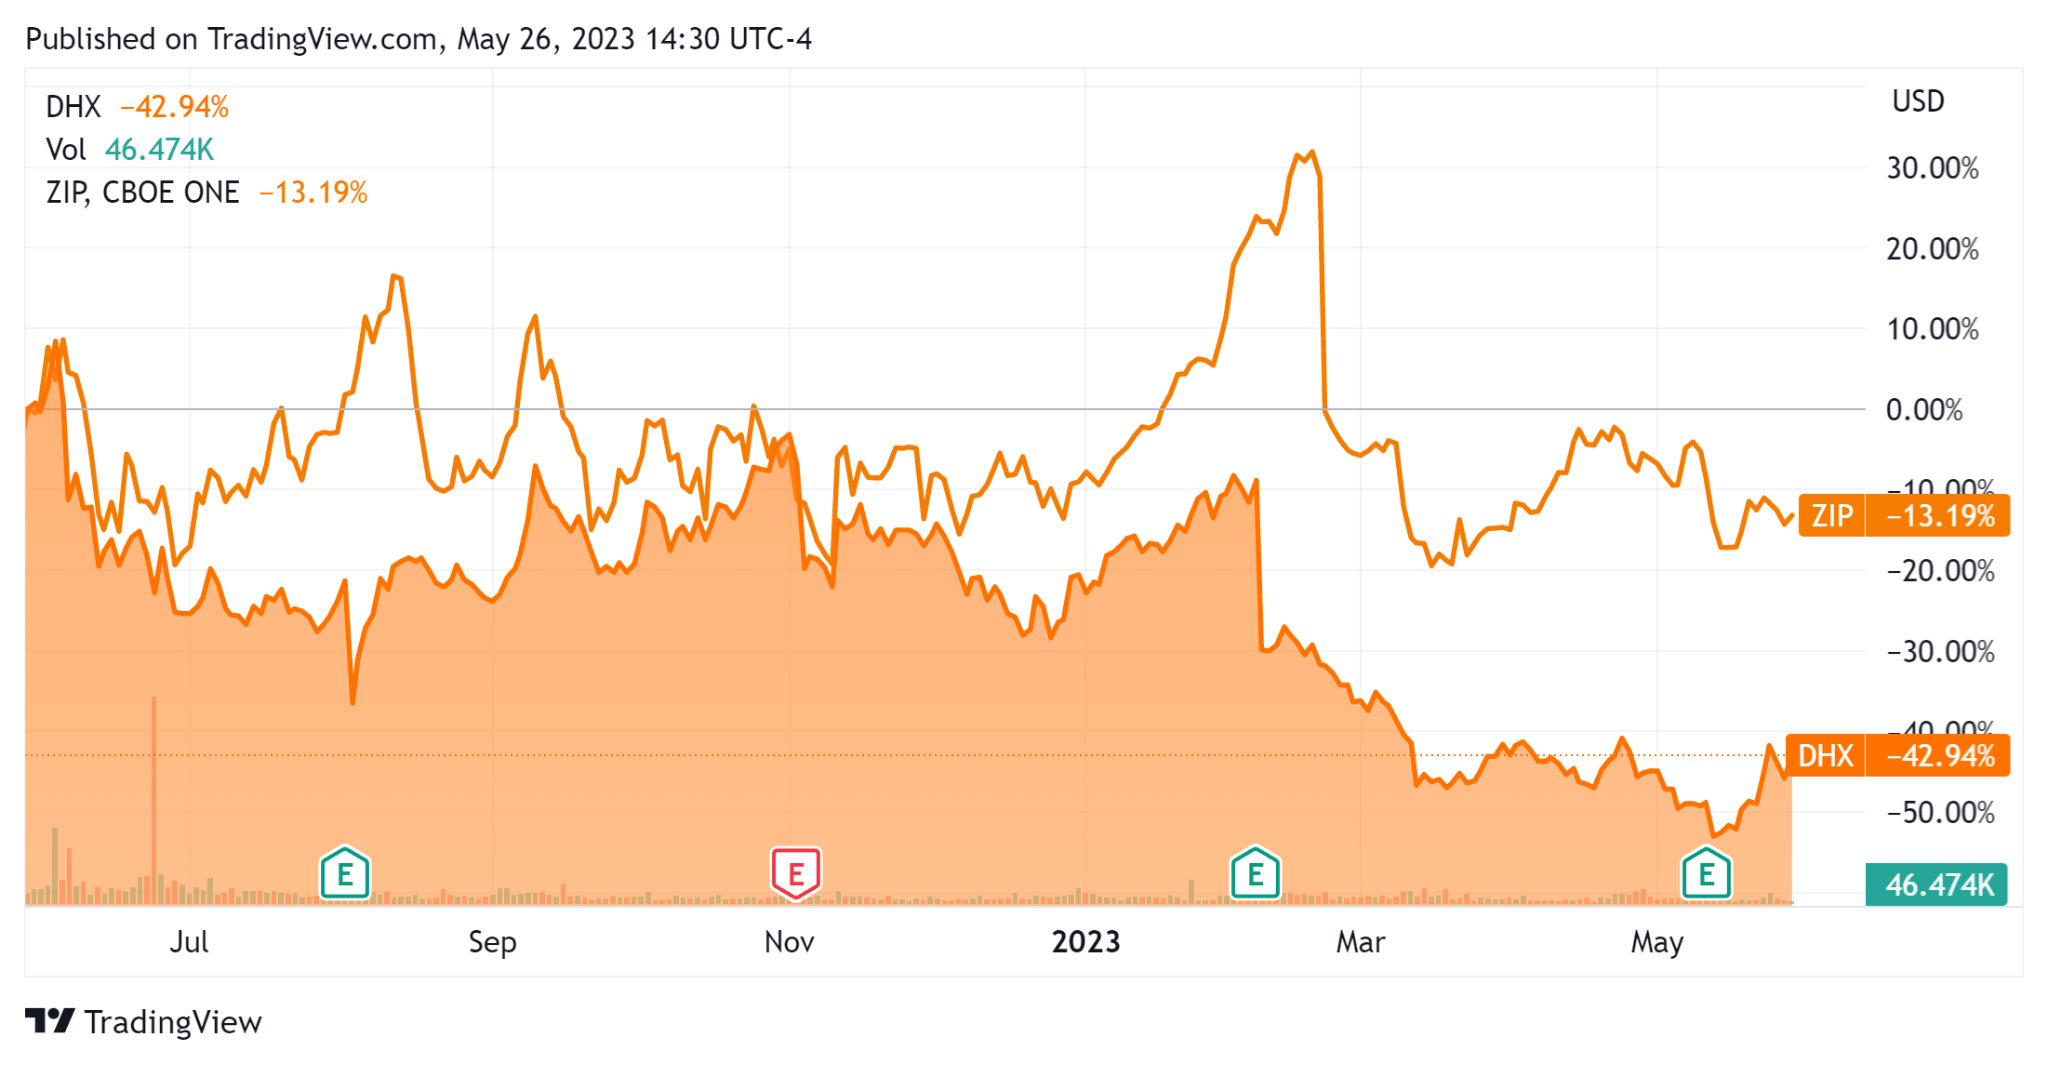
For the balance sheet, the firm ended the quarter with $5.4 million in cash and equivalents and $46.0 million in total debt, none of which was categorized as the current portion due within 12 months.
Over the trailing twelve months, free cash flow was $8.1 million, of which capital expenditures accounted for $18.7 million. The company paid $10.2 million in stock-based compensation in the last four quarters, the highest trailing twelve-month result in the past eleven quarters.
Valuation And Other Metrics For DHI Group
Below is a table of relevant capitalization and valuation figures for the company:
Measure [TTM] | Amount |
Enterprise Value / Sales | 1.4 |
Enterprise Value / EBITDA | 10.2 |
Price / Sales | 1.1 |
Revenue Growth Rate | 20.7% |
Net Income Margin | 2.2% |
EBITDA % | 13.7% |
Net Debt To Annual EBITDA | 1.9 |
Market Capitalization | $166,990,000 |
Enterprise Value | $215,630,000 |
Operating Cash Flow | $26,830,000 |
Earnings Per Share (Fully Diluted) | $0.07 |
(Source - Seeking Alpha/)
As a reference, a relevant partial public comparable would be ZipRecruiter; shown below is a comparison of their primary valuation metrics:
Metric [TTM] | ZipRecruiter | DHI Group | Variance |
Enterprise Value / Sales | 1.9 | 1.4 | -24.7% |
Enterprise Value / EBITDA | 16.5 | 10.2 | -38.2% |
Revenue Growth Rate | 2.2% | 20.7% | 862.8% |
Net Income Margin | 6.8% | 2.2% | -67.9% |
Operating Cash Flow | $120,750,000 | $26,830,000 | -77.8% |
(Source - Seeking Alpha.)
The Rule of 40 is a software industry rule of thumb that says that as long as the combined revenue growth rate and EBITDA percentage rate equal or exceed 40%, the firm is on an acceptable growth/EBITDA trajectory.
DHX’s most recent Rule of 40 calculation was 34.4% as of Q1 2023’s results, so the firm has performed moderately well in this regard, per the table below:
Rule of 40 Performance | Calculation |
Recent Rev. Growth % | 20.7% |
EBITDA % | 13.7% |
Total | 34.4% |
(Source - Seeking Alpha.)
Commentary On DHI Group
In its last earnings call (Source - Seeking Alpha), covering Q1 2023’s results, management highlighted the changing sales strategy as the firm faces heightened macro challenges from current softness in technology industry hiring.
Leadership noted that most attrition the firm is seeing is in customers that spend less than $10,000 annually.
The company is also focused on larger customers, as its experience shows that they are less likely to leave.
DHI finished the quarter with a total backlog of $124.2 million, an increase of 17% YoY.
The company’s Dice.com retention rate was 105%, indicating reasonably good sales & marketing efficiency.
Total revenue for Q1 2023 rose 12.5% year-over-year, while gross profit margin fell 0.7 percentage points.
Selling, G&A expenses as a percentage of revenue decreased by 0.3 percentage points year-over-year, and operating income was unchanged from a year earlier.
Looking ahead, management guided full-year 2023 total revenue growth at 5.5% at the midpoint of the range, which, if achieved, would be substantially lower than 2022’s growth rate of nearly 25%.
The company's financial position is moderate, while its net debt-to-EBITDA multiple is 1.9x.
The primary risk to the company’s outlook is the likelihood of a worsening hiring environment in the technology industry, which may not be offset by its government hiring segment.
From management’s most recent earnings call, I prepared a chart showing the frequency of key terms mentioned (or not) in the call, as shown below:
Earnings Transcript Key Terms Frequency (Seeking Alpha)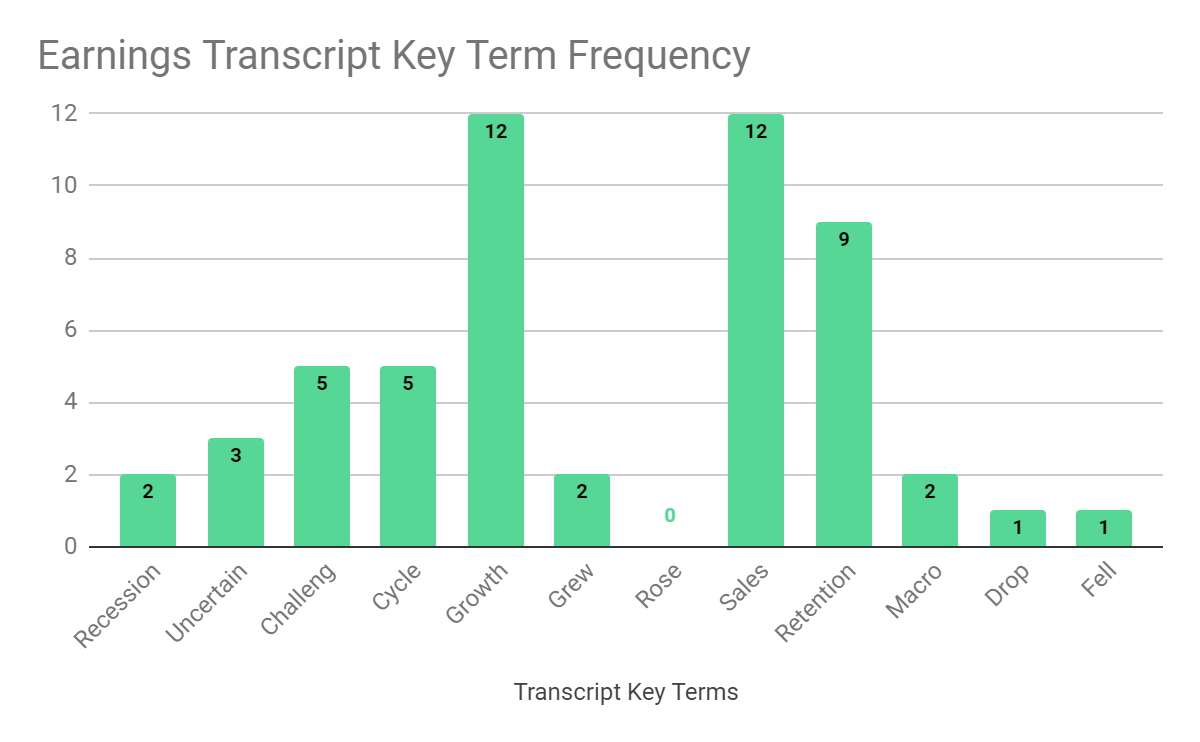
I’m most interested in the frequency of potentially negative terms, so management cited "Recession" two times, "Uncertain" three times, "Challeng[es][ing]" five times, "Macro" two times, "Drop" and "Fell" once each.
The negative terms refer to the difficult hiring environment for tech companies, many of whom hired excessively during the pandemic and are now having to reduce headcount in the face of a slowing economy.
In the past twelve months, the firm's EV/EBITDA valuation multiple has dropped by 46.6%, as the chart from Seeking Alpha shows below:
EV/EBITDA Multiple History (Seeking Alpha)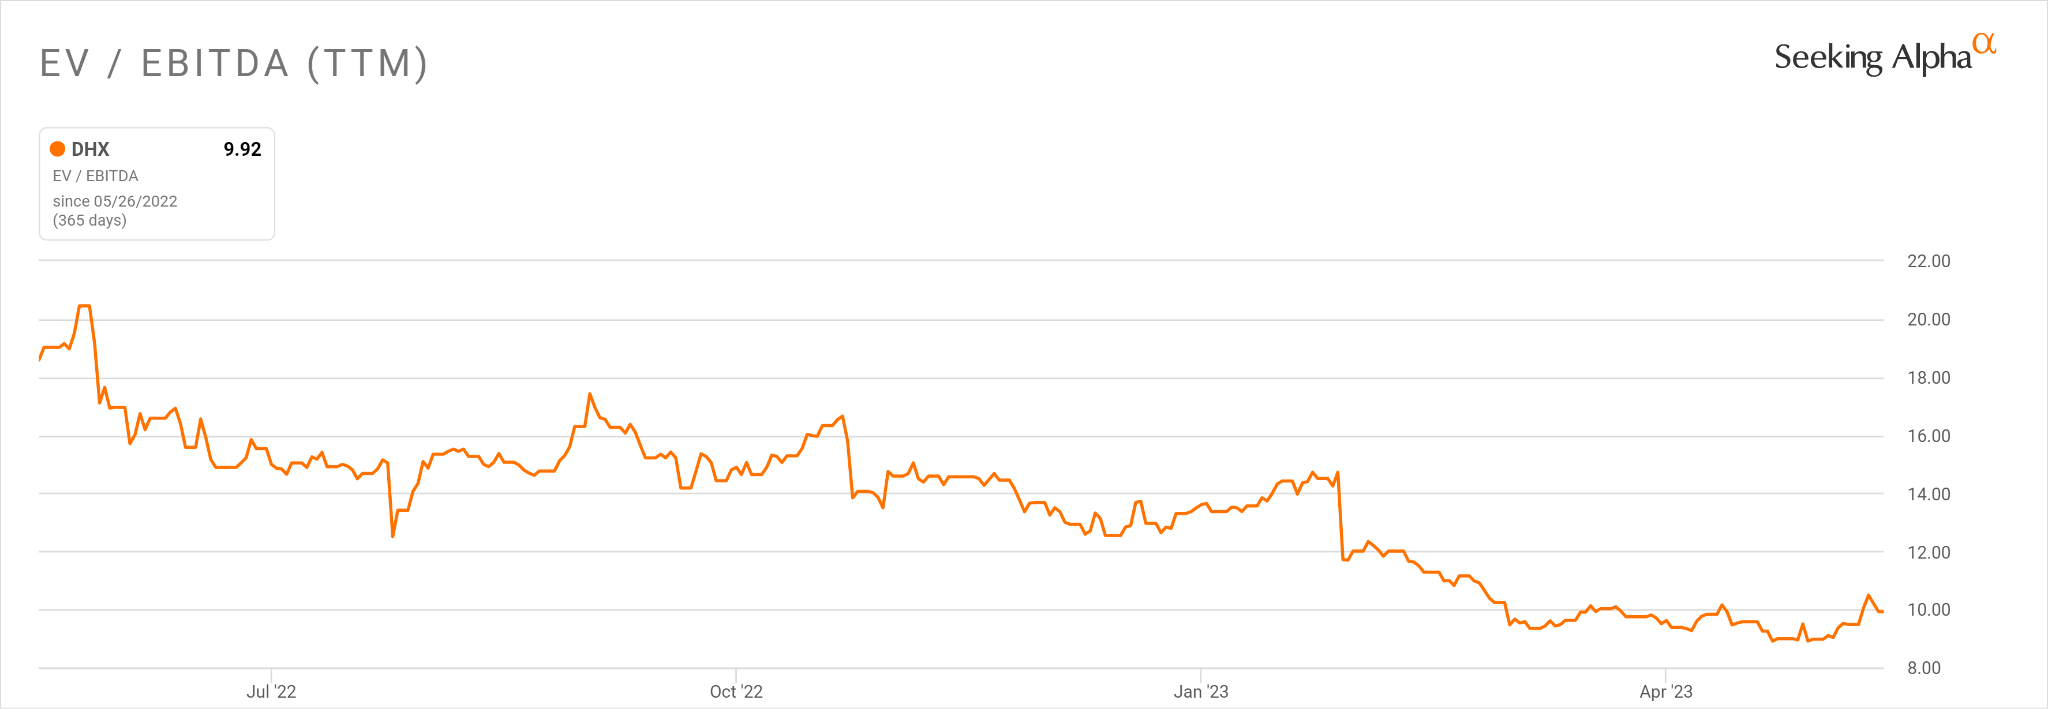
A potential upside catalyst to DHI Group, Inc. stock could include a pause in the rising cost of capital or increased hiring in the AI space within the technology industry.
However, even given those two potential catalysts, DHI Group, Inc. stock is likely to be rangebound for the near term, as I see no major organic catalyst ahead.
Accordingly, my outlook is Neutral [Hold] for DHI Group, Inc. in the short-term.

Gain Insight and actionable information on U.S. IPOs with IPO Edge research.
Members of IPO Edge get the latest IPO research, news, and industry analysis.
Get started with a free trial!
This article was written by

I'm the founder of IPO Edge on Seeking Alpha, a research service for investors interested in IPOs on US markets. Subscribers receive access to my proprietary research, valuation, data, commentary, opinions, and chat on U.S. IPOs. Join now to get an insider's 'edge' on new issues coming to market, both before and after the IPO. Start with a 14-day Free Trial.
Analyst’s Disclosure: I/we have no stock, option or similar derivative position in any of the companies mentioned, and no plans to initiate any such positions within the next 72 hours. I wrote this article myself, and it expresses my own opinions. I am not receiving compensation for it (other than from Seeking Alpha). I have no business relationship with any company whose stock is mentioned in this article.
Seeking Alpha's Disclosure: Past performance is no guarantee of future results. No recommendation or advice is being given as to whether any investment is suitable for a particular investor. Any views or opinions expressed above may not reflect those of Seeking Alpha as a whole. Seeking Alpha is not a licensed securities dealer, broker or US investment adviser or investment bank. Our analysts are third party authors that include both professional investors and individual investors who may not be licensed or certified by any institute or regulatory body.