TMF: Eyeing A Contrarian Play On Lower Long-Term Rates

Summary
- Economic resiliency has been impressive recently, helping to send long-term rates higher.
- I see a bit too much froth, however, and seasonal trends along with technical support on 30-year Treasury futures are bullish.
- I have a buy rating on this leveraged ETF, but investors must understand the risks.
Torsten Asmus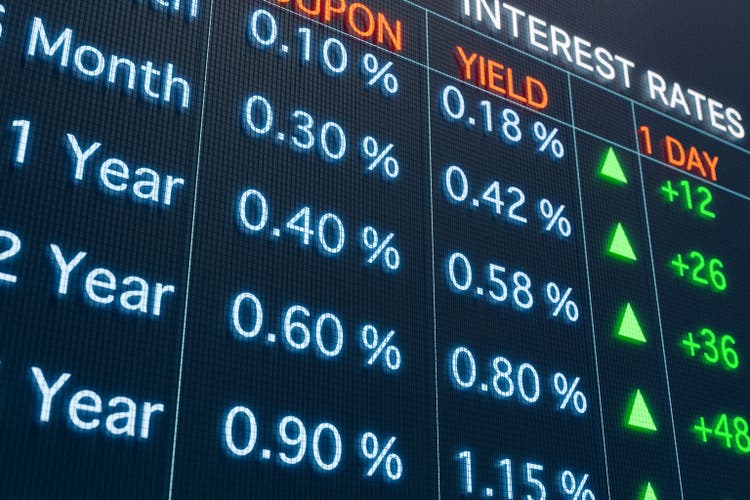
Interest rates have been marching higher at a rather fast pace in the last several weeks. The 1-year yield is now near its cycle highs, while the 2-year rate has climbed back above 4.5%. The long end of the curve has also endured selling pressure since early April - the 30-year Treasury rate is now above 4% to almost the highest level since November last year. Are winds about to change, though?
I have a buy rating on the Direxion Daily 20+ Year Treasury Bull & Bear 3X (NYSEARCA:TMF) as I see the potential for rates to fall in the coming months ahead of a possible U.S. recession and bonds' bullish seasonal factors. Of course, traders must be mindful of the inherent risks of owning leveraged ETPs beyond a single trading session (risk links listed at the end of the article).
Yields Ticking Back Up Toward Cycle Highs
Koyfin Charts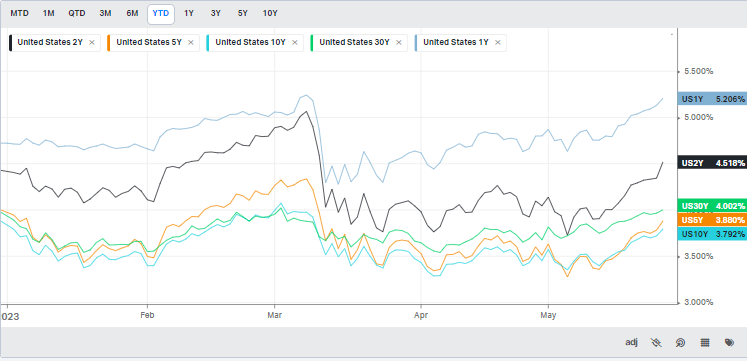
Following strong Q1 GDP numbers reported on Thursday morning along with a hot set of PCE price data figures, not to mention another low Jobless Claims report, the market has continued to trend toward rate hikes more likely than rate cuts.
Traders have priced in a rate hike through July, while the policy rate may not dip under 5% until January next year. With a looming economic contraction that could still be in the cards later this year, I think the market has once again gotten too optimistic about growth prospects. I see more downside risk to yields rather than upside.
Higher Rates Now Expected
CME FedWatch Tool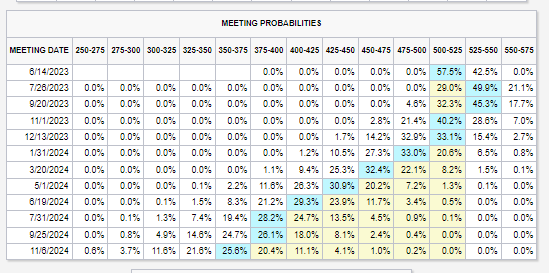
According to the issuer, TMF seeks daily investment results, before fees and expenses, of 300%, or 300% of the inverse (or opposite), of the performance of the ICE U.S. Treasury 20+ Year Bond Index. There is no guarantee the funds will meet their stated investment objectives, per Direxion.
These leveraged ETFs seek a return that is 300% or -300% of the return of their benchmark index for a single day. The funds should not be expected to provide three times or negative three times the return of the benchmark's cumulative return for periods greater than a day.
TMF ETF Characteristics
Direxion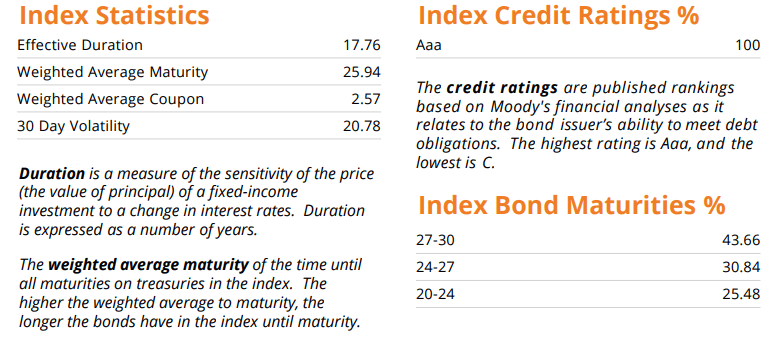
TMF is a simple product to understand. It holds only long-duration Treasury bonds and uses derivatives to gain leverage in the market. Holders can enhance returns over short timeframes through TMF with liquidity. Volatility generally hurts the product due to negative compounding effects, but a trending market can also work to the benefit of TMF investors when rates fall (bond prices rise).
My thesis is that the market has tilted too far in the camp of higher long-term rates - which is a sign of economic optimism rather than a play on what the Fed will do. Should some economic data verify softer than forecast, I expect buying of long-dated Treasuries, putting downward pressure on yields and boosting TMF's price.
Seasonally, the long bond tends to rally hard now through August, according to data from Equity Clock. That means rates, on average, fall amid a sometimes-risk-off environment during the back half of Q2 through the first part of Q3. That also means TMF would do well in such an environment.
The Long Bond Tends To Rally Now Through August
Equity Clock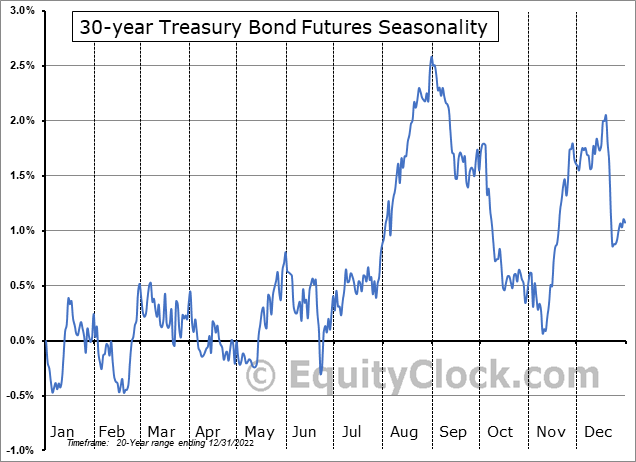
The Technical Take
With a bullish seasonal period about to ensue, the technical chart of the iShares 30+ Year Treasury ETF (TLT) is a good gauge of possible technical patterns to play out with TMF, but without the distortion of negative compounding impacts. So, analysis of the TLT chart is better than using TMF. With TLT, I see an emerging bearish to bullish reversal. With the current range being tested on the supportive end, I would expect TLT to bounce (which means lower yields, and higher TMF prices).
I will be keeping my eye on the $98 to $100 range for support in the coming days. $108 to $110 on TLT is resistance - a breakout above that would lead to a price target of $120. Also notice in the chart below how the 50-day moving average has just recently crossed above the 200-day in a golden cross pattern, though the long-term 200-day is still downward sloping, which is bearish.
TLT: Shares Near Key Support, Expecting A Bounce
Stockcharts.com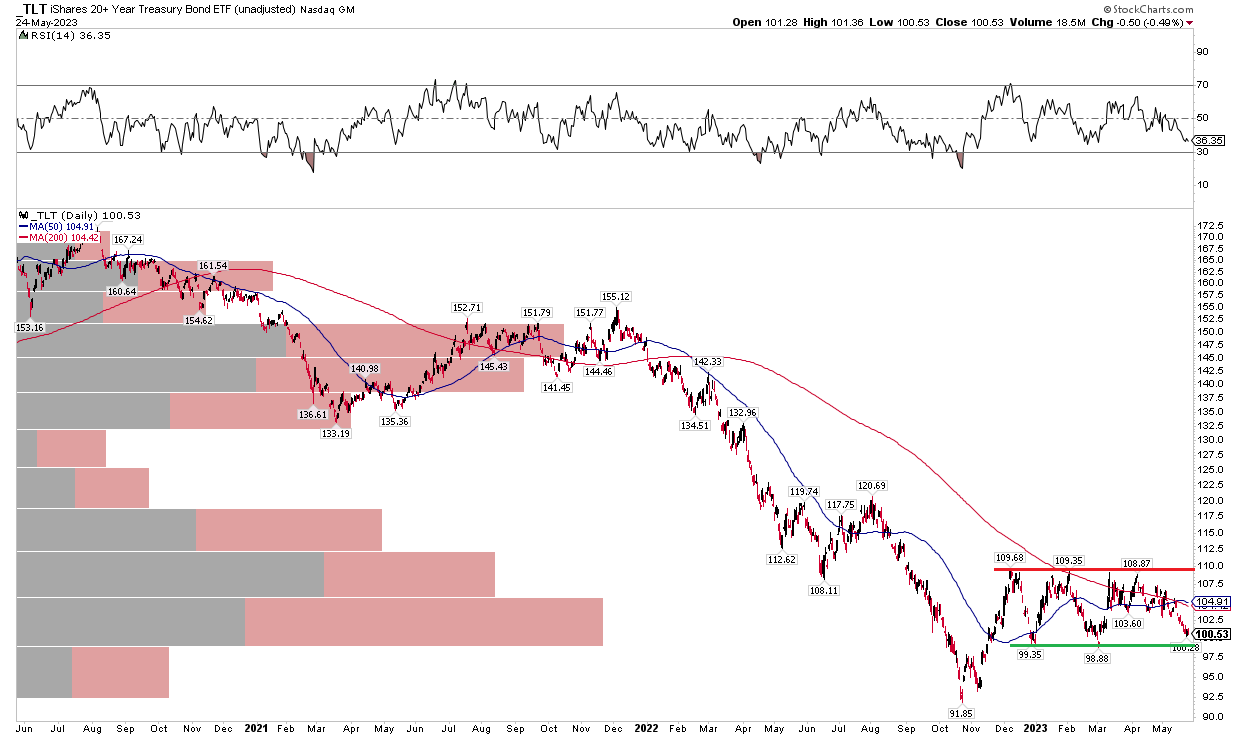
The Bottom Line
I am bullish on TMF in the short run. We are entering a positive seasonal stretch, while TLT is back near key support.
1) The Lowdown on Leveraged and Inverse Exchange-Traded Products (FINRA).
2) Leveraged and Inverse ETFs: Specialized Products with Extra Risks for Buy-and-Hold Investors (SEC).
3) FINRA's Reminder on sales practices for Leveraged and Inverse ETFs (FINRA)
This article was written by

Analyst’s Disclosure: I/we have no stock, option or similar derivative position in any of the companies mentioned, and no plans to initiate any such positions within the next 72 hours. I wrote this article myself, and it expresses my own opinions. I am not receiving compensation for it (other than from Seeking Alpha). I have no business relationship with any company whose stock is mentioned in this article.
Seeking Alpha's Disclosure: Past performance is no guarantee of future results. No recommendation or advice is being given as to whether any investment is suitable for a particular investor. Any views or opinions expressed above may not reflect those of Seeking Alpha as a whole. Seeking Alpha is not a licensed securities dealer, broker or US investment adviser or investment bank. Our analysts are third party authors that include both professional investors and individual investors who may not be licensed or certified by any institute or regulatory body.