MGV ETF: Attractive Valuation, Average Performance

Summary
- Vanguard Mega Cap Value Index Fund ETF Shares selects large-cap stocks using five metrics.
- The heaviest sectors are healthcare and financials.
- Valuation ratios and fees are attractive.
- However, it has lagged the benchmark and at least two competitors since inception.
- Two weaknesses of value indexes.
- Quantitative Risk & Value members get exclusive access to our real-world portfolio. See all our investments here »
deepblue4you
This article series aims at evaluating exchange-traded funds (ETF) regarding the relative past performance of their strategies and metrics of their current portfolios. As holdings change over time, updated reviews are posted from time to time.
MGV Strategy And Portfolio
Vanguard Mega Cap Value Index Fund ETF Shares (NYSEARCA:MGV) started investing operations on 12/17/2007 and is tracking the CRSP US Mega Cap Value Index. It has a portfolio of 143 stocks, a dividend yield of 2.59% and a cheap expense ratio of 0.07%. Distributions are paid quarterly.
As described on the CRSP website,
CRSP classifies value securities using the following factors: book to price, forward earnings to price, historic earnings to price, dividend-to-price ratio and sales-to-price ratio.
The fund has a low turnover rate: 8% for the most recent fiscal year. It invests almost exclusively in U.S. companies (99.4% of asset value). The heaviest sectors are healthcare (21.1%), financials (19%), industrials (14.2%) and consumer staples (12.2%). Other sectors are below 10% individually and 34% in aggregate. Compared to the S&P 500 (SP500), MGV overweights the top four sectors listed above, plus energy and utilities. It underweights mostly technology, consumer discretionary and communication services.
Sector breakdown (chart: author; data: Vanguard, SSGA)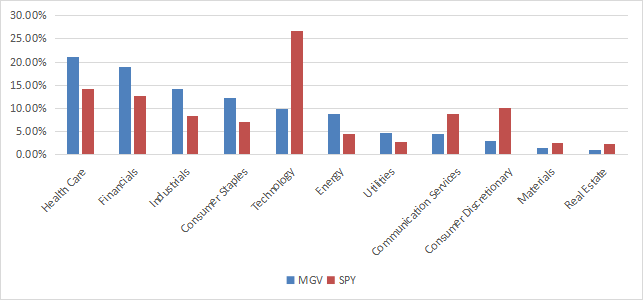
As expected, MGV is cheaper than the S&P 500 regarding the usual valuation ratios, as reported in the next table.
MGV | SPY | |
Price/Earnings TTM | 16.22 | 21.21 |
Price/Book | 2.61 | 3.77 |
Price/Sales | 1.79 | 2.4 |
Price/Cash Flow | 11.44 | 15.29 |
The top 10 holdings, listed below with valuation metrics, represent 27.2% of asset value. They are all below 4%, so risks related to individual companies are moderate.
Ticker | Name | Weight | P/E ttm | P/E fwd | P/Sales | P/Book | P/Net Free Cash-Flow | Yield |
Berkshire Hathaway, Inc. | 3.61% | 92.31 | 20.72 | 2.21 | 1.39 | 30.41 | 0 | |
Exxon Mobil Corp. | 3.48% | 7.28 | 10.63 | 1.12 | 2.22 | 10.14 | 3.38 | |
UnitedHealth Group, Inc. | 3.32% | 21.99 | 19.25 | 1.35 | 5.58 | 16.17 | 1.37 | |
Johnson & Johnson | 3.08% | 32.76 | 14.71 | 4.24 | 5.76 | 93.40 | 3.04 | |
JPMorgan Chase & Co. | 2.94% | 9.98 | 9.30 | 2.24 | 1.46 | 8.99 | 2.96 | |
Procter & Gamble Co. | 2.67% | 25.49 | 24.98 | 4.47 | 8.17 | 112.11 | 2.57 | |
Merck & Co., Inc. | 2.12% | 22.19 | 16.28 | 5.08 | 6.19 | 69.96 | 2.57 | |
Chevron Corp. | 2.09% | 8.50 | 11.02 | 1.29 | 1.87 | 11.55 | 3.84 | |
AbbVie, Inc. | 1.93% | 33.24 | 12.83 | 4.42 | 18.89 | 18.79 | 4.19 | |
Meta Platforms, Inc. | 1.93% | 30.91 | 21.14 | 5.51 | 5.18 | 36.83 | 0 |
Performance
The next chart compares the total returns of MGV, SPDR® S&P 500 ETF Trust (SPY), and three large-cap value ETFs:
- iShares S&P 500 Value ETF (IVE)
- First Trust Large Cap Value AlphaDEX Fund (FTA)
- Invesco Dynamic Large Cap Value ETF (PWV)
MGV vs. SPY and competitors since inception (Seeking Alpha)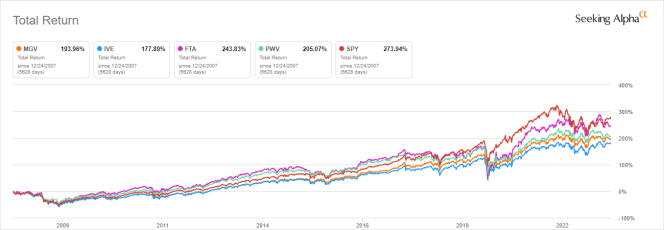
MGV beats IVE and lags the other funds in the list. In the last 12 months, it is in the middle of the pack, and close to flat:
MGV vs. SPY and competitors, last 12 months (Seeking Alpha)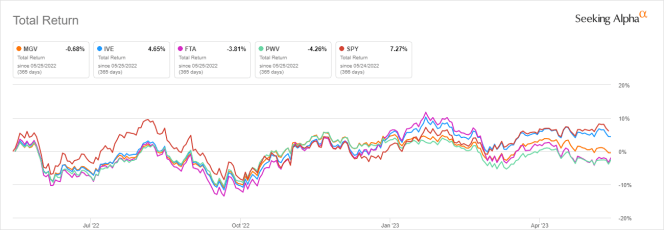
Comparing MGV With My Dashboard List model
The Dashboard List is a list of 80 stocks in the S&P 1500 index, updated every month based on a simple quantitative methodology. All stocks in the Dashboard List are cheaper than their respective industry median in Price/Earnings, Price/Sales and Price/Free Cash Flow. After this filter, the 10 companies with the highest Return on Equity in every sector are kept in the list. Some sectors are grouped together: energy with materials, communication with technology. Real estate is excluded because these valuation metrics don't work well in this sector. I have been updating the Dashboard List every month on Seeking Alpha since December 2015, first in free-access articles, then in Quantitative Risk & Value.
The next table compares MGV performance since 1/1/2008 with the Dashboard List model, with a tweak: here the Dashboard List is rebalanced annually to make it comparable with a passive index.
Total Return | Annual Return | Drawdown | Sharpe Ratio | Volatility | |
MGV | 201.14% | 7.42% | -55.13% | 0.52 | 15.99% |
Dashboard List (annual) | 341.56% | 10.13% | -53.00% | 0.57 | 19.54% |
Past performance is not a guarantee of future returns. Data Source: Portfolio123.
The Dashboard List beats MGV by 2.7% in annualized return. However, ETF metrics are real, and the model is simulated.
Methodological Weaknesses
Like most value funds, Vanguard Mega Cap Value Index Fund ETF Shares ranks all stocks on the same criteria. It means the valuation ratios are considered comparable across sectors and industries. Obviously, they are not: my monthly dashboard here shows how valuation and quality metrics may vary across sectors. A consequence is to privilege sectors where valuation ratios are naturally cheaper, especially financials.
The second weakness comes from the book-to-price ratio, which adds some risk in the strategy. Historical data show that a large group of companies with low price/book has a higher probability to hold value traps than a same-size group with low price/earnings, price/sales or price/free cash flow. Statistically, such a group will also have a higher volatility and deeper drawdowns in price. The next table shows the return and risk metrics of the cheapest quarter of the S&P 500 (i.e., 125 stocks) measured in price/book, price/earnings, price/sales and price/free cash flow. The sets are reconstituted annually between 1/1/2000 and 1/1/2023 with elements in equal weight.
Annual Return | Drawdown | Sharpe Ratio | Volatility | |
Cheapest quarter in P/B | 8.54% | -81.55% | 0.35 | 37.06% |
Cheapest quarter in P/E | 10.71% | -73.62% | 0.48 | 25.01% |
Cheapest quarter in P/S | 12.82% | -76.16% | 0.47 | 34.83% |
Cheapest quarter in P/FCF | 15.32% | -74.77% | 0.61 | 27.03% |
Data calculated with Portfolio123.
This explains why I use P/FCF and not P/B in the Dashboard List model.
Takeaway
Vanguard Mega Cap Value Index Fund ETF Shares selects large-cap companies using a ranking system based on five valuation metrics. It is cheaper than the large-cap benchmark SPY in valuation, and also in expense ratio. However, it has lagged SPY and at least two competitors since inception. Most value ETFs have two methodological weaknesses, and Vanguard Mega Cap Value Index Fund ETF Shares is not an exception: stocks are ranked regardless of their industries, and the book-to-price ratio is a factor increasing volatility.
Quantitative Risk & Value (QRV) features data-driven strategies in stocks and closed-end funds outperforming their benchmarks since inception. Get started with a two-week free trial now.

This article was written by

Step up your investing experience: try Quantitative Risk & Value for free now (limited offer).
I am an individual investor and an IT professional, not a finance professional. My writings are data analysis and opinions, not investment advice. They may contain inaccurate information, despite all the effort I put in them. Readers are responsible for all consequences of using information included in my work, and are encouraged to do their own research from various sources.
Analyst’s Disclosure: I/we have a beneficial long position in the shares of META either through stock ownership, options, or other derivatives. I wrote this article myself, and it expresses my own opinions. I am not receiving compensation for it (other than from Seeking Alpha). I have no business relationship with any company whose stock is mentioned in this article.
Seeking Alpha's Disclosure: Past performance is no guarantee of future results. No recommendation or advice is being given as to whether any investment is suitable for a particular investor. Any views or opinions expressed above may not reflect those of Seeking Alpha as a whole. Seeking Alpha is not a licensed securities dealer, broker or US investment adviser or investment bank. Our analysts are third party authors that include both professional investors and individual investors who may not be licensed or certified by any institute or regulatory body.