State Street: A Financial Industry Anchor Sailing Strong

Summary
- State Street continues to have healthy CET1 capital ratios.
- The current stock price trend is in a buying range.
- Their dividend is competitive among its sector peers.
- Their revenue streams are highly diversified across multiple business segments.
- Its current P/B ratio tips it into the undervalued range.
Boston Harbor DenisTangneyJr/E+ via Getty Images
Summary
My pick today from the financial sector I cover is State Street Corp (NYSE:STT), the 2nd oldest continually operating bank in the US with roots going back to 1792, headquartered in Boston and with $3.9T in assets under management as well as $43.3T under custody and administration.
When analyzing a financial sector stock, I have reduced my process to asking the following 5 questions that tell a "story" about this stock:
- Do they have a healthy capital position?
- Does the price chart indicate a buying opportunity right now?
- Is this stock's dividend yield competitive among firms in the same sector?
- Does the firm have a diversified revenue stream it can count on?
- Does the stock seem undervalued based on its P/B ratio?
As I will show below with evidence, when it comes to State Street the answer to all 5 questions is yes, so the story tells me that this stock is a Buy, an industry "anchor" that an investor could add to their portfolio, despite recent choppy waters this spring in the banking sector.
The firm continues to be in a strong capital position within its sector
When analyzing a firm like State Street, which is one of the Financial Stability Board's listed global systemically critical banks, one of my questions is how healthy are their capital ratios?
As you can see below, their most recent quarterly results from April 2023 show what I believe appear to be strong ratios:
State Street - Q1 2023 Results - Capital Ratios (State Street)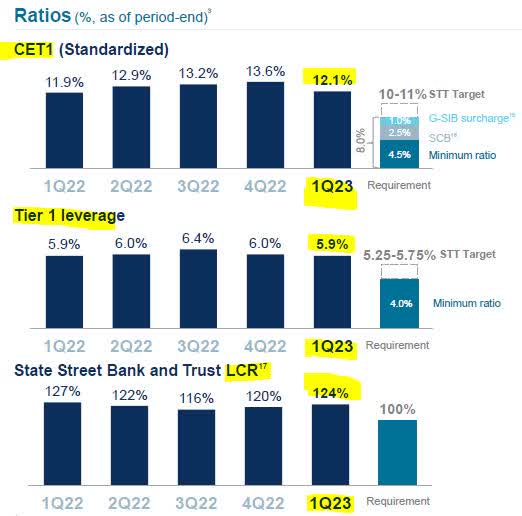
Their CET1 ratio of 12.1% stands well above their own target of 10-11%, their Tier 1 leverage of 5.9% is above their target of 5.25 - 5.75%, and their liquidity coverage ratio of 124% is above their minimum of 100%.
Why is this important to a bank, and to an investor in that bank's shares?
According to a white paper by the Bank for International Settlements, discussing how Basel III rules emerged in the wake of the 2007-2009 global banking crisis:
Common Equity Tier 1 capital (CET1) is the highest quality of regulatory capital, as it absorbs losses immediately when they occur. Additional Tier 1 capital (AT1) also provides loss absorption on a going-concern basis.
So, State Street is clearly above regulatory requirements for capital as well as above its own goals. Based on this, I don't think it has any immediate capital issues to be concerned with.
Further, as stated in their Q1 2023 earnings presentation, they "returned ~$1.5B of capital in 1Q23 consisting of $1.25B of common share repurchases and $212M in common stock dividends."
Again, this makes my forward-looking sentiment on this firm very positive as it shows they are in a position to return capital back to shareholders.
Their current price chart indicates a bearish trend and buying range
When looking at the stock's price chart as of May 23, I see that it is in the range for a buying opportunity, and below I will explain why.
State Street - Price Chart as of May 23 (StreetSmart Edge trading platform)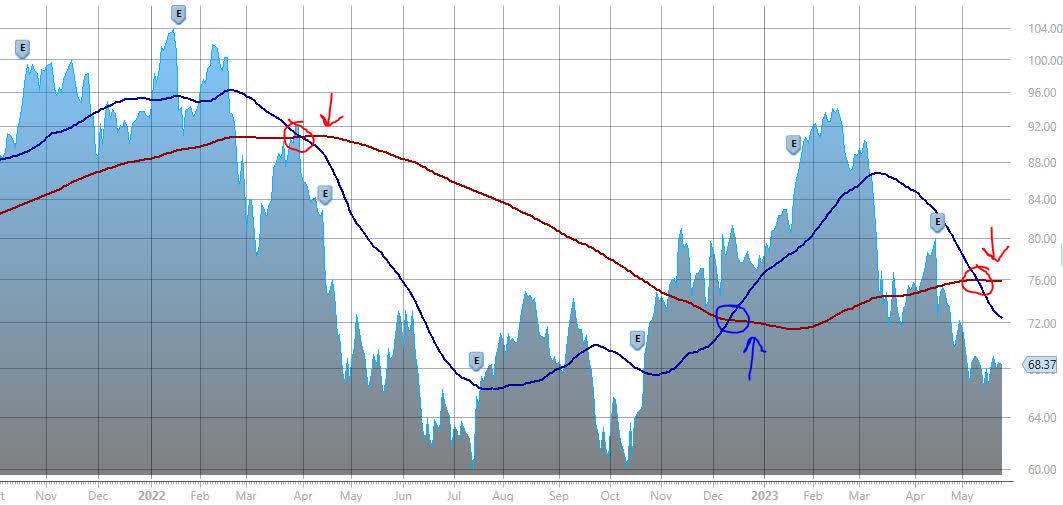
As in prior articles covering this sector, when looking at a buying opportunity I will again use a very easy concept known as the golden cross and the death cross.
In the chart above, the 50 day simple moving average (solid dark blue line) crosses the 200 day simple moving average (solid dark red line) at a few points, as a lagging indicator of either a bearish or bullish trend, the golden cross being bullish and the death cross being bearish.
If you are an investor that buys during a bearish trend for a stock and sells during the bullish trend, the bearish period after the death cross in spring 2022 showed buying potential, while the Dec 2022 golden cross showed selling potential.
Currently as of May 23, another death cross has formed, showing a bearish trend has already occurred, and hence another buying range.
This could be an investor's opportunity to buy this stock during this trend, and holding it until after the next golden cross occurs.
Although one cannot predict with certainty how long a bearish or bullish trend will last, and I think it is best to consider this stock on a longer-term basis, use of these charting tools gives you some type of framework and system to go by in terms of spotting price trends and deciding when to enter and exit.
The stock's dividend is highly competitive among the same sector
According to data from Seeking Alpha, this stock offers a dividend of $0.63 per share, with a yield of 3.68%. It also has an ex-date coming up soon on June 30 that also can be taken advantage of, as the company's board recently declared the same dividend again.
In addition, their 5 year dividend growth has been positive, with the dividend growing steadily since 2018.
State Street - 5 year dividend growth (Seeking Alpha)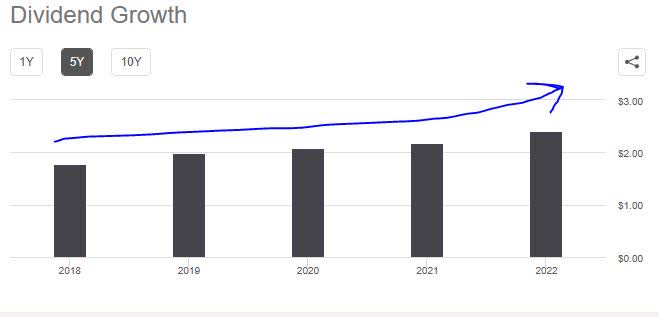
More importantly, is that if you are a dividend-income investor in the financial stocks, how does State Street's yield compare with some of its peers in the same sector?
I would say it is a competitive yield within the same sector.
For example, BlackRock's (BLK) current dividend yield is 3.02%, Charles Schwab (SCHW) has a yield of 1.89%, and Bank of New York Mellon (BK) has a yield at 3.60%. I picked these three as they also are major asset managers just like State Street.
The firm has a diversified portfolio of various revenue streams
As an investor as well as an analyst, I want to know in one sentence how a company makes its revenue.
After a quick look at their company website, the easiest way I would describe to investors what they do is that the firm is a "custodian, asset manager, lender, servicer, and provider of data insights to the financial ecosystem."
Let's take a look at how that translates into its most recent income statement for Q1:
State Street - Q1 2023 results - income statement (State Street)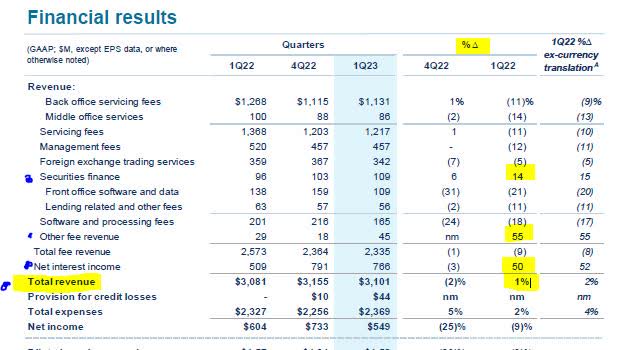
One look at the recent quarterly income statement above tells us that the firm has multiple revenue streams, which tells me it is highly diversified.
The three items that are notable to mention are YoY increases in total revenue by 1%, net interest income by 50%, and securities finance by 14%.
When it comes to net interest income, I would argue that the Fed's continued interest rate hikes since last year are benefiting that revenue stream for this sector, which in years prior has dealt with pressure of near-zero interest rates.
Back in November 2022, the St. Louis Fed also reiterated this in an article discussing rising rates:
The Federal Reserve’s continuing moves this year to raise interest rates to cool stubborn inflation could help ease some of that pressure on banks, as rates charged on loans and earned on investment securities also increase.
From a forward-looking view going into the rest of 2023, since the Fed raised rates again in early May, and the current CME Fedwatch survey of interest-rate traders predicts a 70.5% likelihood that the Fed's June 14 meeting will result in a target rate of 500-525 basis points, essentially remaining the same, my position is that State Street will continue to see benefits this year from this rate policy, when it comes to net interest income.
In terms of its other revenue streams, there is obvious room for improvement.
In terms of servicing fees, their quarterly release says the YoY decrease is "primarily driven by lower average equity and bond market levels, client activity/adjustments, and normal pricing headwinds, partially offset by net new business."
This could, therefore, likely see improvement if markets overall improve later this year.
One notable business segment I am keeping an eye on is their State Street Alpha platform.
According to their quarterly release, "1Q23 annual recurring revenue increased 16% YoY driven by ~20 SaaS client implementations."
As an analyst covering both the technology and financial sectors, I am excited when the two overlap, and data-driven innovations emerge. In the case of State Street, one of these innovations comes in the form of their Alpha platform.
Their solutions site describes it as follows:
State Street Alpha empowers portfolio managers, traders and risk teams with a shared view of holdings, exposures and orders. Using a trusted data source and integrated portfolio analytics, you can manage risk more effectively, surface investment opportunities faster and source liquidity across asset classes.
Recently in an article on CME Group (CME), I commented that the major exchanges are not just a venue for trading and transactions but also will be able to profit from the wealth of data they have, and data is a key business segment now.
In the case of State Street, it seems they too are trying to be a leader in this space. Again, another reason why this stock sets itself apart in my view, and makes it much more than just another bank.
At a P/B Ratio Below 1.0, It is Entering Undervalued Range
When it comes to this stock's valuation, let's take a quick look at its current P/B Ratio on May 25.
It's Price/Book (TTM) of 0.99 and Price/Book (FWD) of 0.94 are both below 1.0 at this time.
P/B Ratios under 1 are typically considered solid investments by value investors.
State Street - P/B Ratio - May 25 (Seeking Alpha)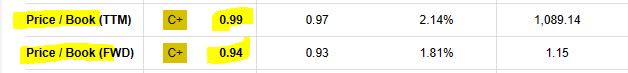
For example, when looking at the table above, although State Street's forward looking P/B is just 1.81% above the sector median of 0.93, it is 18% below its own 5 year average forward P/B of 1.15. This could be an opportunity.
My positive view of the price to book value for this stock was also recognized back in late April, in an article in Seeking Alpha by analyst The Asian Investor:
The P/B ratio this week fell below the 1-year average P/B ratio of 1.12X and while there are other banks that sell for even lower P/B ratios, I believe State Street is a solidly run bank and the size of the bank's balance sheet essentially implies that the bank won't be allowed to go out of business.
Now in late May, the P/B looks even more enticing.
Risks to my Outlook
The key risks to financial sector firms would be continual outflows of client funds towards higher-yielding options, as well as the firm holding on to a large portfolio of older bonds that have lost a lot of their market value due to rising interest rates.
My risk concern was reiterated by State Street executives after the Q1 earnings release:
State Street Chief Financial Officer Eric Aboaf told analysts he expects those deposits to drop by another $4-$5 billion in the second quarter before there is some stabilization.
However, it is notable to mention that for depositors seeking "money market funds" to snag a better yield, State Street actually is in that business too.
For example, its State Street Institutional US Government Money Market Fund shows a dividend yield of 2.90%.
Not only that, but other banks, such as Charles Schwab (SCHW) also park some of their mutual fund assets into State Street money market funds.
Based on my own research into mutual funds and one fund's prospectus from Schwab Funds, I discovered for example that the Schwab Treasury Inflation Protected Securities Fund (SWRSX) parks some of its extra cash, to the tune of over $2MM, into one of State Street's money market funds designed for institutional investors:
SWRSX fund - allocation in State Street funds (Schwab Funds)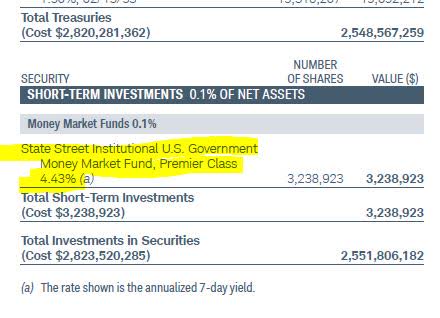
Hence, I believe State Street can continue to benefit from the large scale parking of capital by others into money market funds, and the evidence is that even other large asset managers like Schwab have also been parking money there for a while now. Obviously, there is no free parking and State Street can make money off of its "financial parking lot".
Further, the turbulent bank failures this spring occurred at very different types of firms than State Street, I think.
In fact, a May 2023 article by the Associated Press reaffirmed this sentiment:
For now, analysts expect the banking system will be spared any more large bank failures, saying the problems at Silicon Valley, Signature Bank and First Republic were unique to those companies.
Hence, when considering risk one needs to consider that State Street and those failed banks are very different firms, and should not be lumped together.
Conclusion
In conclusion, I reiterate my buy rating for this stock due to its strong capital position, its current price range, its competitive dividend yield, diversified portfolio of multiple revenue streams especially its venture into data-driven solutions, as well as its lower P/B valuation at this time.
This rating is offset by potential risk in the banking sector overall that includes deposit outflows and reduced market value of bond portfolios, however some of this risk is countered by inflows into money market funds, which can continue to benefit a firm like this.
From a forward looking perspective, this stock could be a good anchor within a portfolio of financial sector stocks, able to withstand the continuous heavy winds in the harbor, as it has done for decades.
This article was written by

Analyst’s Disclosure: I/we have no stock, option or similar derivative position in any of the companies mentioned, and no plans to initiate any such positions within the next 72 hours. I wrote this article myself, and it expresses my own opinions. I am not receiving compensation for it (other than from Seeking Alpha). I have no business relationship with any company whose stock is mentioned in this article.
Seeking Alpha's Disclosure: Past performance is no guarantee of future results. No recommendation or advice is being given as to whether any investment is suitable for a particular investor. Any views or opinions expressed above may not reflect those of Seeking Alpha as a whole. Seeking Alpha is not a licensed securities dealer, broker or US investment adviser or investment bank. Our analysts are third party authors that include both professional investors and individual investors who may not be licensed or certified by any institute or regulatory body.