Palo Alto: Sustaining The 40 Rule Amidst Slowing Current Service Billings

Summary
- After decent Q3 results, Palo Alto Networks, Inc. not only raised all metrics for the FY2023 outlook but also continued to maintain its "40-rule."
- The current service billings decelerated to 25% YoY, which is below the historical record of over 30% YoY.
- Palo Alto Networks, Inc. stock is trading at a valuation of 46x P/E for CY 2023, which can be justified as long as the current growth trajectory remains intact.
- I'm bullish on Palo Alto Networks stock as the company continues to demonstrate a better-than-expected growth outlook while closely monitoring the FY2024 guidance in the coming quarter.
da-kuk/E+ via Getty Images
Investment Thesis
Palo Alto Networks, Inc. (NASDAQ:PANW) has rallied almost 40% YTD, driven by strong growth momentum despite ongoing macro headwinds. As the largest security vendor in the industry, the company is well positioned to benefit from the secular tailwind of increased cybersecurity spending over the next decade. The company's consistent outperformance in the past quarters, both in terms of top-line and bottom-line results, demonstrates its strong execution and product differentiation.
Although there has been a slight deceleration in service billings growth in fiscal Q3 2023, the company has raised all metrics in the FY2023 outlook. Therefore, I believe PANW will continue to dominate the industry leadership, attracting large installed base of enterprise customers while maintaining its 40-rule (combined revenue growth rate and profit margin should equal or exceed 40%) for years to come. I remain bullish on the stock despite its current premium valuation, while cautiously monitoring the FY2024 outlook.
Q3 2023 Takeaway
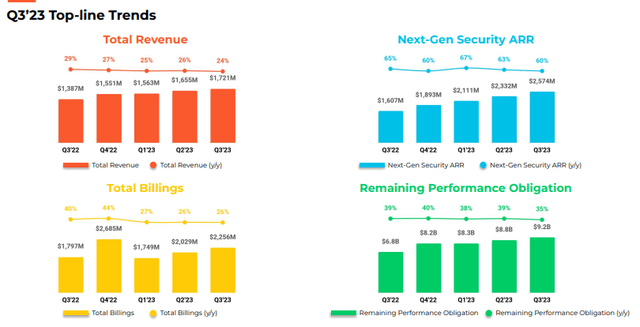
PANW has delivered decent results in Q3, demonstrating the company's ability to maintain its consistent track record based on the metrics provided by the management. Non-GAAP EPS beat expectations, while revenue was almost in-line with the street estimates. In addition, the company continues maintain a 40-rule record (45% in combined total revenue growth and adjusted net income margin was achieved in 3Q FY2023).
However, when you take a closer look, current service billings came in $1,537 million (QoQ change of current deferred revenue plus product revenue). This growth of 25% YoY indicates a slight slowdown compared to the historical record of 30% growth (see the table in Billings Analysis section).
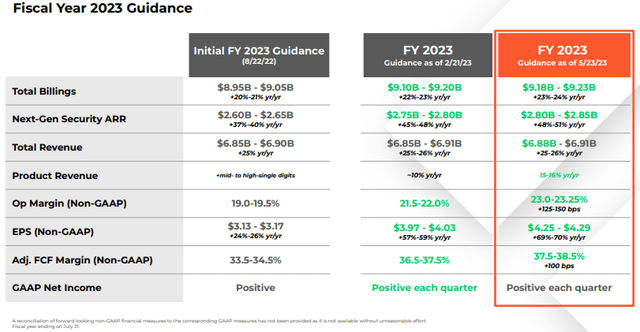
Regarding the FY2023 Outlook, the company has raised most of its metrics, including a boost of 100 bps in adjusted free cash flow ("FCF") margin outlook for FY2023, which indicates management's confidence in navigating potential macro headwinds that may arise in the near term. Notably, as shown from the table, the company has provided multiple upward revisions to their core product outlook, Next-Gen Security ARR. This signifies a strong and sustained demand for the product, which can be a continued catalyst to support its growth momentum.
A Perfect Track Record
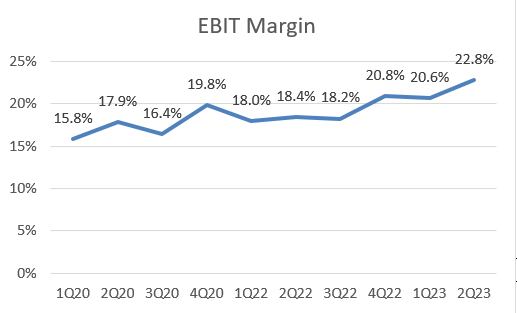
Let's take a step back and examine PANW's history record. The company has been maintaining a CAGR of 29% in total revenue from FY2015 to FY2022, with over 30% growth in subscription revenue in every past quarter. In 3Q FY2023, the total revenue grew 24% YoY, highlighting a growth resilience in the mid-20 range. Furthermore, the company has made an impressive progress in expanding its EBIT margin, which increased from 16.4% in 3Q FY2020 to 23.6% in 3Q FY2023. FCF margin has also seen significant improvement, rising from 9.6% in 3Q FY2020 to 23.3% in 3Q FY2023. Moreover, the company maintains a healthy balance sheet, with a net debt over non-GAAP EBITDA TTM ratio of 1.5x, excluding short-term investments.
Company Model DB
Billings Analysis
In the software industry, billings play a crucial role as a key growth driver. Unlike revenue, billings reflect the actual cash inflow a company receives within a given period. It's important to understand that revenue does not directly represent the amount of cash the company will receive from its customers.
In general, total billings are calculated by adding revenue to the positive change in deferred revenue (liability side of balance sheet). Deferred revenue represents cash received in advance from customers, which will be recognized as revenue once the company provides the corresponding services. Therefore, it's a liability to a company. On the other hand, current billings focus specifically on the change in deferred revenue in the short term, typically less than a year. If we are mainly analyzing PANW's core subscription segment, such as cloud service billings, product revenue would be subtracted from the current billings balance.
Given that more than 75% of PANW's total revenue is contributed by the services segment, it's more insightful to analyze the underlying growth trend through current service billings growth. By focusing on this specific metric, we can assess the momentum of cash flow collections from customers' service payments and get a better understanding of PANW's growth trajectory.
As shown from the table, PANW has consistently maintained around 30% growth in the current service billings, indicating a robust and consistent momentum in collecting cash from customers for their service subscriptions. Notably, the YoY growth in the last two quarters (2Q23 and 1Q23) accelerated from the previous periods of FY 2022 (2Q22 and 1Q22), indicating an increasing demand for PANW's subscription services, such as cloud security, security operations, and cloud-delivered security services.
However, as I mentioned earlier, there is an early indication of deceleration as the growth rate slowed down to 25% YoY in 3Q FY2023. Additionally, since the company hasn't provided the FY2024 outlook yet, we need to closely monitor its growth trajectory, particularly in relation to its high valuation.
Premium Valuation
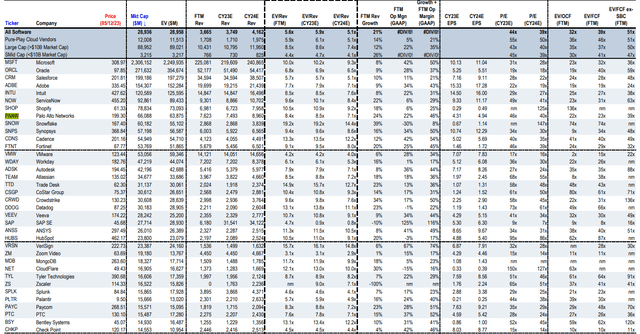
Despite PANW's strong growth momentum, the stock is currently not trading at a lofty valuation multiple compared to its industry average. With a P/E CY 2023 of 46x, it's slightly higher than the large cap software average of 43x. However, the 8.5x EV/Revenue CY2023 is actually below the large-cap average of 8.6x. This suggests that the stock is not overvalued when considering this relative valuation metrics. Additionally, when we compare PANW's P/E TTM to its 5-year average, it's currently near the historical average. This indicates that the stock is not becoming expensive compared to its own valuation over the past 5 years. While a 40x P/E may seem expensive in a high inflation environment, the company's strong fundamentals can justify the premium multiple as long as its growth momentum remains intact.
Conclusion
In sum, Palo Alto Networks, Inc. has delivered decent results in 3Q FY2023, showing the ability to maintain a consistent growth momentum and margin expansion. While there has been a slight deceleration in a core growth driver, current service billings, compared to the historical trend, the management still remains confident in its FY2023 outlook.
Particularly, the upward revisions in the guidance for PANW's total billings and Next-Gen Security ARR, highlighting the strong and sustained demand for the products, which is expected to continue supporting the price momentum in the near term. However, since Palo Alto Networks, Inc. hasn't provided FY2024 outlook, it's important for investors to closely monitor any revisions and adjust PANW's valuation accordingly.
This article was written by
Analyst’s Disclosure: I/we have a beneficial long position in the shares of PANW either through stock ownership, options, or other derivatives. I wrote this article myself, and it expresses my own opinions. I am not receiving compensation for it (other than from Seeking Alpha). I have no business relationship with any company whose stock is mentioned in this article.
Seeking Alpha's Disclosure: Past performance is no guarantee of future results. No recommendation or advice is being given as to whether any investment is suitable for a particular investor. Any views or opinions expressed above may not reflect those of Seeking Alpha as a whole. Seeking Alpha is not a licensed securities dealer, broker or US investment adviser or investment bank. Our analysts are third party authors that include both professional investors and individual investors who may not be licensed or certified by any institute or regulatory body.


