MACOM Technology Solutions Holdings Is Most Likely Going Sideways

Summary
- The stock has suffered big losses in recent weeks, but there are several reasons why sideways action is in store for MTSI.
- Guidance from MTSI was much worse than expected due to weak demand, but MTSI also sees improvement on the horizon.
- There are a number of developments to be gained by looking at the charts for MTSI, which could help decide how to position oneself.
- MTSI may have a better future down the line, but for now, the stock is likely to remain stuck in neutral for a while.
spainter_vfx/iStock via Getty Images
MACOM Technology Solutions Holdings (NASDAQ:MTSI) got quite the scare when the stock collapsed shortly after the release of the Q2 report. While MTSI surpassed estimates for the top and the bottom line, guidance came in well below expectations, driven by a major decline in new customer orders and outright cancellations. However, the stock quickly recovered and has been on the move since. Why will be covered next.
The stock collapses after a solid start
The chart below shows how the second quarter of 2023 has been a disaster for MTSI. MTSI got off to a solid start in 2023 with the stock up 12.5% by the end of Q1, only for the stock to collapse in Q2 with the stock losing as much as 31.5% by May 4. The stock has since bounced, but the stock is still down 6% YTD.
Source: finviz.com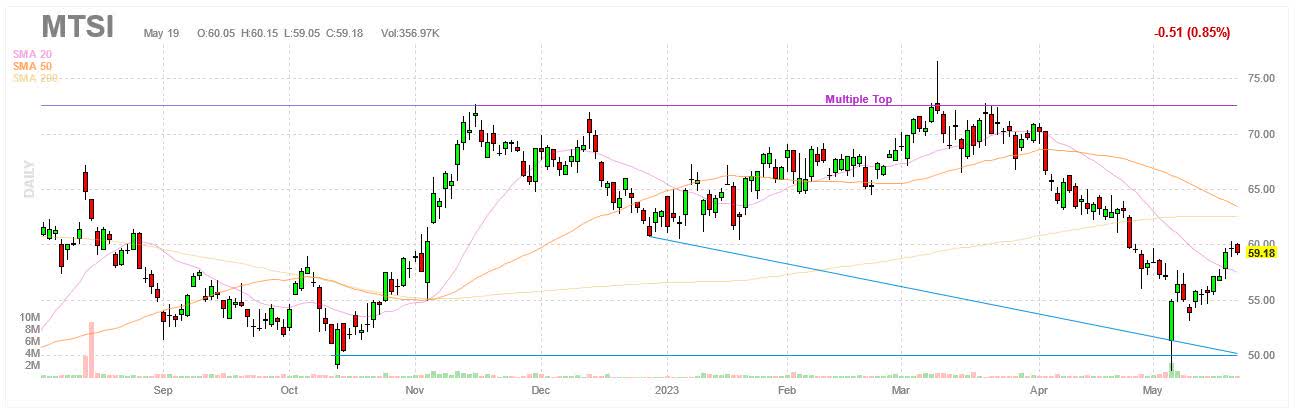
There are a couple of important things worth noting in the chart. Note how the stock spent much of March trying to get through the $70-75 region. There were repeated attempts, but the stock was unable to break what appears to be resistance. Recall how the stock also stalled when it got to the $70-75 region in November and December 2022.
For the stock to reverse course on numerous occasions in the same price region is no coincidence, but evidence of the presence of resistance in the $70-75 region. Similarly, it’s no coincidence the stock bounced on May 4 when it hit an intraday low of $48.53 because this is something that has happened before in the $47.50-52.50 region.
For instance, the rally from mid-October to mid-November that saw the stock appreciate by as much as 49% started after the stock fell to $48.76 on October 13, which happens to be in the same aforementioned $47.50-52.50 region and in fact quite close to the May 4 low of $48.53. Note also how the rally stalled when the stock hit a high of $72.64 on November 15, which happens to be in the $70-75 region mentioned previously.
Going back even further in time reveals numerous instances of the stock bouncing once it got to the $47.50-52.50 region. For example, the rally from May 2021 to November 2021 started when the stock hit a low of $48.68 on May 14, 2021, which is just $0.08 less than the October 2022 low of $48.76 and $0.15 more than the May 2023 low of $48.53. So there is substantial evidence pointing to support in the $47.50-52.50 region, just as there is substantial evidence pointing to resistance in the $70-75 region.
The stock is essentially stuck between support and resistance. The stock is able to move higher, but only to a certain degree as the way up is blocked by the latter. Similarly, the stock is able to move lower, but only to a certain degree as the way down is blocked by the former. All this suggests continued sideways action in the near term, despite some ups and downs.
Those interested in a trade may consider going long MTSI when the stock gets close to support in the $47.50-52.50 region, only to get out if it gets close to resistance in the $70-75 region and vice versa. MTSI is currently in no man’s land after the stock closed at $59.18 on May 19, which is roughly halfway between the $47.50-52.50 region and the $70-75 region, or halfway between support and resistance.
The prospect of a trough offsets bearish guidance
As mentioned earlier, the stock hit the 2023 low of $48.53 on May 4, which is when MTSI released its Q2 FY2023 report. MTSI disappointed with guidance that was far below expectations, triggering a selloff in the stock that saw the stock drop by as much as 15% at the low. On the other hand, the stock recovered most of its losses before the end of the day to close down just 3.8%.
There is a reason for this comeback. Support came into play, but there’s more to it. While guidance was a disappointment, there was enough elsewhere to suggest a recovery might not be so far into the future. The Q2 results actually beat estimates with revenue increasing by 2.6% YoY to $169.4M, $1.4M more than expected. Industrial and defense contributed $77.2M, telecom another $53.9M and datacenter accounted for the remaining $38.3M. Non-GAAP EPS increased by 16.2% YoY to $0.79, $0.01 more than expected. The table below shows the numbers for Q2 FY2023.
(Unit: $1000, except for EPS) | |||||
(GAAP) | Q2 FY2023 | Q1 FY2023 | Q2 FY2022 | QoQ | YoY |
Revenue | 169,406 | 180,104 | 165,147 | (5.94%) | 2.58% |
Gross margin | 60.6% | 61.3% | 59.9% | (70bps) | 70bps |
Income from operations | 35,904 | 38,583 | 32,571 | (6.94%) | 10.23% |
Net income | 25,755 | 29,519 | 29,558 | (12.75%) | (12.87%) |
EPS | 0.36 | 0.41 | 0.42 | (12.19%) | (14.29%) |
(Non-GAAP) | |||||
Revenue | 169,406 | 180,104 | 165,147 | (5.94%) | 2.58% |
Gross margin | 62.1% | 62.6% | 61.7% | (50bps) | 40bps |
Income from operations | 56,554 | 58,843 | 50,893 | (3.89%) | 11.12% |
Net income | 56,722 | 58,007 | 48,364 | (2.22%) | 17.28% |
EPS | 0.79 | 0.81 | 0.68 | (2.47%) | 16.18% |
Source: MTSI Form 8-K
Nevertheless, the Q2 results represent a sequential decline compared to Q1. Furthermore, this decline is forecast to continue with guidance calling for Q3 FY2023 revenue of $145-150M, a decline of 12.9% QoQ and 14.4% YoY at the midpoint. In comparison, consensus estimates were expecting $166M. The forecast expects non-GAAP EPS of $0.52-0.56, decline of 31.7% QoQ and 26.0% YoY at the midpoint.
(Non-GAAP) | Q3 FY2023 (guidance) | Q3 FY2022 | YoY (midpoint) |
Revenue | $145-150M | $172.3M | (14.39%) |
Gross margin | 59.0-60.0% | 62.2% | (270bps) |
EPS | $0.52-0.56 | $0.73 | (26.03%) |
Q3 guidance was much worse than expected, which is why management added some color on the issue. Book-to-bill was below one at just 0.5 in Q2, which is less than half the 1.1 for all of FY2022 and well below MTSI’s own expectations. A number of orders were canceled outright, a sign of a weak demand environment. From the Q2 earnings call:
“Given the extraordinarily weak Q2 bookings, I thought it would be helpful to discuss the current order trends and address a series of important questions. First, were we surprised with the weak Q2 bookings. As discussed on last -- on our last earnings call, we had anticipated that bookings would be weak in Q2. However, our actual bookings were approximately $40 million below our internal forecast. So while we expected some softness, we did not expect the magnitude of weakness in the number of cancellations that occurred during the quarter. What caused the weak bookings, we believe a combination of excess customer and channel inventory as well as pockets of short-term end demand weakness."
A transcript of the Q2 FY2023 earnings call can be found here.
However, MTSI did somewhat offset the weak Q3 guidance with the prospect of improvement starting in Q4.
“Finally, as we model our second half financials, we expect our full year FY ‘23 revenues and earnings to be down approximately 4% to 5% and gross margins to be over 60%.”
The outlook for FY2023 calls for a decline of 4-5% YoY in revenue, which implies Q4 revenue of around $147.5-150.0M since FY2022 revenue was $675.2M and Q3 guidance calls for revenue of $494.5-499.5M in Q1-Q3. While this is a small sequential improvement, it’s better than the big sequential declines in the preceding quarters.
“So when we add all of that up and then we look at our sales forecast, we do think things will slowly improve. We don’t think it’s going to be a rapid return to, let’s say, strong bookings because we do have to work through the inventory situation that we’re currently looking at. So I think I -- the comments that I made in my prepared remarks about the trends improving is probably as far as I want to go. We don’t know what Q4 bookings will be. We’ll have to wait and see.
There is certainly a lot of uncertainty around the markets. But I think what’s very important for today is investors understand that we’re sitting on a very strong backlog. And when we apply a conservative book-to-bill on top of that, we think year-over-year, we should be able to achieve between 4% and 5% decline in revenue, which is not ideal, but I think it’s a reasonable outcome given the market environment.”
Consensus estimates have been revised according to the latest outlook from MTSI. Estimates predict non-GAAP EPS of $2.63-2.70 on revenue of $644-647M by the end of FY2023, which represent YoY declines of 4.3-6.7% and 4.3-4.6% respectively. At the same time, while FY2023 is expected to be a down year compared to FY2022, most do not expect things to get much worse in FY2024.
Estimates predict non-GAAP EPS of $2.48-2.81 on revenue of $640-673M in FY2024, which is rather similar to FY2023. For revenue and earnings to stay flat argues in favor of a stock that is going sideways.
MTS is neither expensive nor cheap
Valuations are also in favor of sideways action in the stock. The table below shows some of the multiples MTSI trades at. In general, MTSI trades at higher multiples than most in the sector, although multiples are also not in lofty territory. For instance, MTSI trades at 22.1 times forward non-GAAP earnings with a trailing P/E of 19.1. In comparison, the median in the sector is 20.9x and 18.2x respectively.
Note the trailing GAAP P/E ratio of 12.9. While this seems low and is in fact much lower than the median of 23, it’s worth mentioning that this low number is due to GAAP net income of $239.3M or $3.36 per share in Q4 FY2022, which was in turn mostly the result of a $200M tax benefit. Thanks to this, GAAP EPS in the last 12 months was $4.58, which helped push down the P/E ratio for MTSI.
MTSI | |
Market cap | $4.19B |
Enterprise value | $4.23B |
Revenue ("ttm") | $675.2M |
EBITDA | $189.9M |
Trailing non-GAAP P/E | 19.09 |
Forward non-GAAP P/E | 22.10 |
Trailing GAAP P/E | 12.93 |
Forward GAAP P/E | 47.26 |
PEG GAAP | 0.21 |
P/S | 5.94 |
P/B | 4.69 |
EV/sales | 6.04 |
Trailing EV/EBITDA | 21.02 |
Forward EV/EBITDA | 20.18 |
Source: Seeking Alpha
Investor takeaways
I am neutral on MTSI stock as stated in a previous article. While there may be volatility along the way with ups and down, the general direction of the stock is likely sideways, at least in the near term. Whether it is valuations, flat growth or chart patterns, there are several reasons why the stock will find it difficult to make much headway in the near term.
Guidance was well below expectations amid a weak demand environment, but the outlook sees the decline coming to a halt as soon as Q4. The top and the bottom line are expected to remain relatively stable once the trough in Q3 is in the rear view. FY2023 and FY2024 are expected to be in the same ballpark. MTSI is also sitting on $300M worth of backlog, which gives it some cushion to work with.
The numbers staying stable should help prevent a bigger selloff in the stock, although it might also put a cap on any potential rallies. While the stock has dropped significantly in recent weeks, the charts suggest to expect MTSI to trade within a range. On the one hand, support has held its ground. On the other hand, resistance is still out there and the stock remains stuck between support and resistance. Sideways action within a range bounded by support in the $47.50-52.50 region and resistance in the $70-75 region looks like the most likely outcome under these circumstances.
Bottom line, except for traders who know how to navigate the lows and the highs in the stock, most are probably unlikely to be swayed by the prospect of a stock going sideways. If return on investment is important in the near term, then MTSI is likely not it. MTSI may make for a better case down the line, but not at the moment.
This article was written by

Analyst’s Disclosure: I/we have no stock, option or similar derivative position in any of the companies mentioned, and no plans to initiate any such positions within the next 72 hours. I wrote this article myself, and it expresses my own opinions. I am not receiving compensation for it (other than from Seeking Alpha). I have no business relationship with any company whose stock is mentioned in this article.
Seeking Alpha's Disclosure: Past performance is no guarantee of future results. No recommendation or advice is being given as to whether any investment is suitable for a particular investor. Any views or opinions expressed above may not reflect those of Seeking Alpha as a whole. Seeking Alpha is not a licensed securities dealer, broker or US investment adviser or investment bank. Our analysts are third party authors that include both professional investors and individual investors who may not be licensed or certified by any institute or regulatory body.