ARKK Vs. QQQ: Which ETF Is The Best Pick For Long-Term Investors?

Summary
- In the past few years, ARK Innovation ETF has retreated from 152% growth in 2020 to a drop of 76% from its 2020 high.
- In the past 3 years, QQQ grew 50% while ARKK, with significant volatility, dropped 31%.
- ARKK’s losses have led a decline in its assets under management from a peak of $27.9 billion in February 2021 to $6.7 billion today.
- This idea was discussed in more depth with members of my private investing community, Semiconductor Deep Dive. Learn More »
Pink_frog
On December 9, 2021, I wrote a Seeking Alpha article entitled “ARKK Vs. QQQ: Which ETF Is The Better Pick For Long-Term Investors?”
In that article, my bullet statements were:
- In the past year, ARK Innovation ETF (NYSEARCA:ARKK) has retreated from 152% growth in 2020 to -14% in 2021.
- Invesco QQQ ETF (NASDAQ:QQQ) is up 29% in the past year.
- In the past 10 years, QQQ grew 304% while ARKK, with significant volatility, grew 406%.
- Stocks in the ARKK ETF can be considered Covid stocks, benefiting from the lockdowns, which may not be relevant post-lockdowns.
In the short-term coming off the pandemic, data showed QQQ significantly outperformed ARKK. But in the long-term period, ARKK outgrew QQQ by a ratio of 406% vs. 304%.
This article will discuss ARKK and QQQ for the short term and long term. It will also discuss the strategy of ARKK, raising the question of whether investors should look at Anti-ARK ETFs, which are exchange-traded funds shorting Cathie Wood’s stock picks.
ARKK vs. QQQ Strategy
One way to simplify investment is through an exchange-traded fund (ETF). Exchange-traded funds ("ETFs") combine aspects of mutual funds and conventional stocks.
A comprehensive analysis of these two ETFs is shown in Table 1. One of the key differentiators is Assets Under Management ("AUM"), which represents the total of all investor dollars invested in all share classes of the fund. Investors generally consider higher investment inflows and higher AUM comparisons as a positive indicator of quality and management experience. That would make the QQQ ETF a strong choice with an AUM of $171.86 billion (down from $210.55 billion at the end of 2021) compared to just $6.71 billion (down from $17.46 billion at the end of 2021) for ARKK.
ARKK, QQQ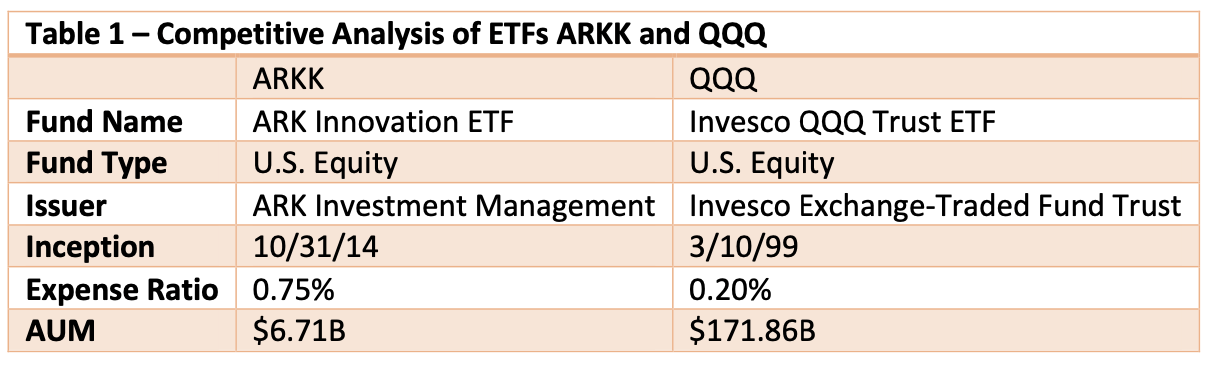
ARKK’s losses have led a decline in its assets under management ("AUM") from a peak of $27.9 billion in February 2021 to $6.7 billion today. The drop in assets was purely driven by valuation decreases in its portfolio of investments:
In a comparison of stock performance, Chart 1 shows the 1-year stock prices for the ARKK and QQQ ETFs. QQQ is +16.57% while ARKK is -8.75%.
YCharts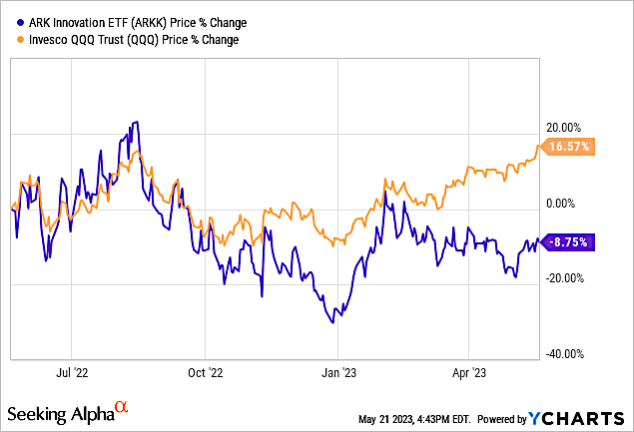
Chart 1
Importantly, Chart 2 shows the 5-year stock prices for the ARKK and QQQ ETFs. QQQ is +95.78% while ARKK is -6.36%.
YCharts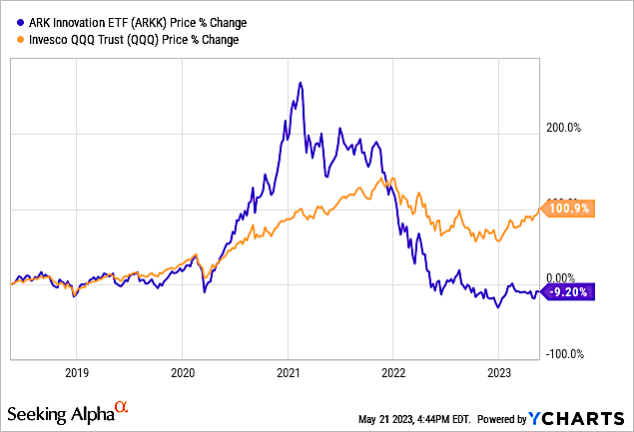
Chart 2
Chart 3 shows long-term 10-year stock prices for the ARKK and QQQ ETFs. QQQ is +227.10% while ARKK is +83.37%. As I noted in above at the end of 2021, QQQ grew 304% over the 10-year period at the time, while ARKK, with significant volatility, grew 406%.
In other words, ARKK lost its 4:3 share price ratio at the end of 2021 to a 1:3 ratio today over a 10 year period.
YCharts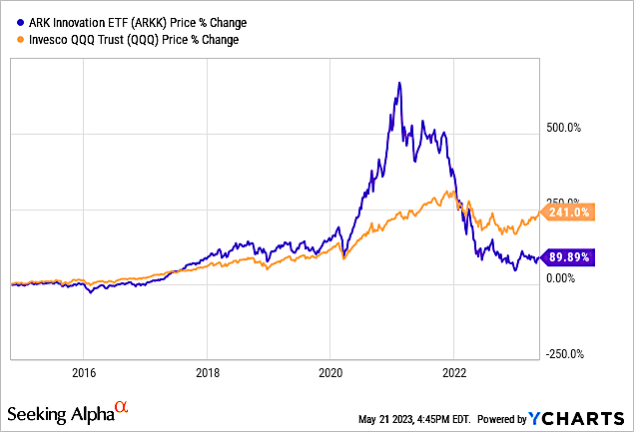
Chart 3
Analysis of Individual Stocks in ETFs
Analyzing ARKK Top Holdings
Table 2 Shows the Top 10 Holdings of ARKK, which make up 63.4% of total holdings.
In Column E, I show stock performance for the 1-year period ending 5/19/2023, Exact Sciences (EXAS), DraftKings (DKNG), and Shopify (SHOP) the leading performance stocks. It is also notable that the Top 5 holdings underperformed the Next 5 companies.
The average growth for the 10 companies is -19.27%.
In Column F, I show the Ownership Rank of ARKK stocks on 12/3/21, when I wrote the above referenced article. Those not given an ownership rank were either not in the ARKK Top 10 or not owned.
In Column G, I show % of Assets on 12/3/21.
In Column H, I show the 1-year stock performance on the date of that article, i.e., 12/3/21. At that time, only Tesla (TSLA) had a positive 1-year stock performance. Versus 4 of 10 on 5/19/23. Average growth for the 5 companies compared was -19.95% for the 1-year period ending 12/3/21.
The Information Network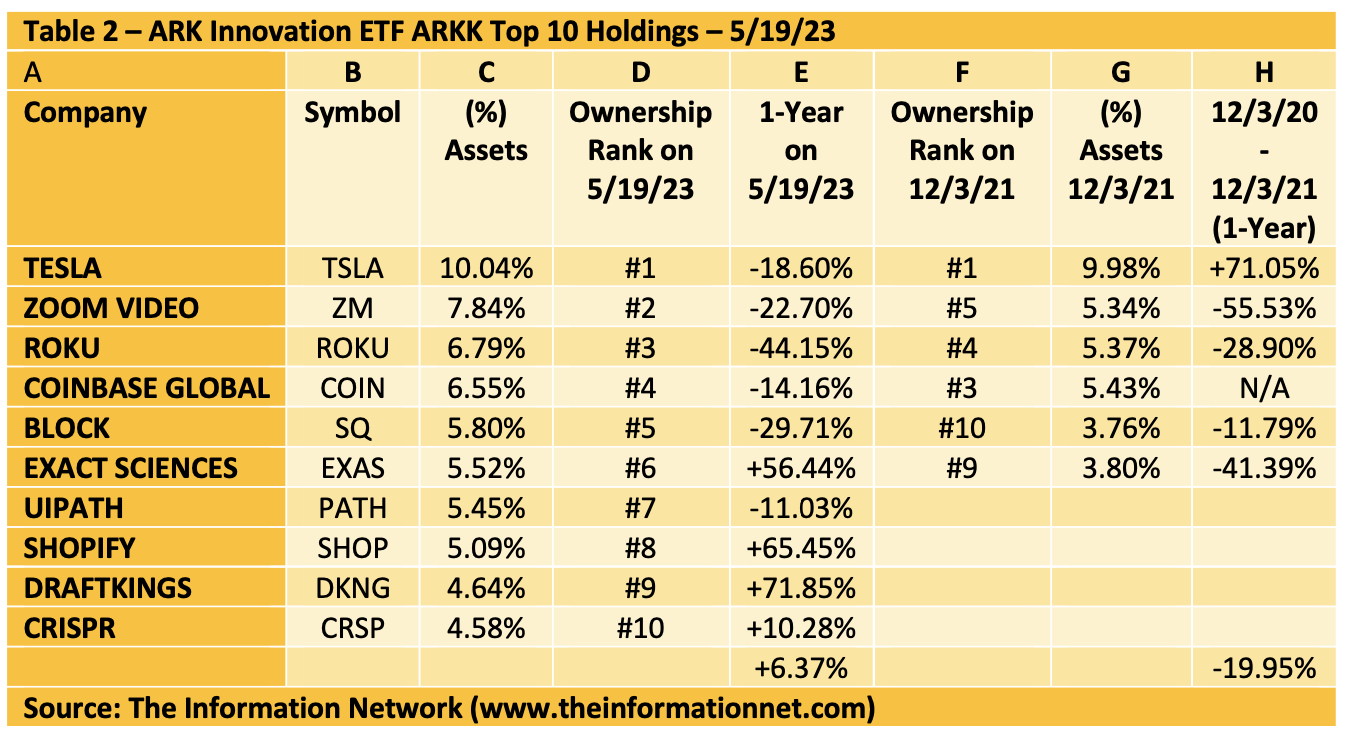
Table 2 provides a perspective of Cathie Wood’s management approach. While there is fluidity in her acquisitions, in Column G I show % of Assets on 12/3/21.
- For Tesla (TSLA), on 12/3/21 share price was up 71.05% but Wood increased assets 0.06% while share price plummeted 90%.
- For Roku (ROKU), while the stock price was -28.90% on 12/3/21, Wood increased the share of assets from 5.37% to 6.79%, and the stock price decreased to -44.15% for the 1-year period.
- For Block (SQ), while the stock price was -11.79%, Wood increased the share of assets from 3.76% to 5.80%, and the stock price decreased to -29.71%
On May 5, 2023, I published this article for my Marketplace Semiconductor Deep Dive subscribers. In Table 3, I compare share price performance for the Top 10 ARKK holdings for this current Seeking Alpha article at market close on 5/19/23 and the previous market close on 5/5/23 for my Marketplace article for subscribers. Note that on 5/5/23, CRSP was not among the Top 10 holdings.
Average share price increased 25.6% (column F) in the past 14 days, as the average share price increased from -19.27% (column E) to +6.37% (column D).
The Information Network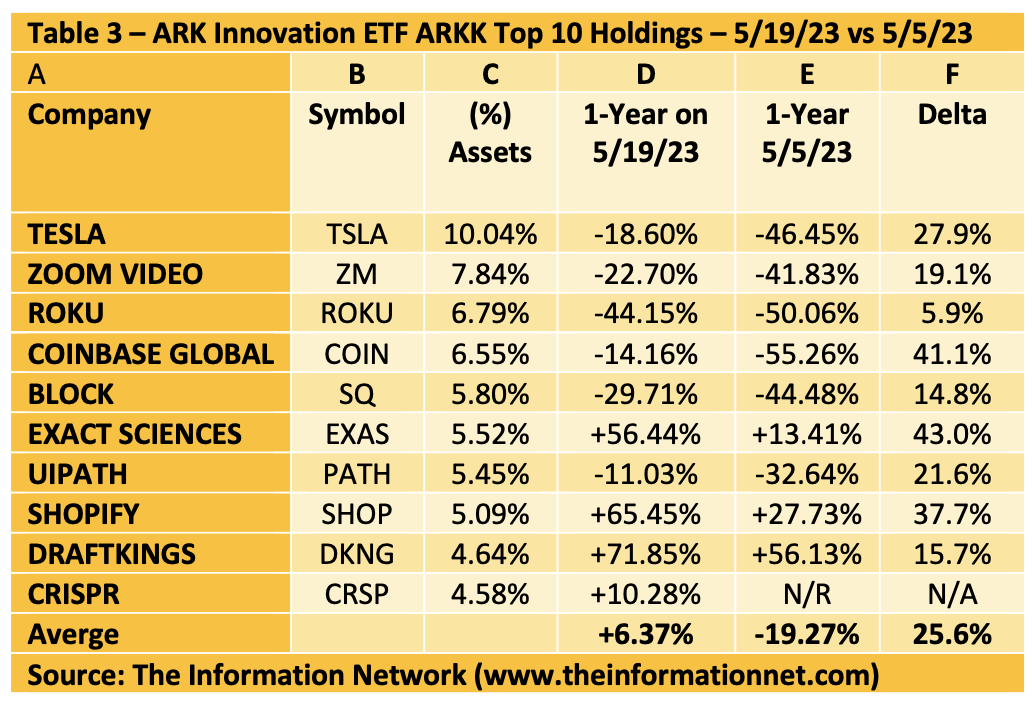
Chart 4 shows the 1-year performance of the Top 5 ARKK holdings listed above in Table 2.
YCharts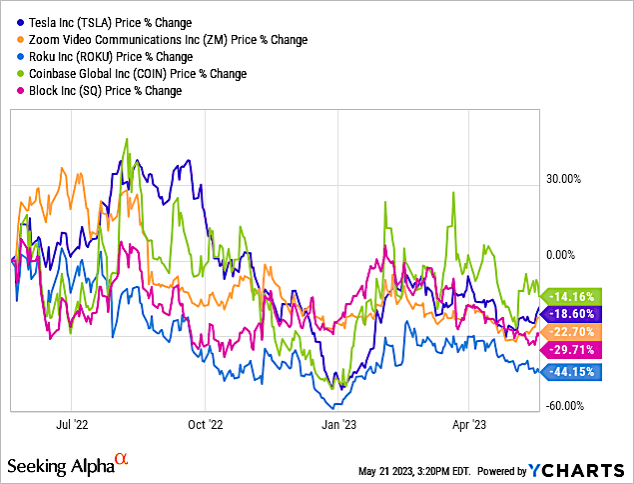
Chart 4
Chart 5 shows the 1-year performance of the next 5 ARKK holdings listed in above in Table 2.
YCharts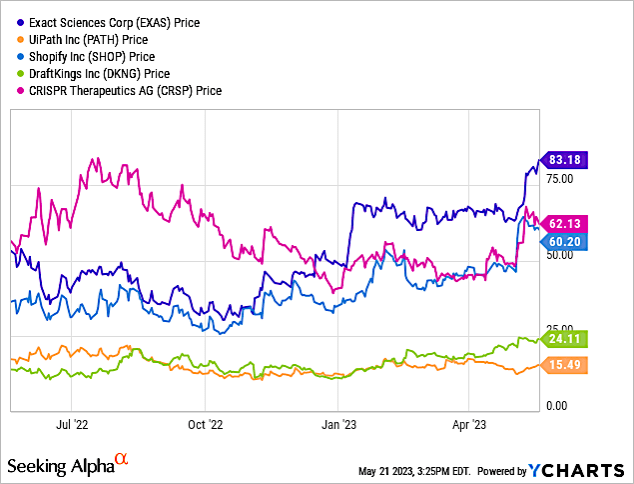
Chart 5
Analyzing QQQ Top Holdings
Table 4 shows the top 10 holdings for QQQ as of September 30, 2021, which make up 55.1% of total holdings.
In Column E, I show stock performance for the 1-year period ending 5/19/2023, with the Nvidia (NVDA) performing the best at +87.28%, while TESLA the worst at -18.60%.
Average growth for the 10 companies is -+21.35%.
In Column F, I show the Ownership Rank of QQQ stocks on 12/3/21, when I wrote the above article. Those not given an ownership rank were either not in the QQQ Top 10 or not owned.
In Column G, I show % of Assets on 12/3/21.
In Column H, I show the 1-year stock performance on the date of that article, i.e., 12/3/21. At that time, Nvidia had a 1-year stock performance 138.32%. Average growth for the 8 companies was +40.1% for the 1-year period ending 12/3/21.
The Information Network
As I said above for ARKK, on May 5, 2023, I published this article for my Marketplace Semiconductor Deep Dive subscribers. In Table 5, I compare share price performance for the Top 10 QQQ holdings for this current Seeking Alpha article at market close on 5/19/23 and the previous market close on 5/5/23 for my Marketplace article for subscribers.
While every stock showed double-digit+ 1-year growth on 12/3/21(as shown in Table 4), just 6 of 10 companies showed positive growth as of 5/5/23. But on 5/19/23, 9 of 10 companies showed positive growth.
Average share price increased 22.4% (column F) in the past 14 days, as the average share price increased from -1.08% (column E) to +21.25% (column D).
The Information Network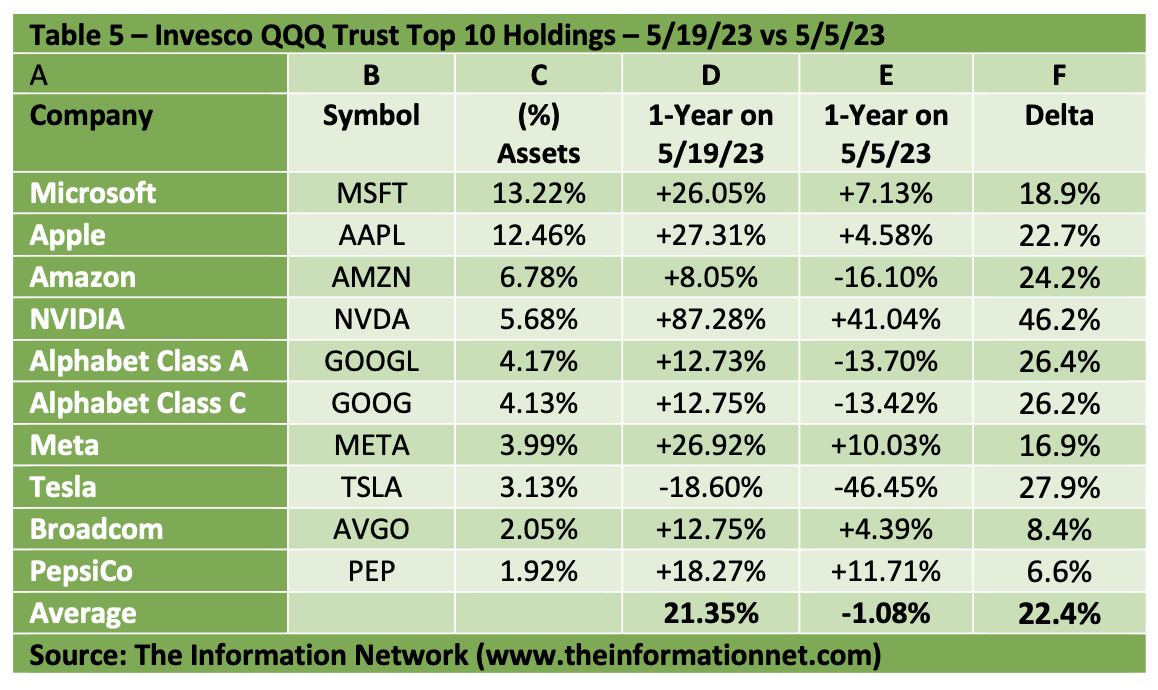
Chart 6 shows the 1-year performance of the Top 5 QQQ holdings listed above in Table 3.
YCharts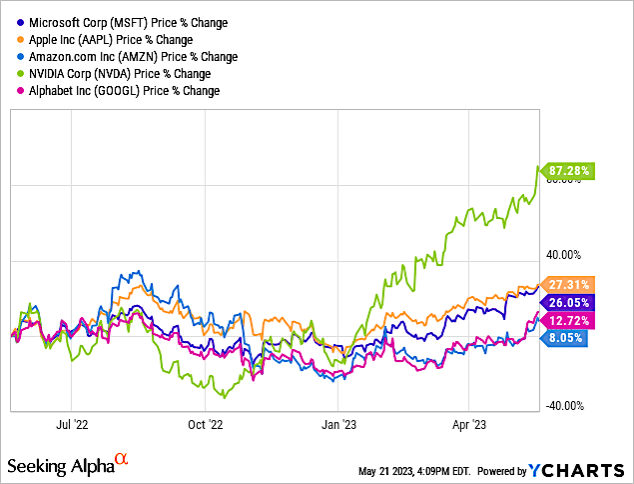
Chart 6
Chart 7 shows the 1-year performance of the next 5 QQQ holdings listed in Table 3.
YCharts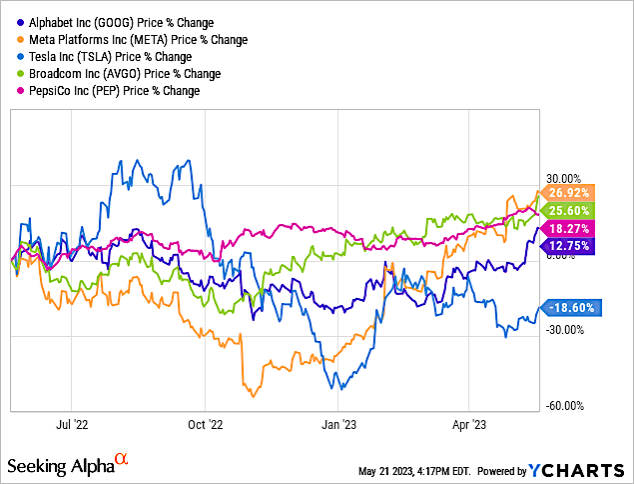
Chart 7
Anti-ARKK ETFs Strategies
Tuttle Capital submitted a prospectus with the U.S. Securities and Exchange Commission for two leveraged funds. These consist of the Tuttle Capital 2X All Innovation ETF (UARK) and the Tuttle Capital 2X Inverse All Innovation ETF (ZARK).
UARK and ZARK intend to trade as +2X and -2X leveraged funds that track the price action of Cathie Wood's actively managed exchange traded funds. UARK and ZARK intend to trade with a 0.75% expense ratio.
Per the filing, UARK and ZARK will focus 50% of its assets towards the daily performance of ARKK Innovation ETF.
After Tuttle launched the $303 million Tuttle Capital Short Innovation ETF (SARK) in November 2021, the fund — which tracks the inverse performance of Wood’s ARKK — was then rebranded to the AXS Short Innovation Daily ETF after AXS Investments LLC acquired Tuttle’s entire ETF lineup as part of its expansion last April.
There are some signs of life in AXS’s SARK. The ETF has absorbed $100 million of new cash this year — more than ARKK itself — despite a 24% plunge in 2023. But the same can’t be said for the company’s $48 million AXS 2X Innovation ETF (TARK), which tracks double the performance of Wood’s fund. TARK has bled about $24 million this year amid a 43% rally.
Chart 8 compares 1-year price % change for ARKK, SARK, and TARK. ARKK’s performance is +5.85% versus -3.16% for SARK and -30.37% for TARK.
Yahoo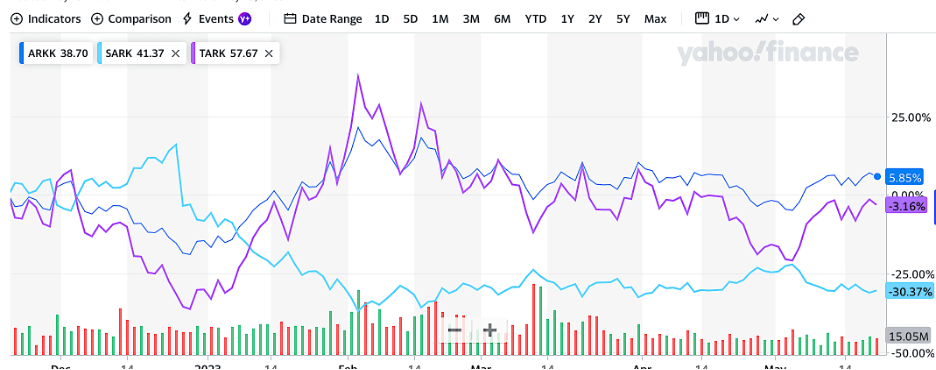
Chart 8
Investor Takeaway
The premise of this article is to compare ARKK with QQQ over the long term. Clearly QQQ is a winner over ARKK at 10 years (Chart 3), and is also at 5 years (Chart 2), and the short term 1-year (Chart 1).
Another focus of this article is whether anti-ARKK ETFs are an alternative, banking on the poor performance of ARKK. An analysis shows that no benefit of this strategy. It is too early to know whether new ETFs UARK and ZARK will be better alternatives.
I noted above describing Table 3 that the average share price for the Top 10 ARKK holdings increased 25.6% (column F) in the past 14 days, as the average share price increased from -19.27% (column E) to +6.37% (column D).
Charts 9 and 10 show that ARKK's strong performance in these past 14 days was due to recent earnings call and guidance of two of its holdings since May 1, 2023. Chart 9 shows the jump in share price for Coinbase Global (COIN), while Chart 10 shows the jump in Spotify (SPOT).
YCharts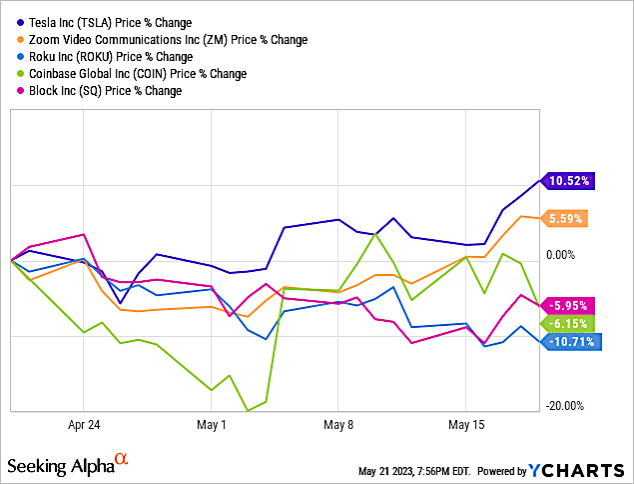
Chart 9
YCharts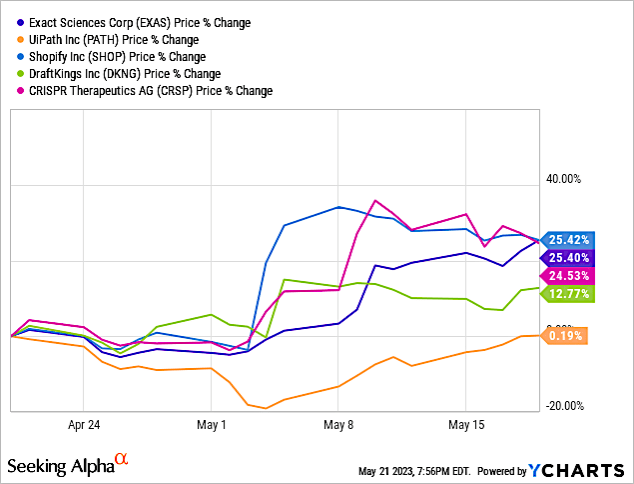
Chart 10
According to Investor Business Daily, which raised the question “Why such a disconnect between ARK Invest and QQQ when growth is in again?
Just six stocks, all of which are also in the Nasdaq 100, are driving 80% of the S&P 500's gains this year. That includes Apple (AAPL), Microsoft (MSFT), Meta Platforms (META), Nvidia (NVDA), Amazon.com (AMZN) and Alphabet (GOOGL). All are racing higher this year.
These six stocks also collectively account for 50% of the value of the Nasdaq 100, as shown in Table 6.
IBD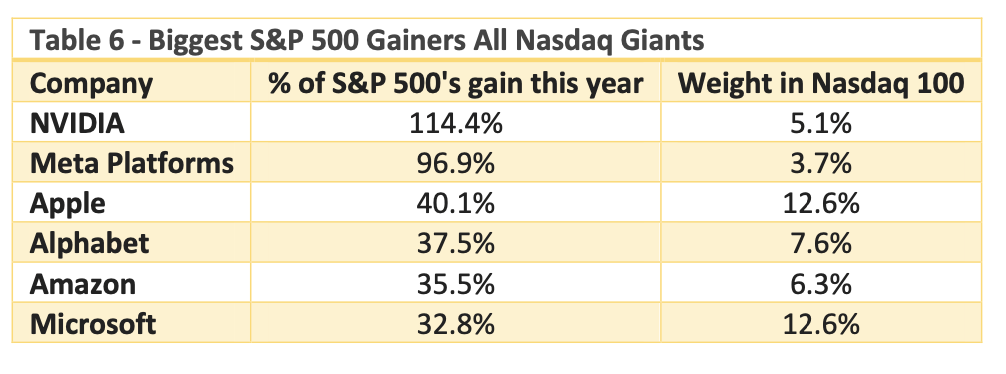
None of the top performers this year are in ARK Innovation. All six are holdings in QQQ.
The ARKK holdings may be disruptive, but they achieved their distinction during the global shutdown when work/study/stay at home decrees dictated a change in the lifestyle of workers and students. That gave rise to a demand for products such as PCs, video conferencing, and even exercise equipment with gyms shut down.
The subtitle of this article was originally “Cathie Woods Needs Another Covid Lockdown for ARKK to Succeed." The factors that contributed to ARKK’s success in 2020 are no longer in play.
Long term, I recommend investors avoid ARKK and instead look at individual stocks in the holdings, which I've addressed in the tables above. QQQ is a better performing ETF near term and long term, comprised primarily of Tech stocks, instead of disruptive stocks that have no empirical basis of definition, as definitions are subjective and inconsistent.
ARK defines "disruptive innovation" as the introduction of a technologically enabled product or service that potentially changes the way the world works. But it doesn't mean that these disruptive companies are and will be market leaders in the near or mid-term.
But Apple's (AAPL) iPhone was a market disruptor when first introduced in 2007, yet its market share never reached more than 25%.
This free article presents my analysis of this semiconductor sector. A more detailed analysis is available on my Marketplace newsletter site Semiconductor Deep Dive. You can learn more about it here.
This article was written by

Dr. Robert N. Castellano, is president of The Information Network www.theinformationnet.com. Most of the data, as well as tables and charts I use in my articles, come from my market research reports. If you need additional information about any article, please go to my website.
I will soon be initiating an investor newsletter. Information to register will be online on my website.
I received a Ph.D. degree in chemistry from Oxford University (England) under Dr. John Goodenough, inventor of the lithium ion battery and 2019 Nobel Prize winner in Chemistry. I've had ten years experience in the field of wafer fabrication at AT&T Bell Laboratories and Stanford University.
I have been Editor-in-Chief of the peer-reviewed Journal of Active and Passive Electronic Devices since 2000. I authored the book "Technology Trends in VLSI Manufacturing" (Gordon and Breach), "Solar Panel Processing" (Old City Publishing), "Alternative Energy Technology" (Old City Publishing). Also in the solar area, I am CEO of SolarPA, which uses a proprietary nanomaterial to coat solar cells, increasing the efficiency by up to 10%. I recently published a fictional novel Blessed, available on Amazon and other sites.
Analyst’s Disclosure: I/we have no stock, option or similar derivative position in any of the companies mentioned, and no plans to initiate any such positions within the next 72 hours. I wrote this article myself, and it expresses my own opinions. I am not receiving compensation for it (other than from Seeking Alpha). I have no business relationship with any company whose stock is mentioned in this article.
Seeking Alpha's Disclosure: Past performance is no guarantee of future results. No recommendation or advice is being given as to whether any investment is suitable for a particular investor. Any views or opinions expressed above may not reflect those of Seeking Alpha as a whole. Seeking Alpha is not a licensed securities dealer, broker or US investment adviser or investment bank. Our analysts are third party authors that include both professional investors and individual investors who may not be licensed or certified by any institute or regulatory body.