UTG Vs. ERH: Two 8% Yielding Monthly Pay CEFs

Summary
- Reaves Utility Income Trust yields 8.27% and Allspring Utilities and High Income Fund yields 8.49%, and both closed-end funds pay monthly.
- Both funds hold Utilities as their main sector exposure.
- We compare holdings, performance, expenses, and valuations for UTG and ERH.
- We're currently running a sale for our private investing group, Hidden Dividend Stocks Plus, where members get access to portfolios, market alerts, real-time chat, and more. Learn More »
pidjoe
The defensive Utilities sector was the 2nd best performer in 2022, behind the surging Energy sector. However, it has been out of favor so far in 2023, second to last in performance.
Notice anything aggravating about the top 3 performing sectors? Not great news for an income investor looking to build an income portfolio.
Hidden Dividend Stocks Plus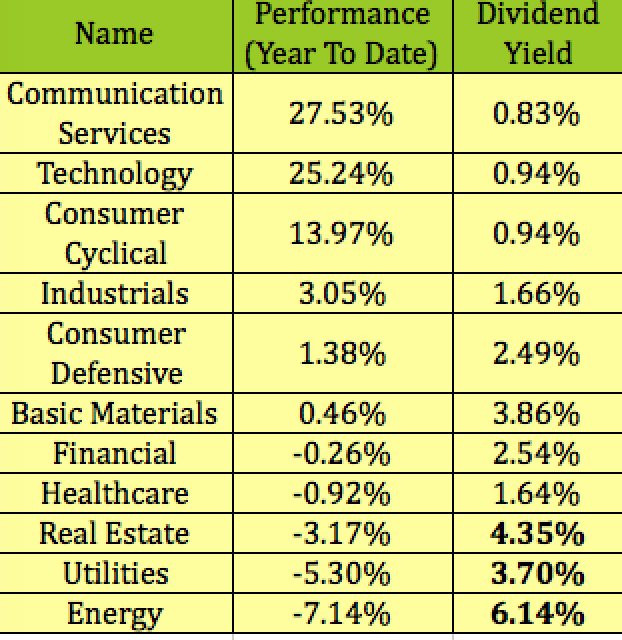
Fund Profiles:
The Reaves Utility Income Trust (NYSE:UTG), is a closed-end fund, or CEF.
UTF's objective is to provide a high level of after-tax total return consisting primarily of tax-advantaged dividend income and capital appreciation. It intends to invest at least 80% of its total assets in dividend-paying common and preferred stocks and debt instruments of companies within the utility industry.
The remaining 20% of its assets may be invested in other securities, including stocks, money market instruments, and debt instruments, as well as certain derivative instruments in the utility industry or other industries. (UTG site.)
The Allspring Utilities and High Income Fund (NYSE:ERH) also is a CEF. This fund seeks a high level of current income and moderate capital growth, with an emphasis on providing tax-advantaged dividend income.
ERH allocates its assets between 2 separate investment strategies. Under normal market conditions, the fund allocates ~70% of its total assets to common, preferred and convertible preferred stocks of utility companies, and ~30% of its total assets to U.S. dollar-denominated below investment grade (high yield) debt. (ERH site.)
Both funds began in 2004, but UTG is a much larger entity, with $2.4B in Net Assets, vs. $134M for ERH. UTG's average volume of 206K is over 10X that of ERH, while its expense ratio is a bit higher, at 1.42%.
UTG's portfolio is more concentrated, with 44 holdings, vs. 270 for ERH, and UTG uses slightly less leverage, at ~20%, vs. 22.44% for ERH:
Hidden Dividend Stocks Plus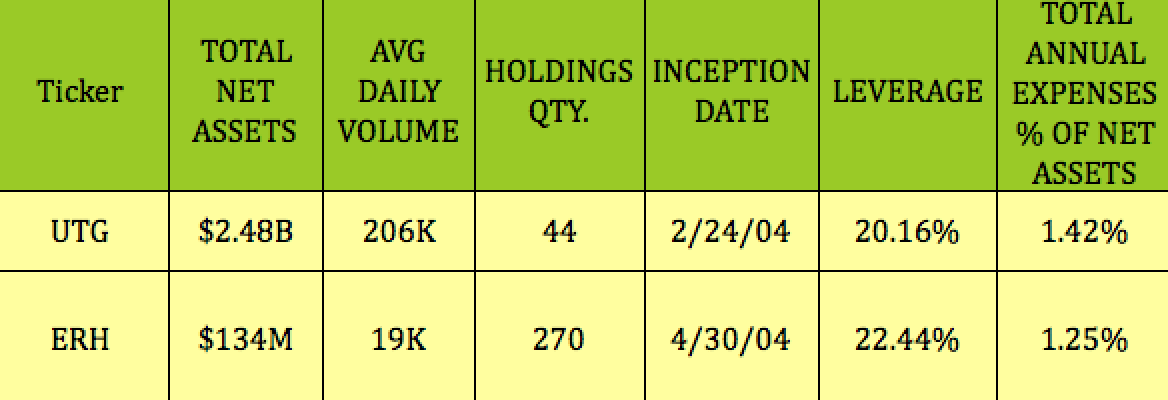
Dividends:
The 2 funds have similar dividend yields, at 8.27% for UTG and 8.49% for ERH, and both pay monthly. UTG should go ex-dividend next on ~6/15/23, with a ~6/30/23 pay date, while ERH should go ex-dividend next on ~6/9/23, with a ~6/23/23 pay date.
Hidden Dividend Stocks Plus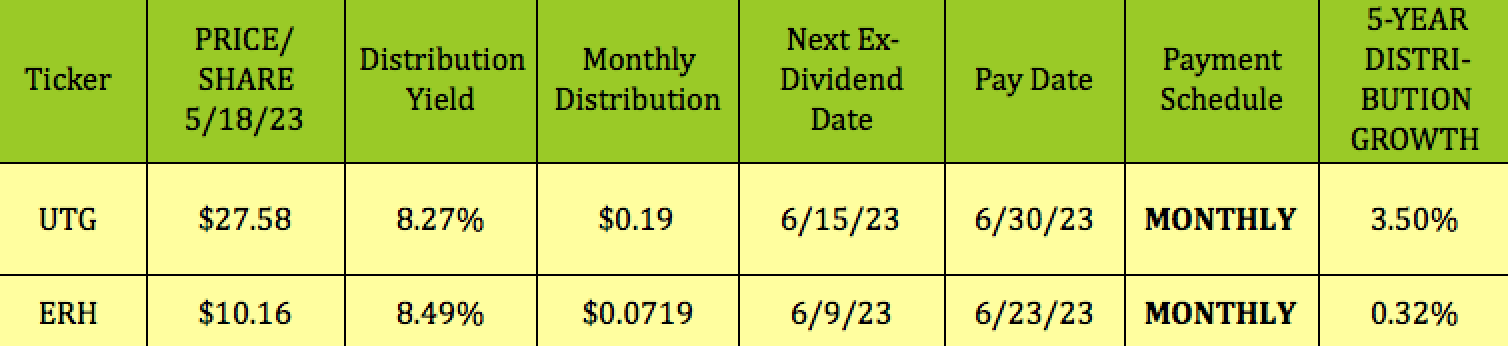
UTG has a much better 5-year dividend growth record of 3.50%, vs. just 0.32% for ERH.
ERH's monthly distributions have declined from $0.0762 to $0.0719 since August '22:
cfcnct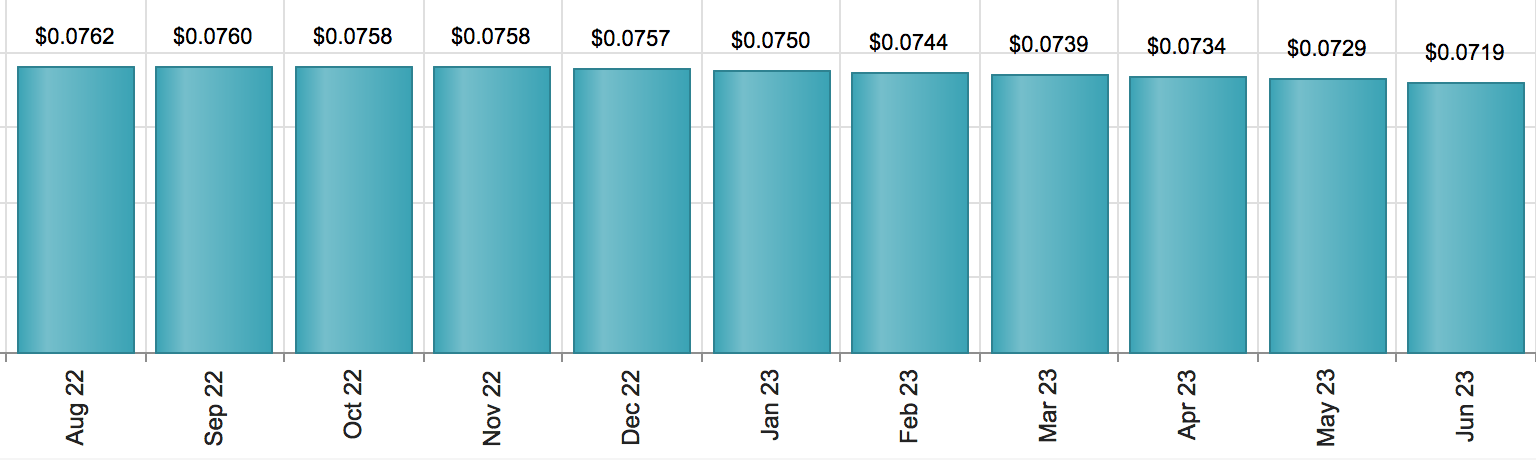
UTG raised its monthly payout from $.18 to $.19 in July 2021, where it remains. UTG's distributions have come increasingly from long-term capital gains since 2016, with 2022 hitting a low for qualified dividends.
UTG site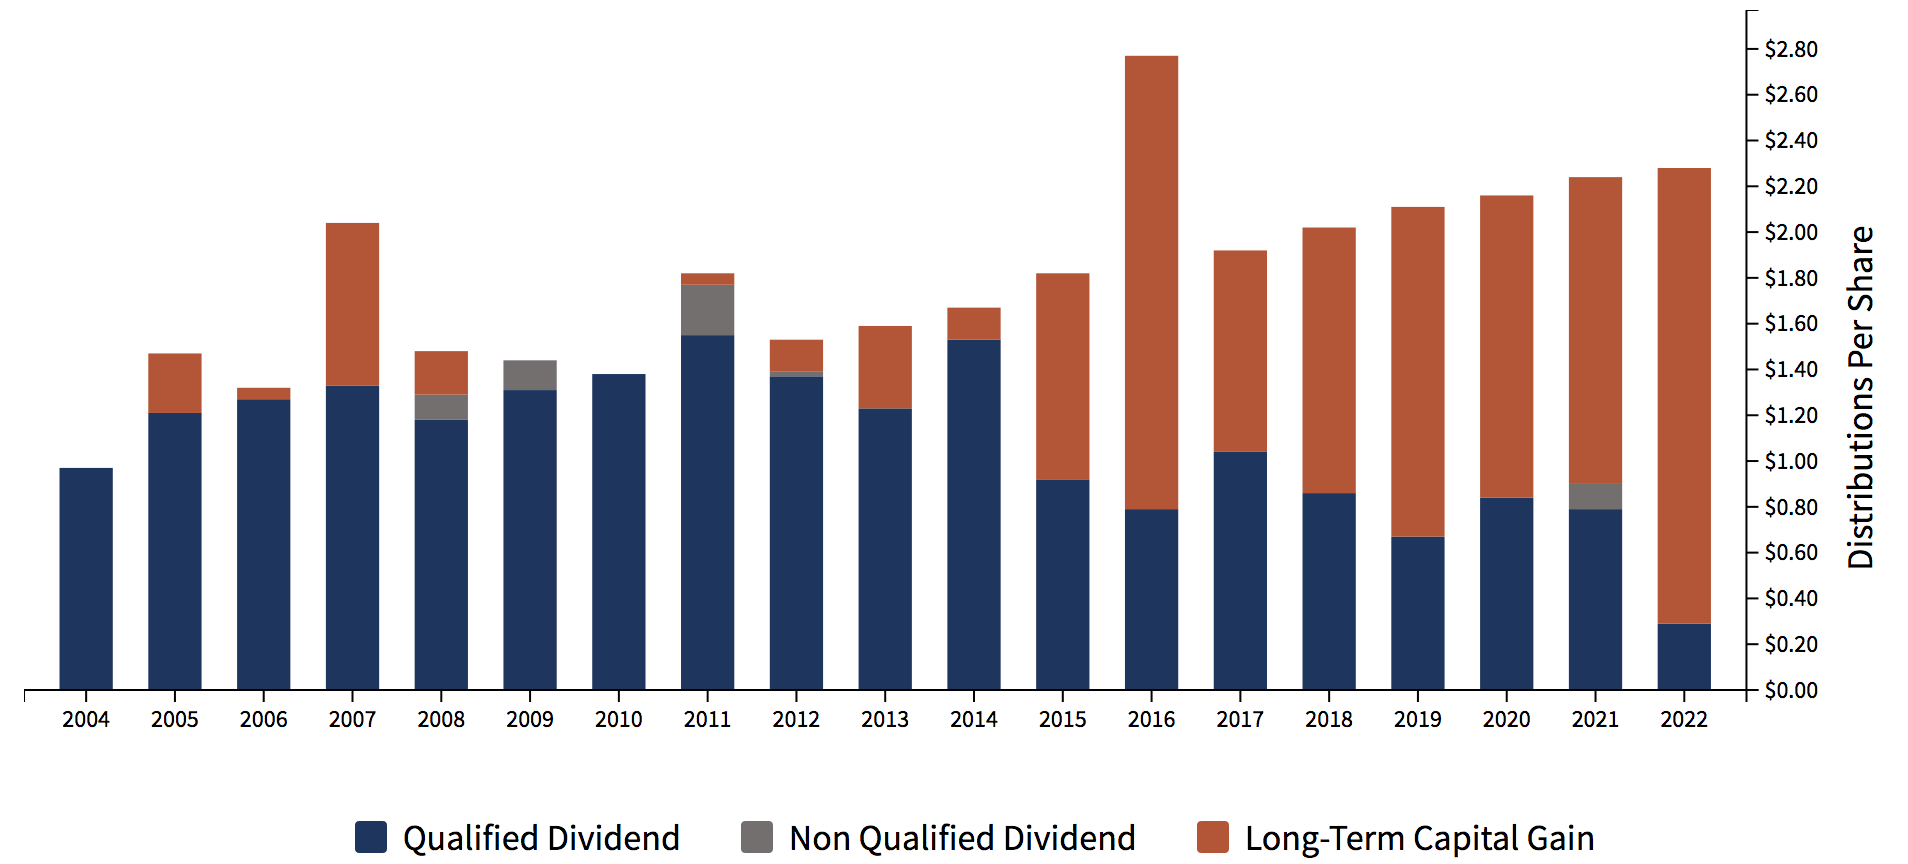
Taxes:
UTG's fiscal year ending 10/31/22 distribution sources were a bit different for tax purposes, characterized as ~71% capital gains, and ~29% Net Investment Income, with 0% Return of Capital.
ERH's most recent fiscal year ended on 8/31/22. As of 4/30/23, its distributions were estimated to be comprised of 38% Net Investment Income, NII, and 62% Paid In Capital. Return of Capital gives you a tax deferral advantage, but it also decreases your tax basis, so that if and when you sell, your capital gains tax will be higher. Consult your accountant for more details.
ERH site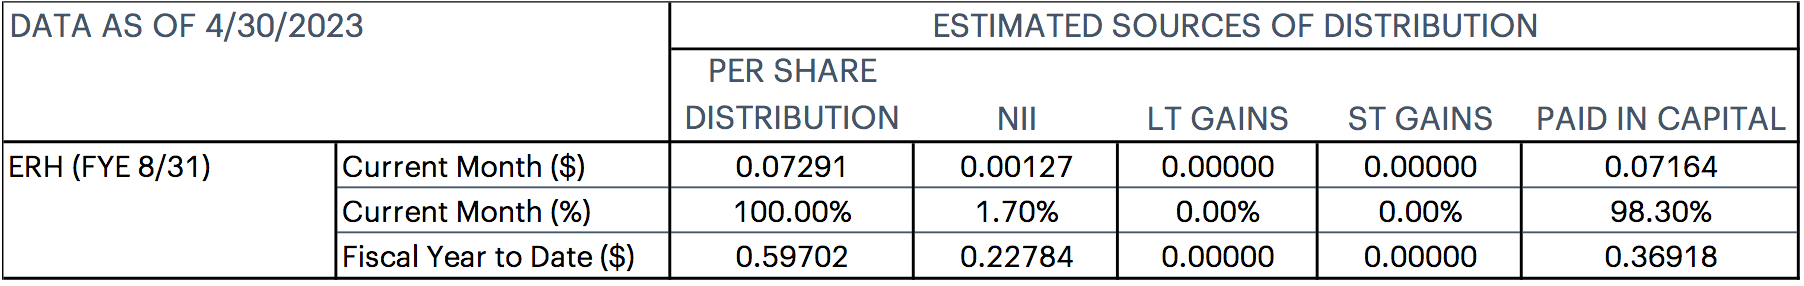
Holdings:
UTG's top 10 comprises ~44% of its portfolio, and is made up of 4%-plus holdings in several big cap Utilities stocks, such as Duke Energy (DUK), Ameren (AEE), and DTE Energy (DTE).
It also includes some foreign big cap telecoms - Deutsche Telekom (OTCQX:DTEGY) and BCE Inc. (BCE).
UTG site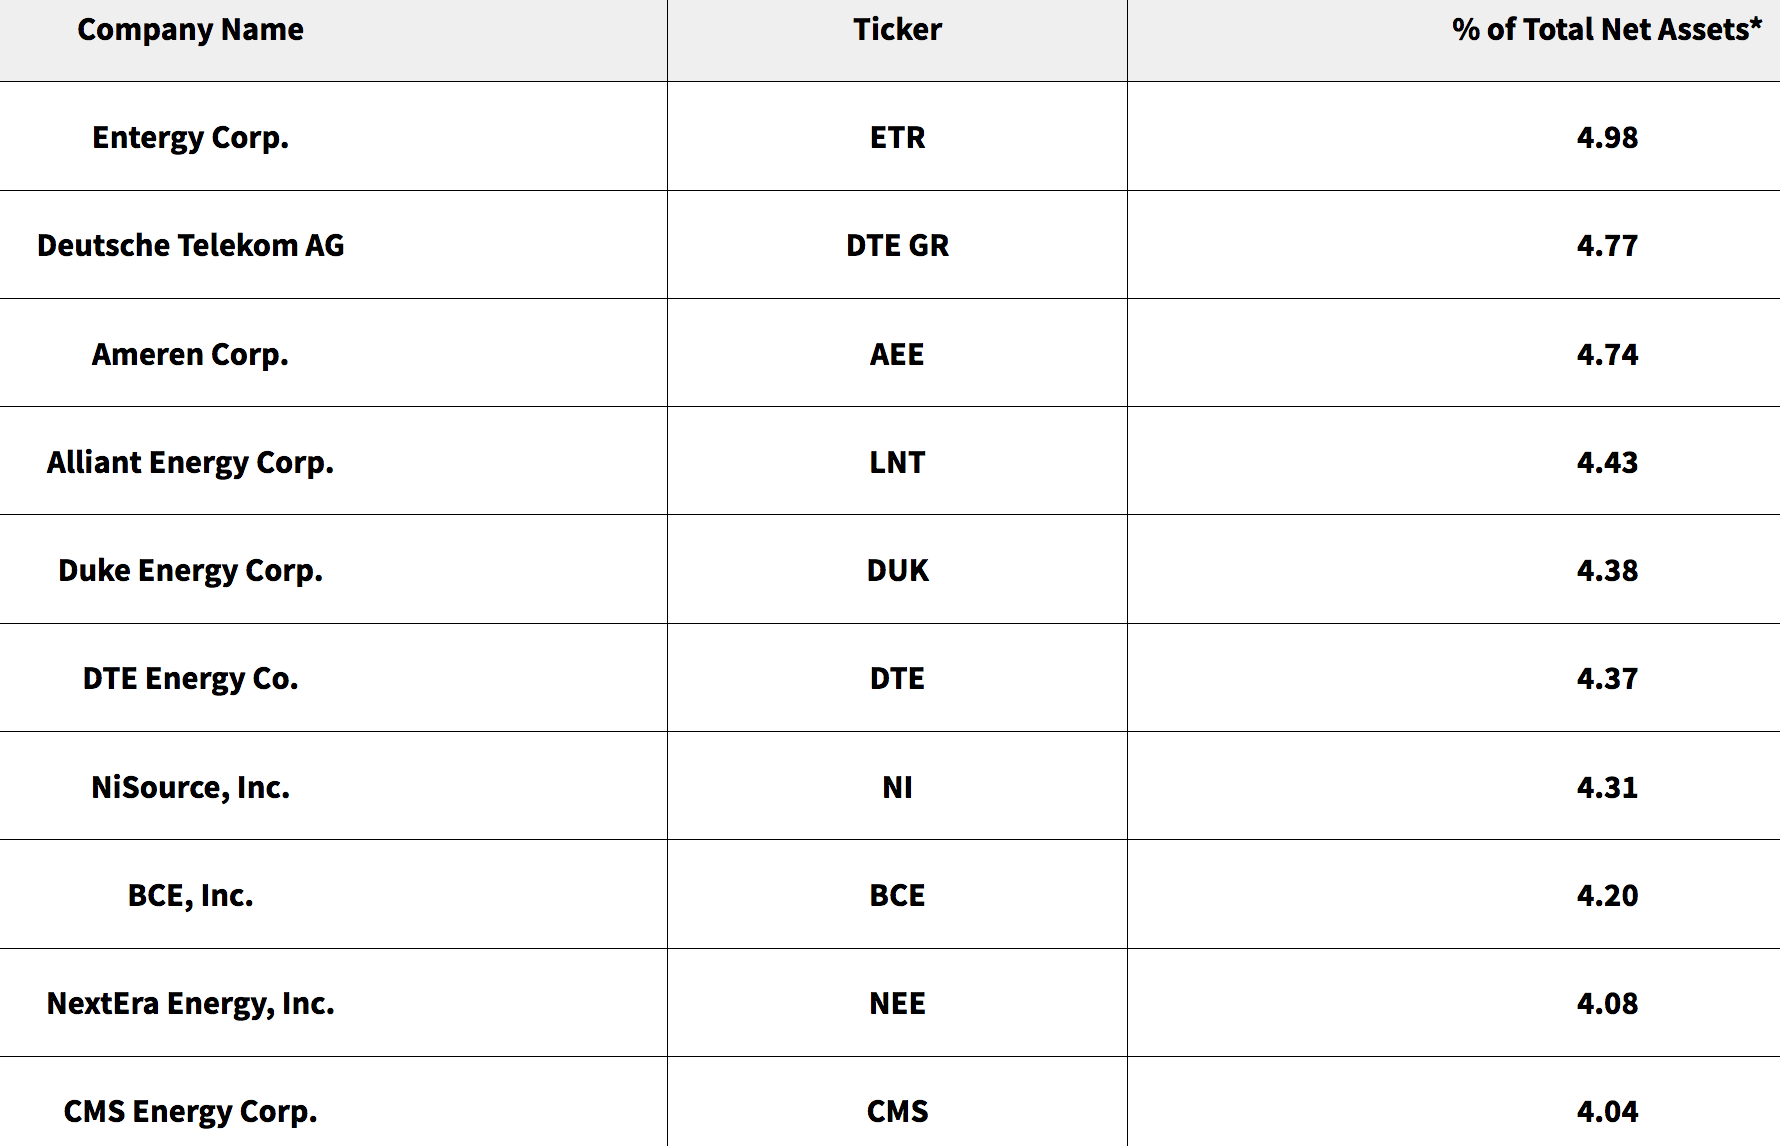
ERH's top 10 comprises ~42% of its holdings. It's all Utilities, and doesn't include any telecoms. It has an out-sized 11.27% holding in NextEra Energy (NEE).
ERH site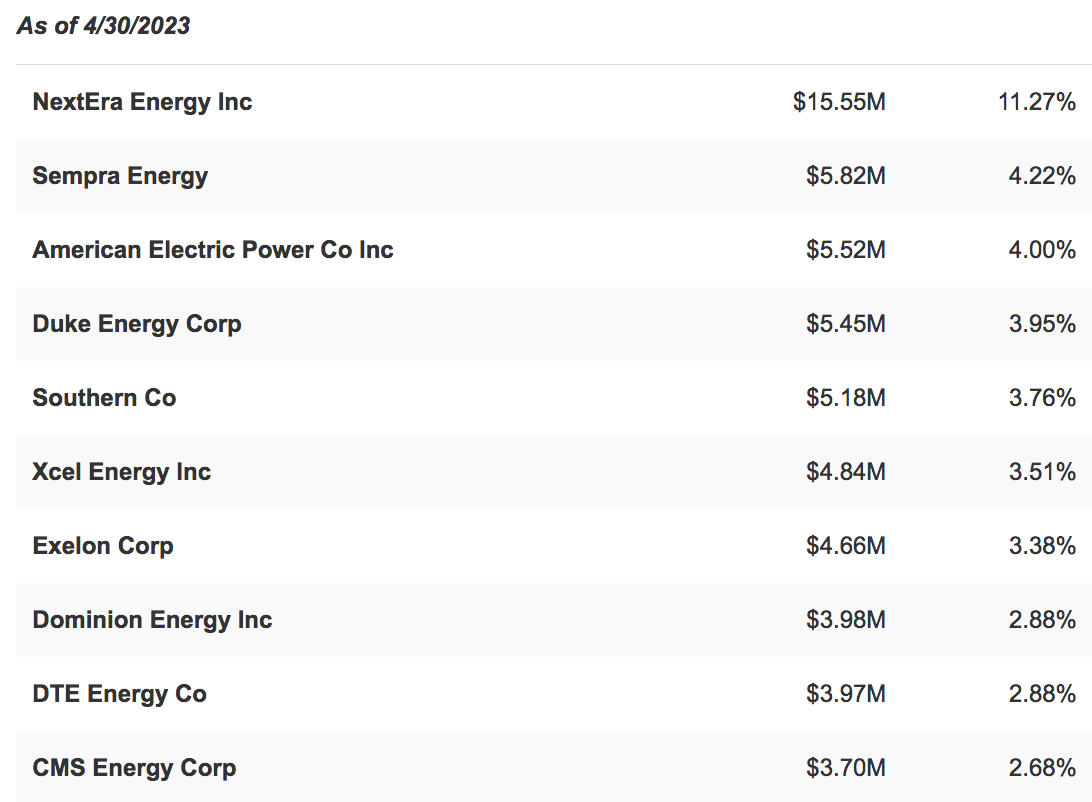
Performance:
As of 3/31/23, UTG had a 7.27% annualized 5-year return on NAV, and a 9.50% NAV return since inception.
UTG site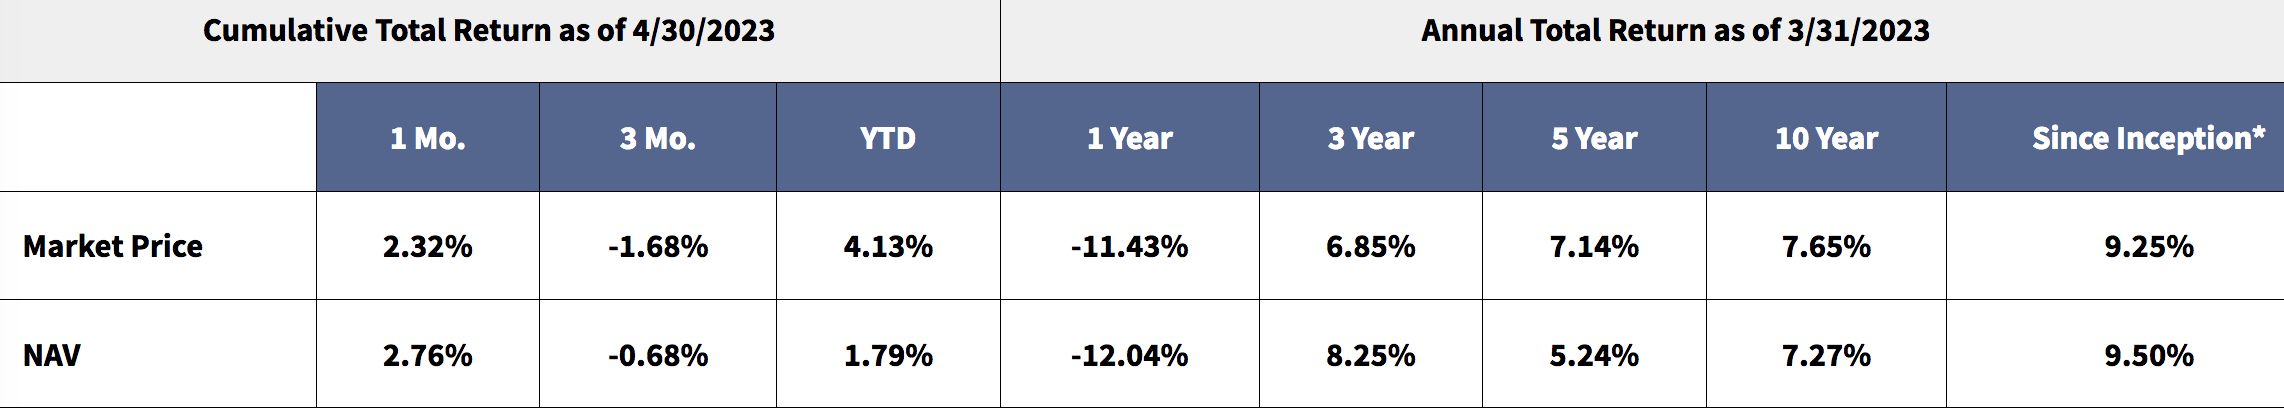
As of 3/31/23, ERH had a 5.41% annualized 5-year return on NAV, and a 7.31% NAV return since inception:
ERH site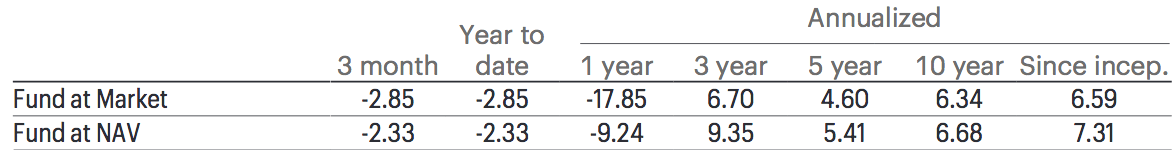
This chart better illustrates the wide margin by which UTG's total return has outdistanced that of ERH over the past 10 years:
Ycharts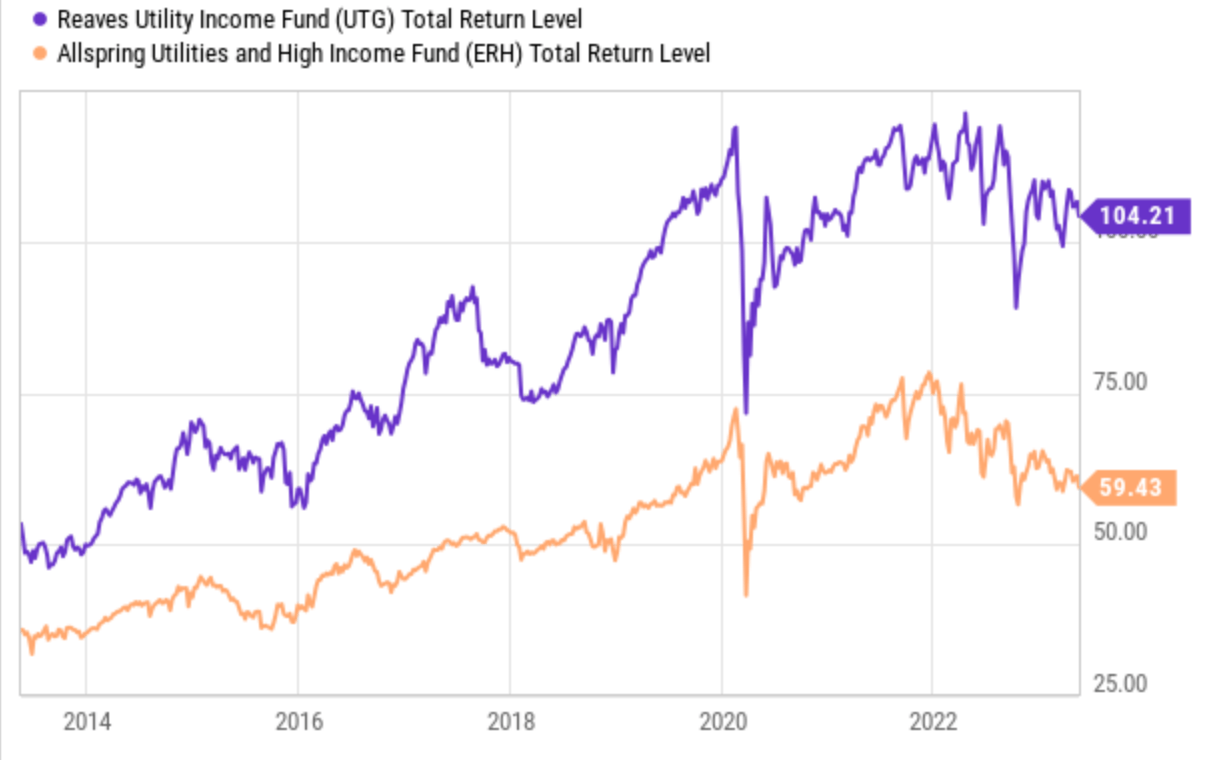
Valuations:
Buying CEF's like UTG and ERH at a deeper discount than their historical average discounts/premiums can be a useful strategy, due to mean reversion. CEFs' daily NAV/share valuations are calculated after the market close.
As of the 5/17/23 close, UTG was selling at a 0.76% premium to NAV/Share, which is higher than its 1- and 5-year average premiums, but lower than its average 3-year premium of 1.23%.
At $27.72, UTG was 45% higher than its Inception NAV of $19.10.
ERH's 5/17/23 $10.23 closing price gave it an 8.33% discount to NAV, which is much deeper than its 1-, 3-, and 5-year average prices to NAV.
Hidden Dividend Stocks Plus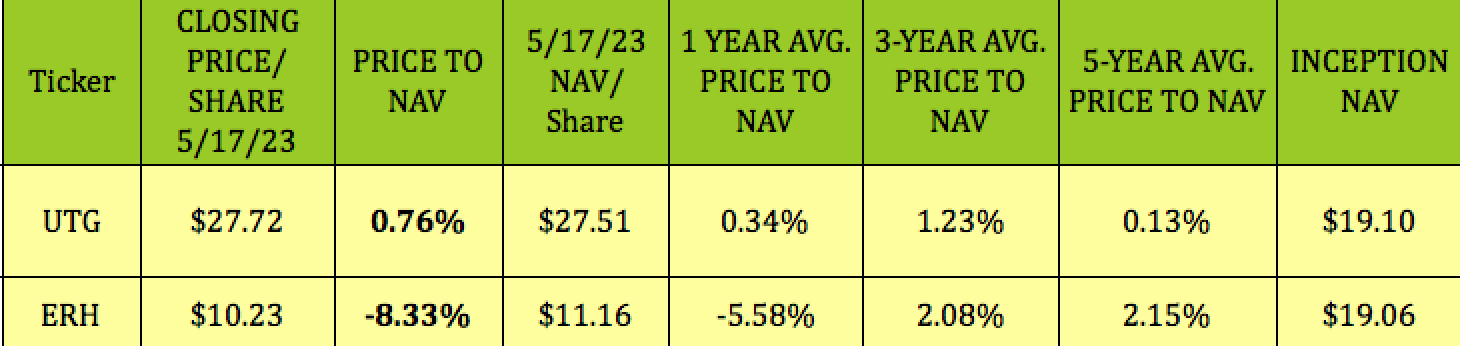
Parting Thoughts:
We've all heard that phrase, "you get what you pay for," or maybe Warren Buffet's famous line, "Price is what you pay, value is what you get."
Those statements seem to sum up the comparison for these 2 CEFs - although buying CEFs at a deeper than average discount can often put you in a good position, buying a fund with a much worse history at a discount probably won't be that rewarding. Such is the case with ERH.
As for UTG, we still own it, but we advise waiting for the next market hissy fit before buying it. It had a big dip in September-October '22, and a very brief dip during the March '23 banking mini-crisis.
If you're interested in other high yield vehicles, we cover them every Friday and Sunday in our articles.
All tables furnished by Hidden Dividend Stocks Plus, unless otherwise noted.
Our Marketplace service, Hidden Dividend Stocks Plus, focuses on undercovered, undervalued income vehicles, and special high yield situations.
We scour the US and world markets to find solid income opportunities with dividend yields ranging from 5% to 10%-plus, backed by strong earnings.
We publish exclusive articles each week with investing ideas for the HDS+ site that you won't see anywhere else.
We offer a range of high yield income vehicles, many of which are still selling below their Net Asset and redemption values in 2023.
This article was written by

Robert Hauver, MBA, was VP of Finance for an industry-leading corporation for 18 years, and publishes SA articles under the name DoubleDividendStocks. TipRanks rates DoubleDividendStocks in the Top 25 of all financial bloggers, and Seeking Alpha rates us in the Top 5 of several categories, including Dividend Ideas, Basic Materials, and Utilities.
"Hidden Dividend Stocks Plus", a Seeking Alpha Marketplace service, which focuses on undercovered and undervalued income vehicles. HDS+ scours the world's markets to find solid income opportunities with dividend yields ranging from 5% to 10%-plus, backed by strong earnings.
Analyst’s Disclosure: I/we have a beneficial long position in the shares of UTG either through stock ownership, options, or other derivatives. I wrote this article myself, and it expresses my own opinions. I am not receiving compensation for it (other than from Seeking Alpha). I have no business relationship with any company whose stock is mentioned in this article.
Disclaimer: This article was written for informational purposes only, and is not intended as personal investment advice. Please practice due diligence before investing in any investment vehicle mentioned in this article.
Seeking Alpha's Disclosure: Past performance is no guarantee of future results. No recommendation or advice is being given as to whether any investment is suitable for a particular investor. Any views or opinions expressed above may not reflect those of Seeking Alpha as a whole. Seeking Alpha is not a licensed securities dealer, broker or US investment adviser or investment bank. Our analysts are third party authors that include both professional investors and individual investors who may not be licensed or certified by any institute or regulatory body.