Equity Market Rally Persists While Other Asset Classes Tell A Story Of Economic Slowdown

Summary
- Purchase Manager Index turned contractionary (below 50) in November 2022 and continued its descent to a low of 46.3 in March 2023.
- Yield Curve first inverted mid 2022 becoming increasingly extreme since then. Historically, recessions typically follow within two years of the inversion.
- During the debt ceiling debate in the summer of 2011, the S&P 500 declined about 17% in 17 days. Today it costs much more to insure those US Treasury bonds.
- Our All-Season portfolio remains positioned for a risk-off environment.

Mik122/iStock via Getty Images
"One of these things is not like the others,
One of these things just doesn't belong,
Can you tell which thing is not like the others
By the time I finish my song?"
- Sesame Street
While the equity market rally begun in October of last year persists, other asset classes continue to tell a story of economic slowdown, lower corporate profits, and ongoing credit concerns. In fact, below the surface (i.e. other than the top twenty mega-capitalization names), the equity market itself is less healthy. We discuss these financial market crosscurrents below and our interpretation of what is signal and what is noise. First, a review of Q1 performance for "primary" assets. [1]
Risky assets were a mixed bag in the first quarter. US equities were up 7.9% during the three-month period, followed closely by global equities which produced a 7.4% return. Commodities lost 2.2% during the quarter, more explicitly corroborating the ongoing economic slowdown.
Indicating the narrowness of the equity rally, the USA MSCI Equal Weighted Index returned 4.2%. In fact, twenty stocks accounted for almost 90 percent of the S&P 500's first quarter gain. Without the mega-capitalization growth stocks, the S&P 500 returned 1.4%. [2]
Safe-haven assets, on the other hand, were uniformly up, signaling a risk-averse attitude. After leading the way in the fourth quarter of 2022, gold put in another strong quarter, up 7.1%. Long-dated US Treasury bonds returned 5.4%.
Consistent with the defensive posture we have held for the past year-plus, the Grey Owl All-Season [3] strategy was essentially flat for the period (down 0.4%). (If the framework we discuss below is directionally correct, the comparison with an equity-heavy benchmark would be towards the top of a bear-market bounce).
Bear Markets in Context
Given the ongoing rally in equity markets, it is worth reproducing a chart we included in our last letter. The chart below juxtaposes the current bear market that began at the end of 2021 with the 2000-3 and 2007-9 bear markets. All bear markets have significant rallies during the overall downward trend. A high-teens percentage rally alone, does not mean the bear market is over.
Figure 1 - Current & Past Bear Markets: (Hedgeye.com)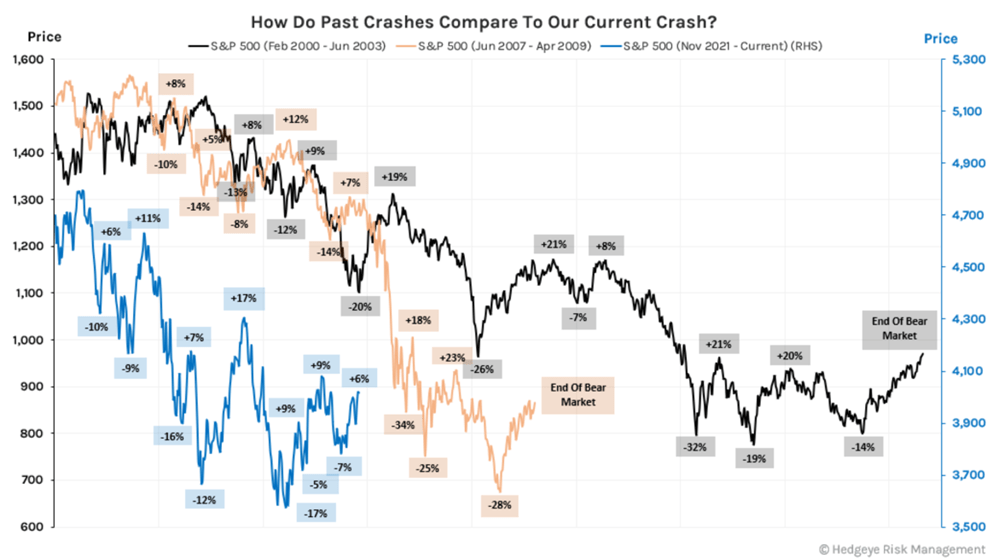
Economic Growth
Growth continued to not just decelerate, but contract, during the first quarter. The chart below should look familiar to consistent readers. We have shared an updated version each of the last few quarters.
The US ISM Manufacturing Purchasing Manager Index (PMI) summarizes in a single datapoint the state of the US economy. The PMI is a "diffusion index" which aggregates survey data from decision makers throughout the manufacturing economy. The questions are around the managers' expectations (e.g. "do you plan to acquire more or less inventory next month compared to this month) and are thus a leading indicator of economic activity.
For over a year now, we have noted the deceleration in the PMI. All the while, expressing our belief that it was likely this indicator would enter contractionary territory (i.e. below 50). It dropped below 50 in November 2022 and has continued lower since to a low of 46.30 in March 2023.
Figure 2 - US ISM Manufacturing PMI monthly (ycharts.com/indicators/us_pmi)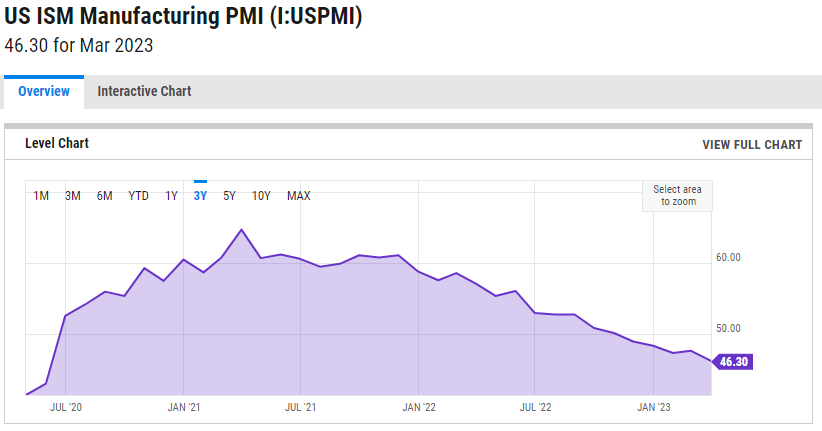
Yield Curve
The yield curve (i.e. the difference between the yield on the 10-year Treasury bond and the yield on the 2-year Treasury bond) agrees with the ISM Manufacturing PMI. The US economy is headed for a recession (if not already in one). Since 1950, every time the yield curve has inverted, a recession has followed within two years. 70% of the time it occurred within a year. [4] As the graph below shows, the yield curve first inverted in the middle of 2022. The inversion has become increasingly extreme as time has gone on.
Figure 3 - (www.tradingview.com)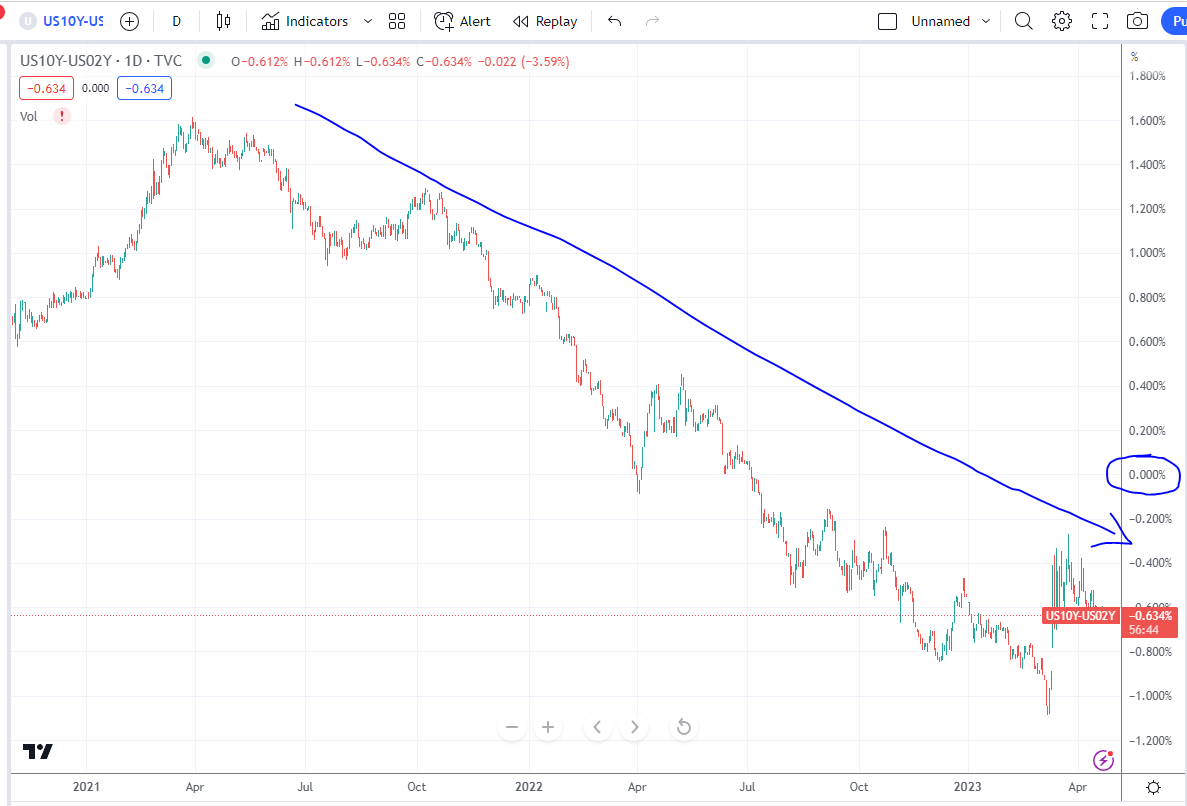
Inflation
Like growth, inflation is subsiding (though it remains quite high relative to the last several decades). Commodity prices (typically the fastest goods to reprice) have been declining since the middle of last summer. While this chart is of historical prices, commodities do offer a forward look at measured inflation.
Figure 4 - IShares GSCI Commodity Indexed Trust Fund (www.tradingview.com)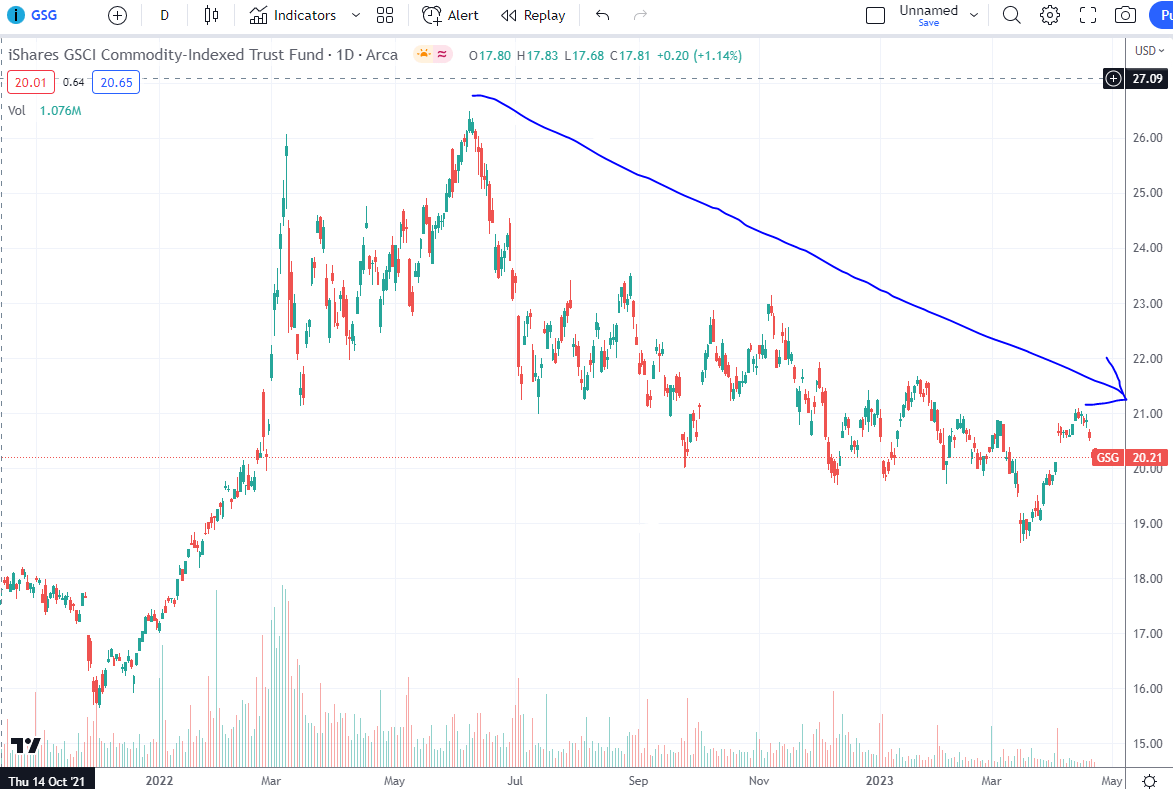
Notwithstanding the above, we are not forecasting a return to the low inflation of the past two decades. There are compelling arguments for both inflation and deflation going forward and the ultimate path is somewhat subject to political developments. As we move toward the back half of this year, comparisons to the previous year will become more difficult and it would not be surprising if inflation "sticks" at a level above the 2% Federal Reserve target. For now, the trend is lower, and we are positioned accordingly.
Corporate Profits
In the middle of 2022, expectations for S&P 500 full year 2022 operating EPS were $225. Final numbers came in at $197. That is a mere 5% decline from the all-time peak in S&P 500 earnings of $208. To put this in perspective, in the milder recession of the early 1990s, earnings declined over 15% from peak four-quarters to trough four-quarters. In 2001, again a mild recession, the similarly measured decline was over 30%. [5]
Today, expectations for the full year 2023 operating EPS are $218. In other words, the consensus expects corporate profits will grow again. Given pressure in central-business-district commercial office real estate, auto loans, and credit cards (to name just the most prominent areas of stress) we think 2023 EPS expectations will revise lower as the year progresses. Until that occurs, we expect continued pressure on equities and other risky financial assets.
The Debt Ceiling and US Sovereign Credit Default Swaps
If all that wasn't bearish enough, the US is approaching the date at which Congress will either need to raise the debt ceiling (the statutory limit on the amount of debt the US federal government can issue) or the Treasury will need to begin prioritizing payments. Current estimates for the deadline are sometime in June.
When this issue last climaxed between July 22, 2011 and August 8, 2011 the S&P 500 declined 17%. [6] Markets learn and investors do not get rich fighting the last battle, but markets also abhor uncertainty. In that context it is worth noting that it costs more to insure US Treasury bonds via credit default swaps today than it did leading into the last debt ceiling standoff in 2011. See the chart on the next page for a dramatic visual of the market's reaction to the debt ceiling debate.
Figure 5 - United States CDS 1 Year USD (investing.com/rates-bonds/united-states-cds-1-year-usd)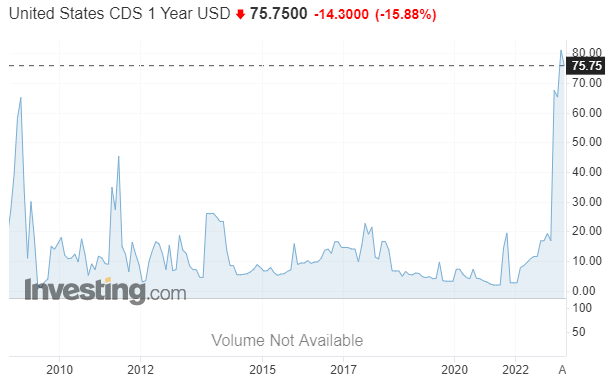
Positioned for Continued Economic Deceleration and Market Volatility
Since the end of 2021, we have positioned the Grey Owl All-Season portfolio for a risk-off environment. That action continues. Our "safe haven" positions, particularly our cash allocation, remain the largest they have ever been. Our biggest long positions are the US Dollar index (a typical safe-haven asset) and a basket of gold and precious metals securities (another safe-haven asset that works best when real rates are compressing). We have slowly been building a position in longer-dated US Treasuries as fears of inflation have subsided and the market appears ready to acknowledge a growth slowdown.
We are acutely aware that markets will shift toward growth and risk-taking long before that becomes obvious in the reported economic data. While equity markets have rallied from oversold levels in late 2022, this move has been very concentrated in the blue-ist of the current blue-chip names. The broad market is sanguine at best. Further, action in commodities, gold, and US Treasuries all point in the "risk-off" direction. One of these assets classes is not like the others. We believe the oddity is noise and the signal is the collection of asset prices pointed in the same safe-haven direction.
*****
[1] We refer to US equities, long-dated US Treasury bonds, gold, and commodities as "primary" asset classes borrowing the language of HCWE & Company. The idea is that these four assets best capture two variables that explain a significant amount of asset price movement: global growth (explained by investor risk sentiment) and inflation. This framework is the basis for a permanent portfolio, an "all-season" portfolio, risk-parity, etc. US equities and commodities are "risk" assets, while US Treasury bonds and gold are "haven" assets. The market (or asset class) returns are measured on a total return basis using index exchange traded funds (ETFs): SPY for the S&P 500, ACWI for the MSCI All-Country World Index, GSG for the S&P GSCI Commodity Index, TLT for 20+ Year Treasury Bond index (i.e. "long-dated" US Treasury bonds), and GLD for gold.
[2] https://www.ft.com/content/b01c0a46-1162-4893-8b92-d42fbf4424a0
[3] Despite the generic and frequent use of the term, we renamed our strategy Grey Owl All-Season after Bridgewater Associates requested we do so claiming it conflicted with a strategy they call All-Weather.
[4] www.bea.gov/ and www.federalreserve.gov/
This newsletter contains general information that is not suitable for everyone. The information contained herein should not be construed as personalized investment advice. Past performance is no guarantee of future results. There is no guarantee that the views and opinions expressed in this newsletter will come to pass. Investing in the stock market involves the potential for gains and the risk of losses and may not be suitable for all investors. Information presented herein is subject to change without notice and should not be considered as a solicitation to buy or sell any security. Any information prepared by any unaffiliated third party, whether linked to this newsletter or incorporated herein, is included for informational purposes only, and no representation is made as to the accuracy, timeliness, suitability, completeness, or relevance of that information.
The stocks we elect to highlight each quarter will not always be the highest performing stocks in the portfolio, but rather will have had some reported news or event of significance or are either new purchases or significant holdings (relative to position size) for which we choose to discuss our investment tactics. They do not necessarily represent all of the securities purchased, sold or recommended by the adviser, and the reader should not assume that investments in the securities identified and discussed were or will be profitable. A complete list of recommendations by Grey Owl Capital Management, LLC may be obtained by contacting the adviser at 1-888-473-9695.
Grey Owl Capital Management, LLC ("Grey Owl") is a Virginia registered investment adviser with its principal place of business in the Commonwealth of Virginia. Grey Owl and its representatives are in compliance with the current notice filing requirements imposed upon registered investment advisers by those states in which Grey Owl maintains clients. Grey Owl may only transact business in those states in which it is notice filed or qualifies for an exemption or exclusion from notice filing requirements. This newsletter is limited to the dissemination of general information pertaining to its investment advisory services. Any subsequent, direct communication by Grey Owl with a prospective client shall be conducted by a representative that is either registered or qualifies for an exemption or exclusion from registration in the state where the prospective client resides. For information pertaining to the registration status of Grey Owl, please contact Grey Owl or refer to the Investment Adviser Public Disclosure web site (www.adviserinfo.sec.gov).
For additional information about Grey Owl, including fees and services, send for our disclosure statement as set forth on Form ADV using the contact information herein. Please read the disclosure statement carefully before you invest or send money.
This article was written by

Analyst’s Disclosure: I/we have no stock, option or similar derivative position in any of the companies mentioned, and no plans to initiate any such positions within the next 72 hours. I wrote this article myself, and it expresses my own opinions. I am not receiving compensation for it. I have no business relationship with any company whose stock is mentioned in this article.
Seeking Alpha's Disclosure: Past performance is no guarantee of future results. No recommendation or advice is being given as to whether any investment is suitable for a particular investor. Any views or opinions expressed above may not reflect those of Seeking Alpha as a whole. Seeking Alpha is not a licensed securities dealer, broker or US investment adviser or investment bank. Our analysts are third party authors that include both professional investors and individual investors who may not be licensed or certified by any institute or regulatory body.