NANR: Downgrade To Hold On Recession Fears

Summary
- NANR holds North American resource equities.
- Resource equities boomed in 2021/2022 on the back of supply/demand fundamentals.
- However, as the economy is set to fall into recession, I believe it is time to exit the long resources trade.
mysticenergy
A few months ago, I wrote a bullish article on the SPDR S&P North American Natural Resources ETF (NYSEARCA:NANR), arguing that investors should own the NANR ETF to take advantage of strong demand for commodities in a supply-constrained world.
However, I also highlighted downside risks as the global economy inched towards a recession. Fast forward a few months and it appears the weakening economy has won out, as the NANR has returned -7.6% since my article while the S&P 500 has returned 3.1% (Figure 1).
Figure 1 - NANR is starting to break down (Seeking Alpha)
Previously, I warned that "I would be more concerned if the price starts to break support ~$52". With the NANR ETF closing a hair below $52 on May 12th, let us reassess the prospects for the NANR ETF.
Brief Fund Overview
The SPDR S&P North American Natural Resources ETF provides exposure to U.S. and Canadian large and mid cap companies that operate in the natural resource and commodities industries including energy, metals & mining, and agriculture. The sector weights for energy, metals & mining, and agriculture are reset each quarter to 45%, 35%, and 20% respectively.
First A Boom...
As I noted in my prior article, the NANR ETF has a very pronounced 'boom/bust' returns profile because natural resource companies are price-takers, so their revenues and earnings are determined by the cyclical price swings of the underlying commodities (Figure 2).
Figure 2 - NANR has boom/bust returns profile (morningstar.com)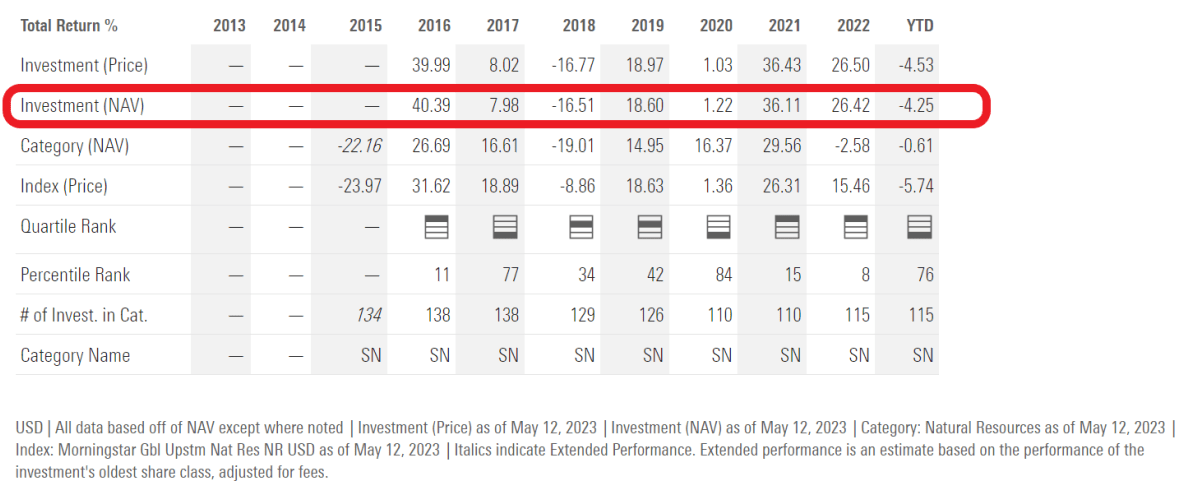
The resource sectors earned bonanza returns after the COVID-pandemic, as supplies were constrained while demand rebounded. This caused the price of many commodities, for example crude oil, to rally sharply from their COVID-lows in early 2020 to their cyclical highs in 2022 (Figure 3).
Figure 3 - WTI crude rallied from $7 to $130 (Stockcharts.com)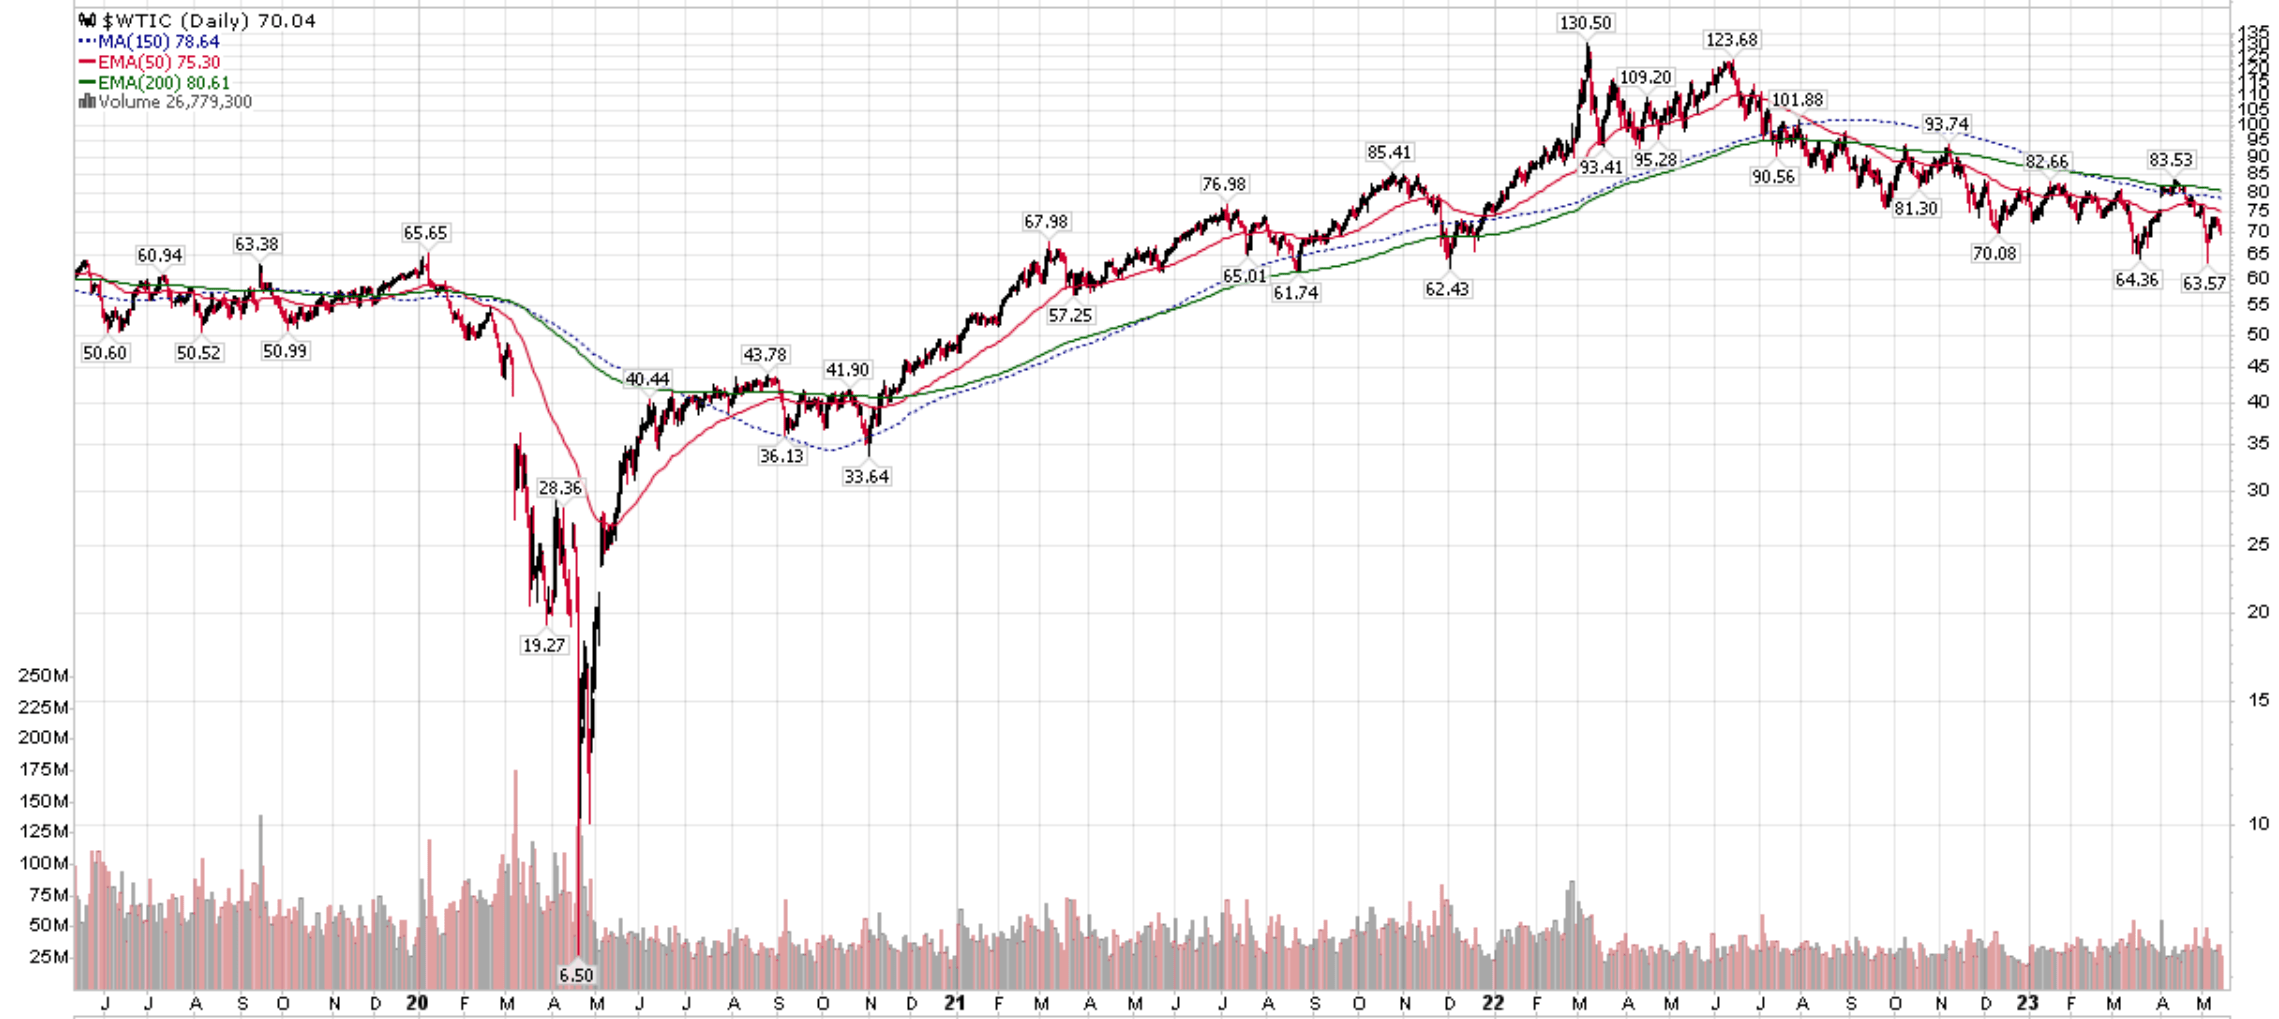
This boosted the revenues and earnings of resource companies, as their business models usually exhibit large operating leverage. For example, if we look Exxon Mobil (XOM), the largest oil producer in the U.S., its total oil-equivalent production was essentially flat from 2020 to 2022 (Figure 4).
Figure 4 - XOM production was flat from 2020 to 2022 (XOM annual report)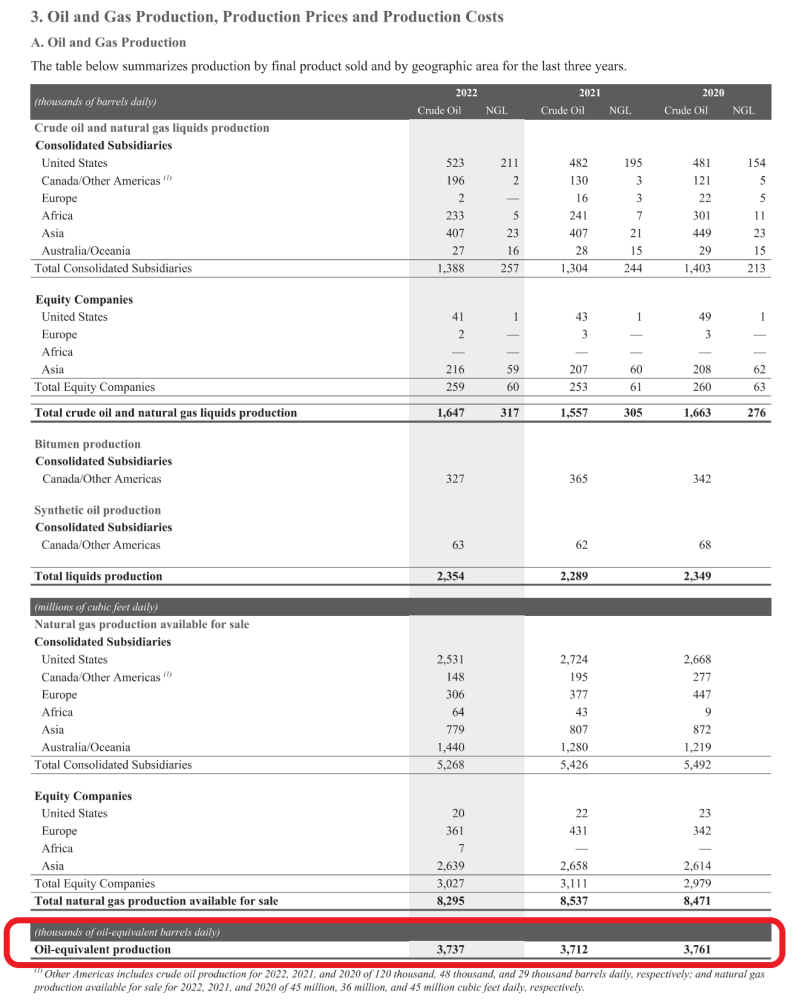
However, XOM's revenues and earnings soared from $178.6 billion and -$22.4 billion in 2020 to $398.7 billion and $55.7 billion in 2022 on higher commodity prices (Figure 5).
Figure 5 - XOM revenues and earnings soared on higher commodity prices (XOM annual report)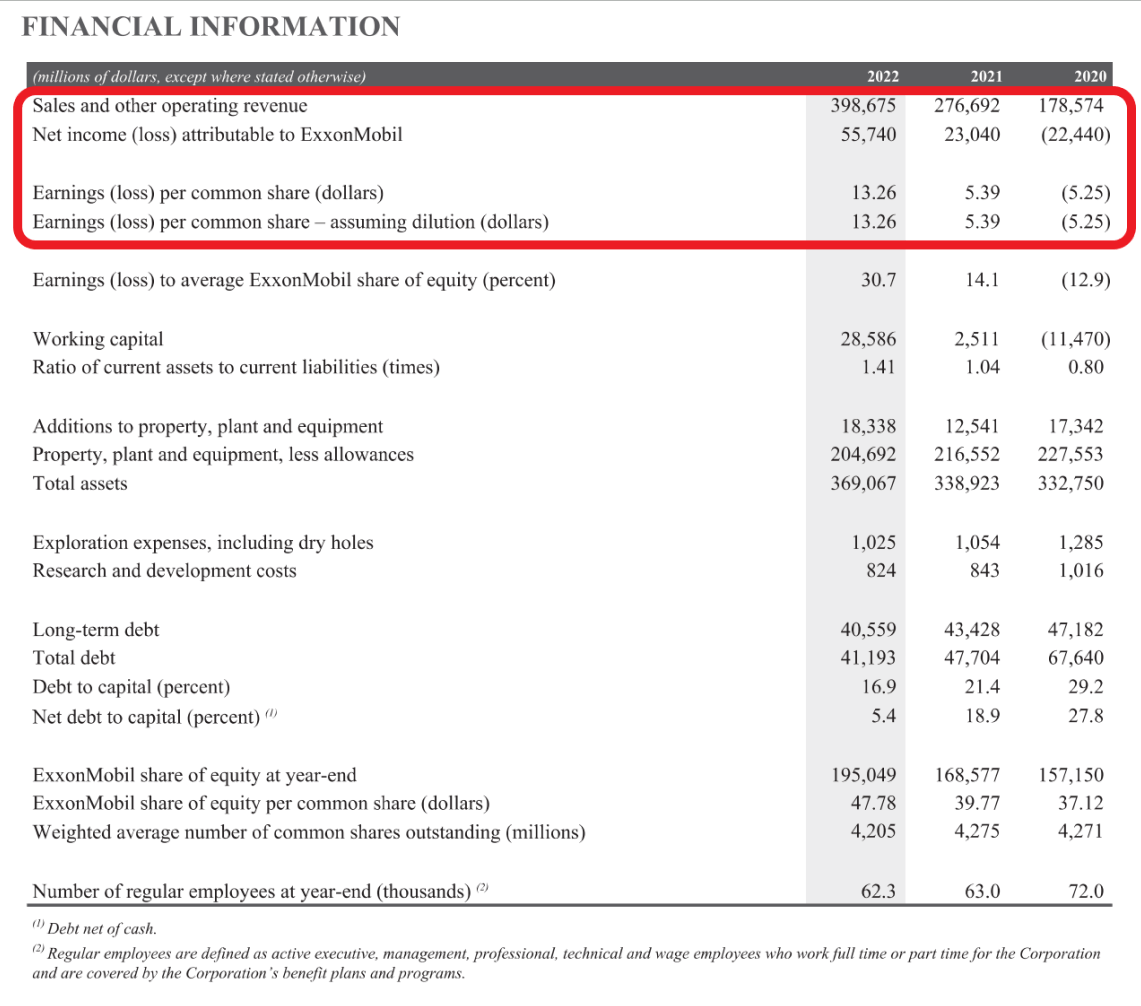
Individual resource companies have little say in the price of their products (contrary to what government officials would have you believe!), and their focus is to produce said commodities at the lowest cost possible and deliver them into a global market where aggregate supply and demand sets the price.
...Now A Bust?
However, since the Russia/Ukraine war induced price spike in early 2022, commodities have generally been on a downtrend, with WTI crude recently touching multi-year lows in the low $60s and wheat halving to ~$6 / bushel (Figure 6).
Figure 6 - Wheat is another commodity that has plunged in price (tradingeconomics.com)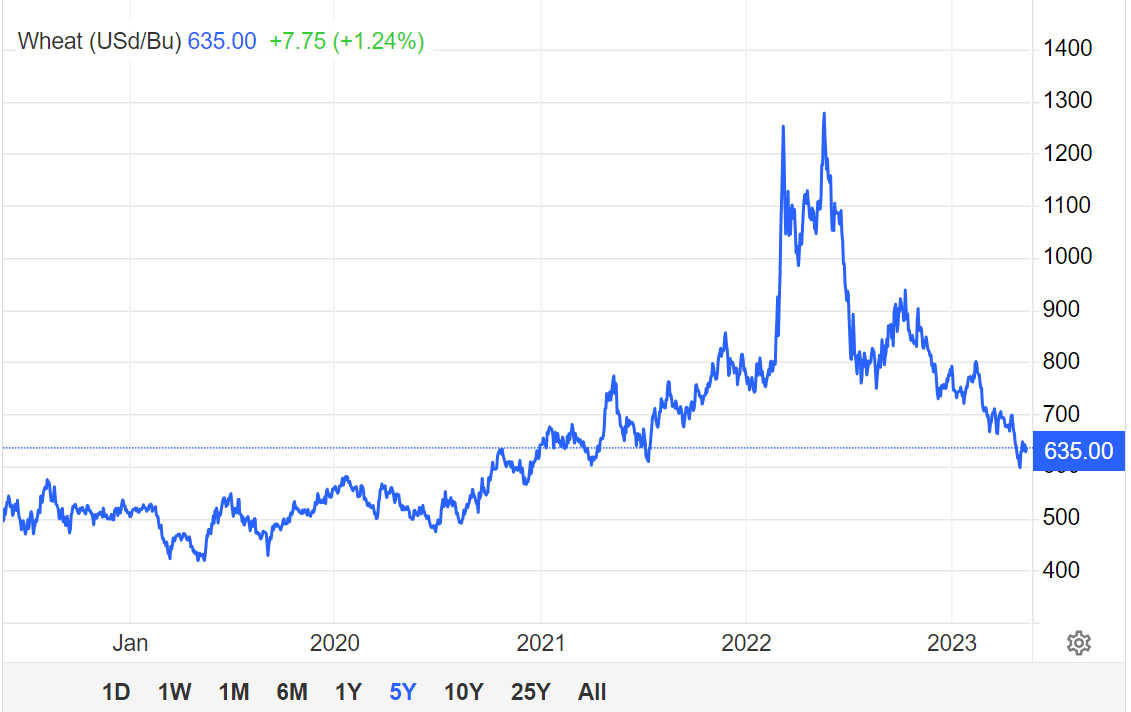
The main reason for weakening commodity prices appears to be deteriorating economic conditions. For example, in the U.S., manufacturing activity has been in contraction since late 2022 (Figure 7).
Figure 7 - ISM Manufacturing PMI in contraction territory (ismworld.org)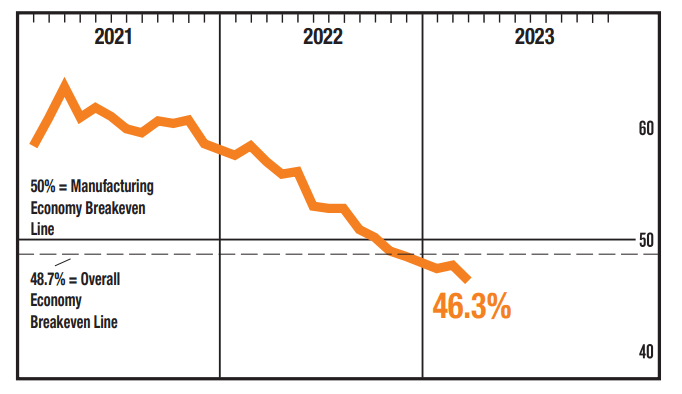
Furthermore, a recent U.S. regional banking crisis is set to further tighten financial conditions for consumers and businesses, as banks retrench and raise their lending standards. In fact, a U.S. recession appears to be the base case for many economists (Figure 8).
Figure 8 - A recession appears to be the base case (Conference Board)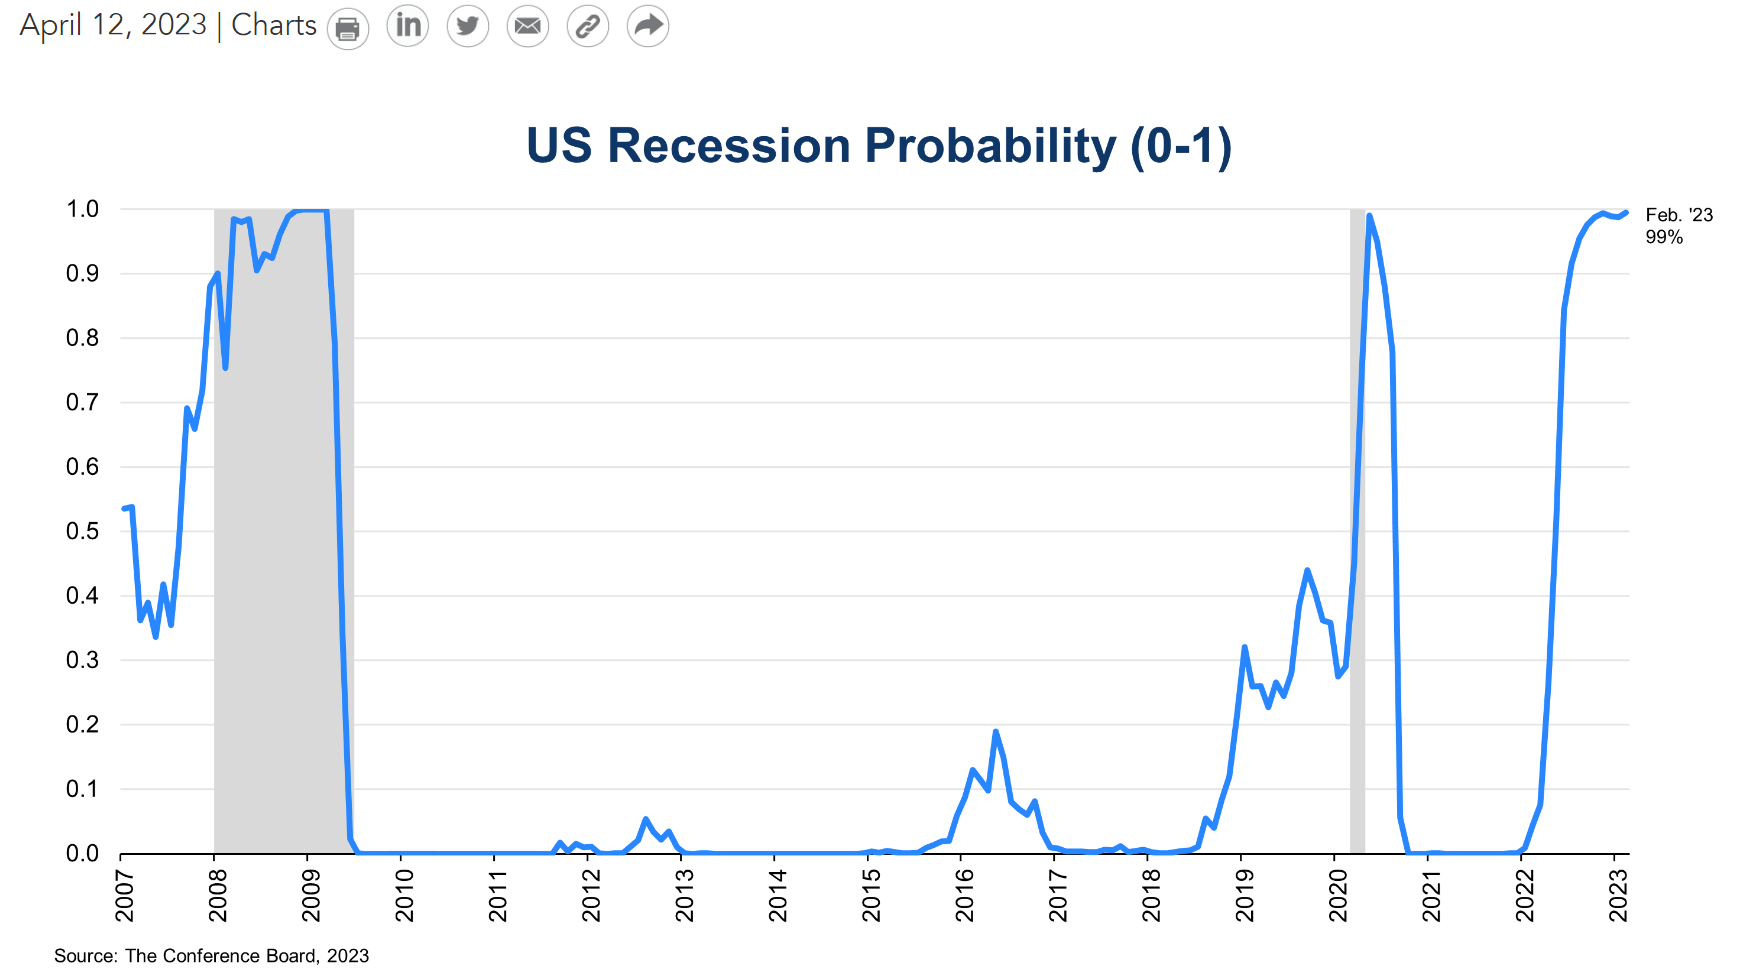
The problem for resource companies is that commodity prices tend to fall during recessions. For example, looking at WTI crude oil, prices tend to plunge during recessions (Figure 9). This is because for commodities like oil, supply tends to be inelastic, so when consumers and businesses reduce their demand during recessions, suppliers keep pumping (or digging), and prices collapse.
Figure 9 - Crude oil prices plunge during recessions (St. Louis Fed)
Similar patterns can be shown for other commodities such as copper (Figure 10).
Figure 10 - Copper prices also follow similar patterns (St. Louis Fed)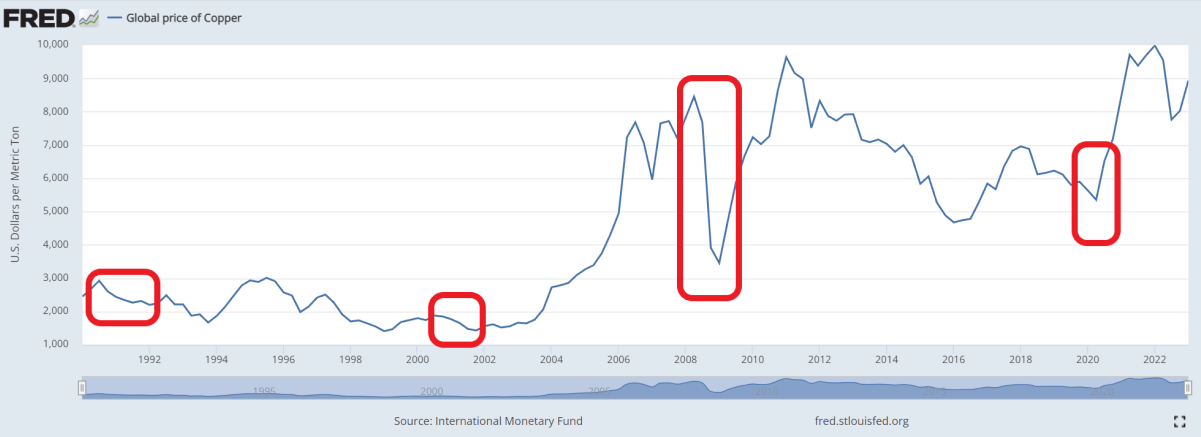
Therefore, resources companies have been some of the worst performing in recent months, modeled by the returns of the Energy Select Sector SPDR ETF (XLE) and Materials Select Sector SPDR ETF (XLB) in the past 6 months, as investors price in a recession (Figure 11).
Figure 11 - Energy and materials have been some of the weakest sectors in recent months (sectorspdrs.com)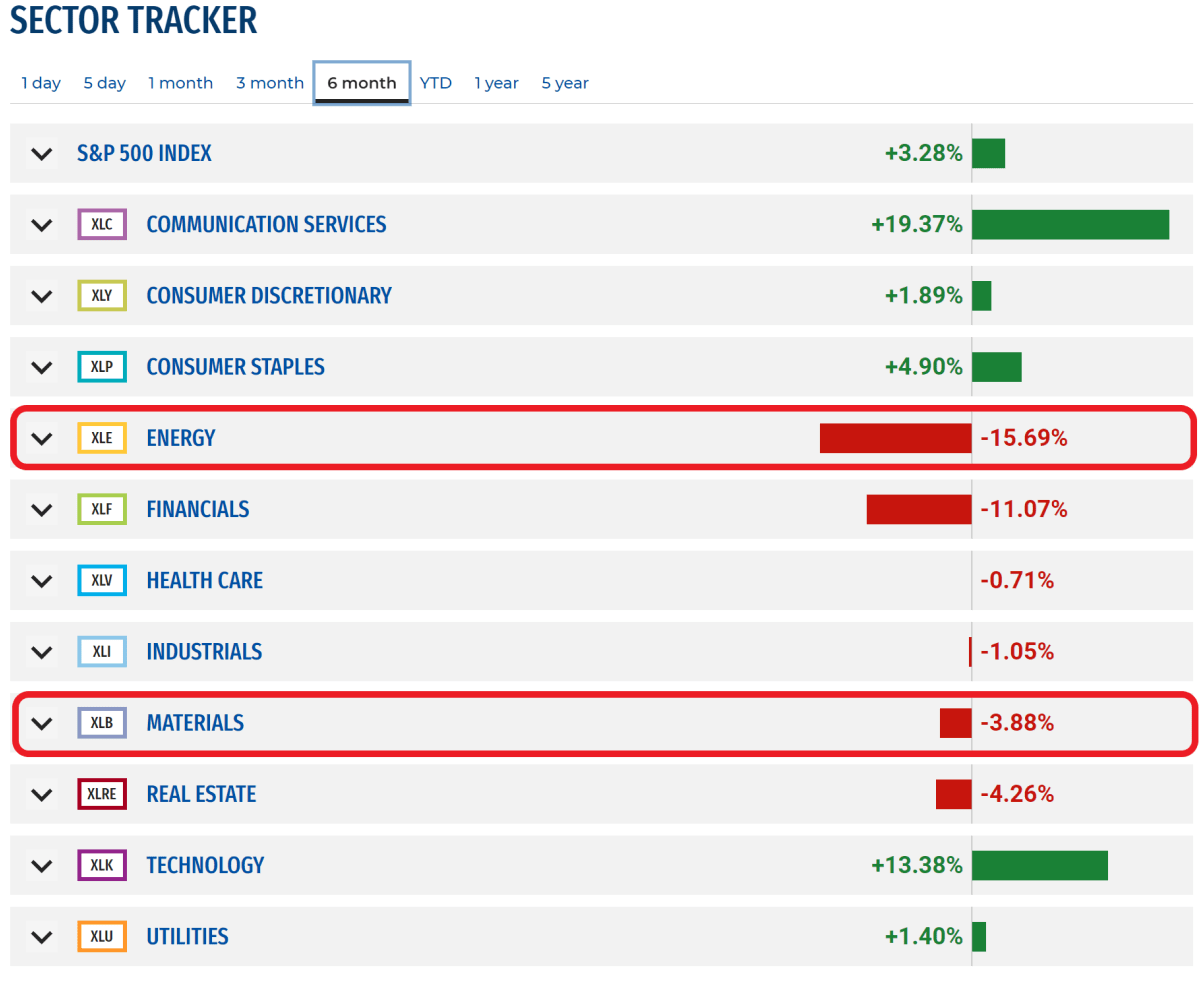
Technicals At Make Or Break
Technically, the NANR ETF is nearing 'make or break' levels that I highlighted in my prior article, connecting the uptrend since early 2021, as well as the $52 support level (Figure 10).
Figure 12 - NANR at make or break technical levels (Author created with price chart from stockcharts.com)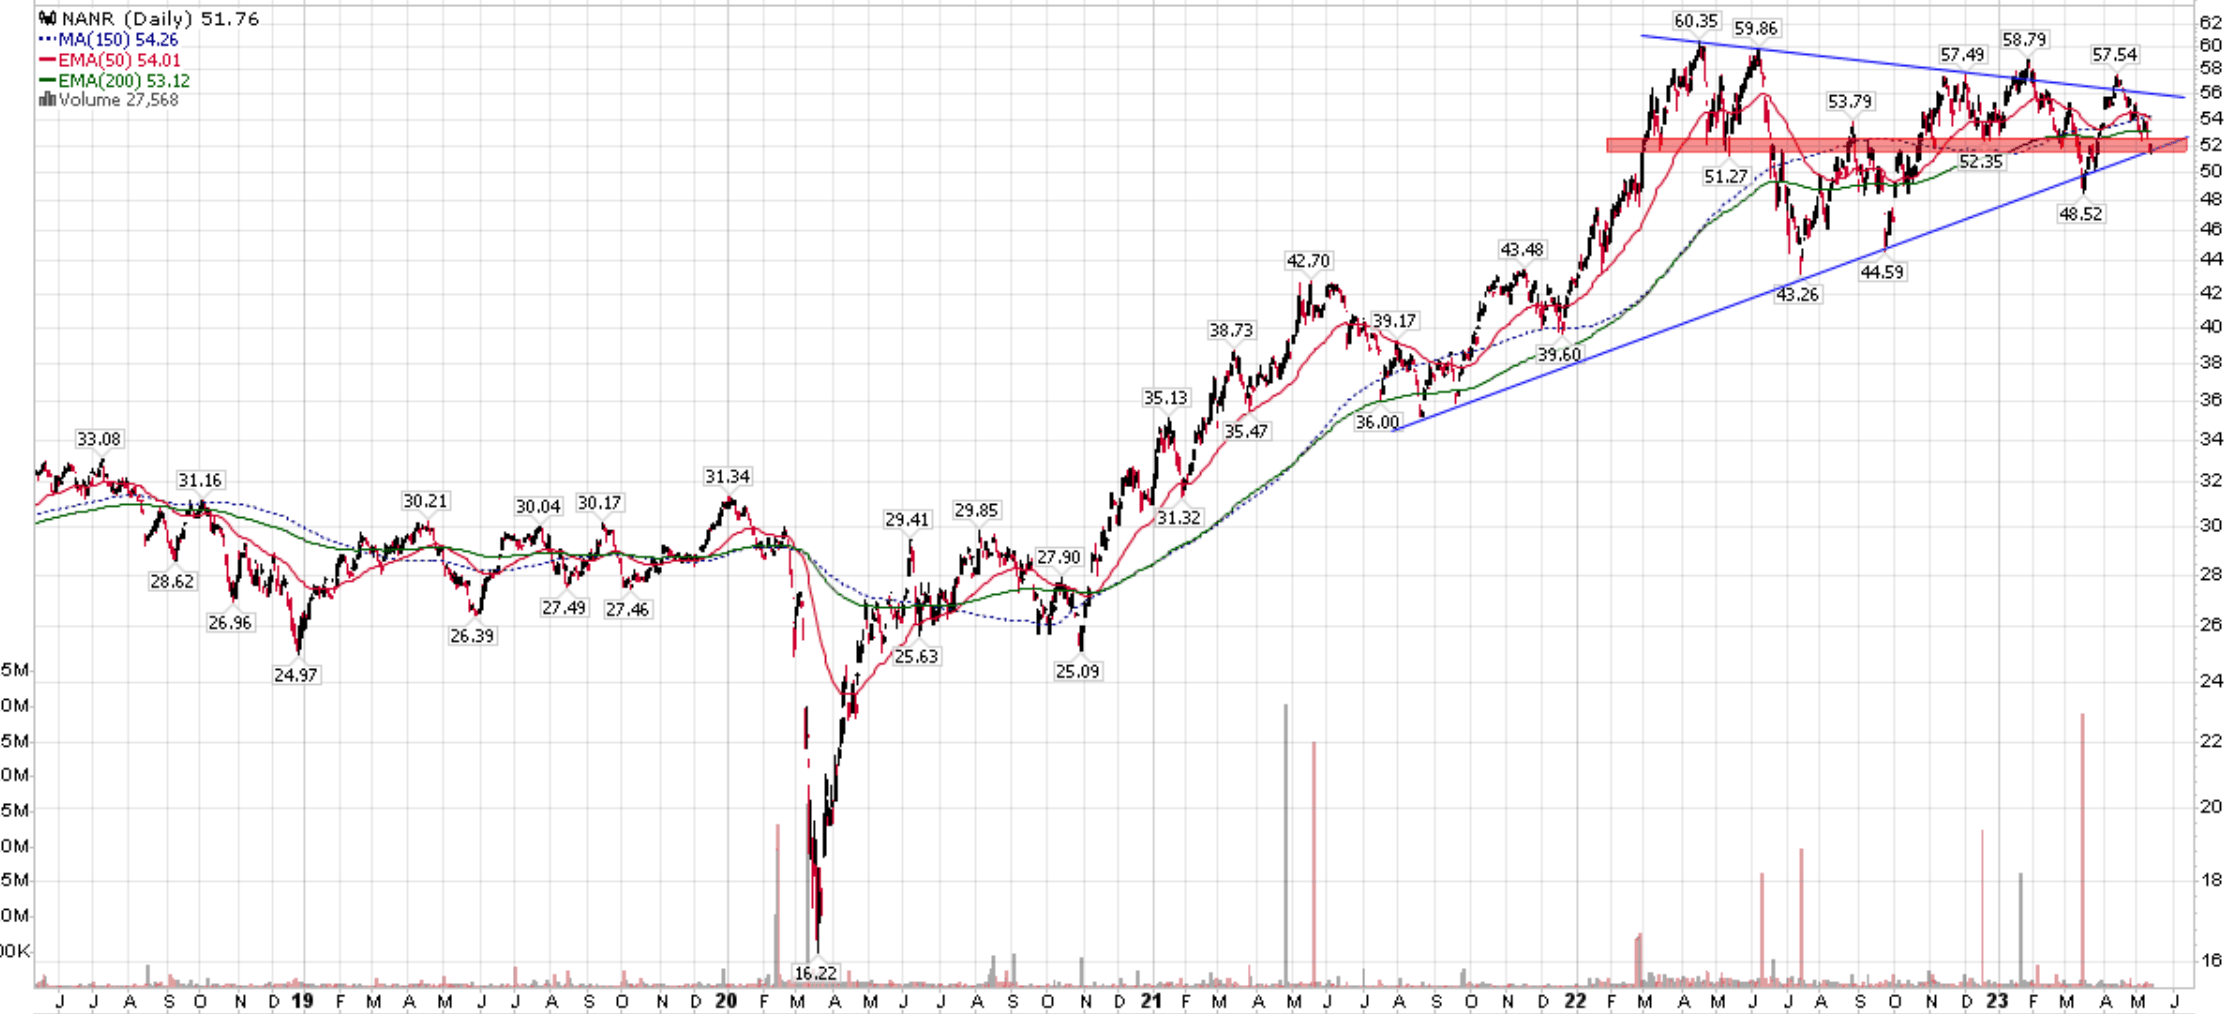
I believe NANR's price will weaken further, confirming the negative macro fundamentals highlighted above.
Conclusion
The NANR ETF provides exposure to mid- to large-cap natural resource companies in the U.S. and Canada. Resource companies appear to have entered a new bear phase on the back of weakening economic fundamentals. I am downgrading the NANR ETF as I believe a recession is now unavoidable.
The NANR ETF is on cusp of a technical breakdown that will confirm the weak macro-economic picture. I believe investors should take a stop loss and exit the bullish trade.
This article was written by

Analyst’s Disclosure: I/we have no stock, option or similar derivative position in any of the companies mentioned, and no plans to initiate any such positions within the next 72 hours. I wrote this article myself, and it expresses my own opinions. I am not receiving compensation for it (other than from Seeking Alpha). I have no business relationship with any company whose stock is mentioned in this article.
Seeking Alpha's Disclosure: Past performance is no guarantee of future results. No recommendation or advice is being given as to whether any investment is suitable for a particular investor. Any views or opinions expressed above may not reflect those of Seeking Alpha as a whole. Seeking Alpha is not a licensed securities dealer, broker or US investment adviser or investment bank. Our analysts are third party authors that include both professional investors and individual investors who may not be licensed or certified by any institute or regulatory body.