SPHD Vs. LVHD: Rival ETF Outperforming The Better Known ETF

Summary
- The Invesco S&P 500 High Dividend Low Volatility ETF invests based on the S&P 500 Low Volatility High Dividend Index.
- The Franklin U.S. Low Volatility High Dividend Index ETF invests based on the QS Low Volatility High Dividend Index.
- Both ETFs and their indices are reviewed and then the ETFs are compared. I also look at whether trying to meet potentially conflicting goals in the same ETF works.
- My conclusion for investors willing to let the manager decide between risk and income, the ETF to own is the Franklin U.S. Low Volatility High Dividend Index ETF.
- Looking for more investing ideas like this one? Get them exclusively at Hoya Capital Income Builder. Learn More »

TERADAT SANTIVIVUT
(This article was co-produced with Hoya Capital Real Estate)
Introduction
Is it really possible to achieve two goals some investors cherish in the same ETF: lower volatility and more income? In my limited attempt to answer that question, the answer was neither was achieved as well when compared to ETFs that attempted just one of those targeted goals. I will examine that again in the Portfolio strategy segment of this article. Putting that aside for now, this article will review and then compare two ETFs that are indeed trying to accomplish both goals:
- Invesco S&P 500 High Dividend Low Volatility ETF (NYSEARCA:SPHD)
- Franklin U.S. Low Volatility High Dividend Index ETF (NASDAQ:LVHD)
Invesco S&P 500 High Dividend Low Volatility ETF review
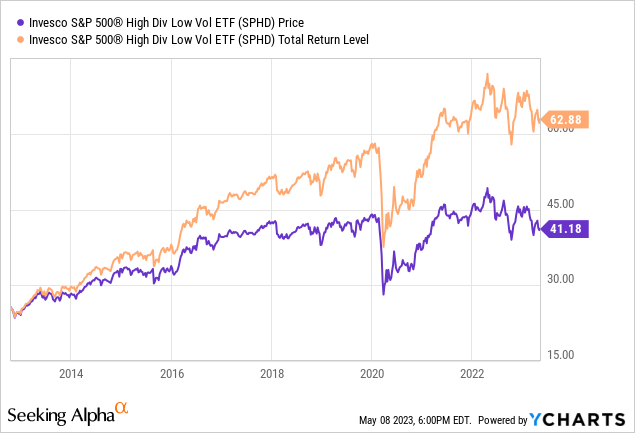
Seeking Alpha describes this ETF as:
The investment seeks to track the investment results (before fees and expenses) of the S&P 500® Low Volatility High Dividend Index. The fund invests in stocks of companies operating across diversified sectors. It invests in less volatile stocks of large-cap companies. It invests in dividend paying stocks of companies. SPHD started in 2012.
Source: seekingalpha.com SPHD
SPHD has $3.5b in AUM and the ETF generates 30bps for the managers. The TTM Yield is 3.15%.
Index review
S&P defines their index as:
The S&P 500 Low Volatility High Dividend index measures the performance of the 50 least-volatile high dividend-yielding stocks in the S&P 500. The index is designed to serve as a benchmark for income-seeking investors in the U.S. equity market.
Source: spglobal.com Index
Index rules were also provided.
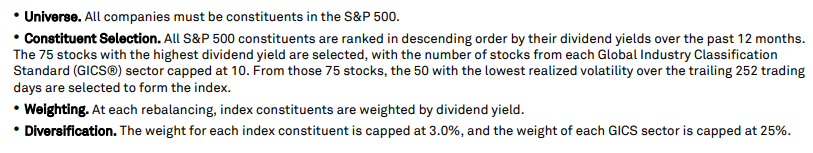
spglobal.com
SPHD holdings review
The sector allocations differs greatly from what a standard S&P 500 Index investing ETF looks like.
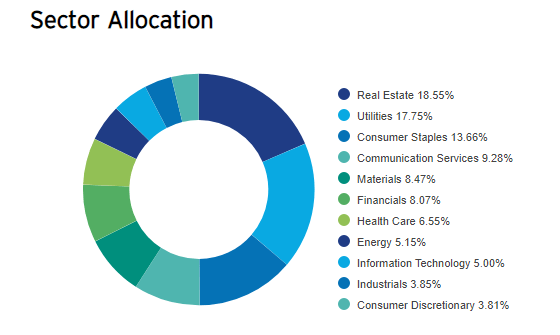
invesco.com SPHD sector
The two largest allocations, which are over 36% combined (Real Estate & Utilities) are only about 6% in such ETFs. The largest there is usually Technology: here it is one of the smallest.
Top holdings
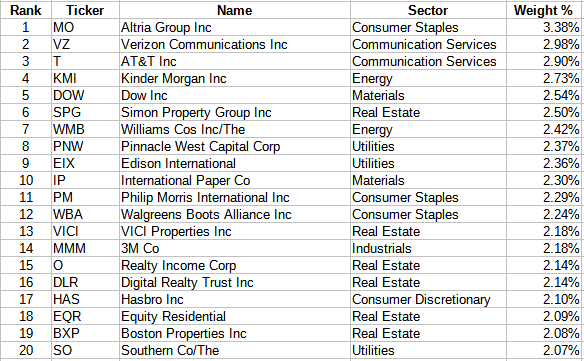
invesco.com; compiled by Author
The portfolio is well balanced top-to-bottom as the Top 20 are 48% and the lower half still accounts for 42% of the portfolio weight.
SPHD distribution review
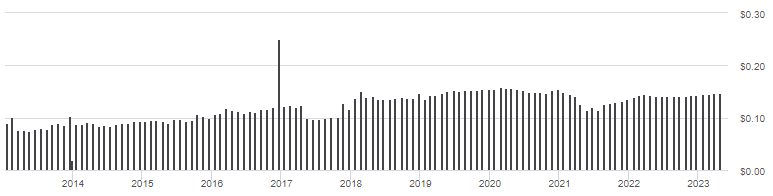
seekingalpha.com SPHD DVDs
Payouts are still below their pre-COVID levels, with the bottom actually occurring in 2021. Despite that fact, Seeking Alpha grades these results as a "B+".
seekingalpha.com SPHD scorecard
Franklin U.S. Low Volatility High Dividend Index ETF review
Seeking Alpha describes this ETF as:
The investment seeks to track the investment results of the QS Low Volatility High Dividend Index composed of equity securities of U.S. companies with relatively high yield and low price and earnings volatility. The index is composed of stocks of U.S. companies across a wide range of market capitalizations, including the largest 3,000 U.S. stocks as determined by the Solactive US Broad Market Index. LVHD started in 2015.
Source: seekingalpha.com LVHD
LVHD has $1.1b in AUM, a fraction of what SPHD has. Investors benefit from only 27bps in fees, 3bps less than SPHD. Here the TTM Yield is 3.35%.
Index review
Finding actual index methodology on this index proved elusive for the most part. The index is based on historical and projected data using QS Investors' proprietary methodology. The index screens for profitable companies that have the potential to pay relatively high sustainable dividend yields.
LVHD holdings review
The benchmark used in the next chart is the Russell 3000 Index; which might explain LVHD's exposure to Small-Cap stocks.
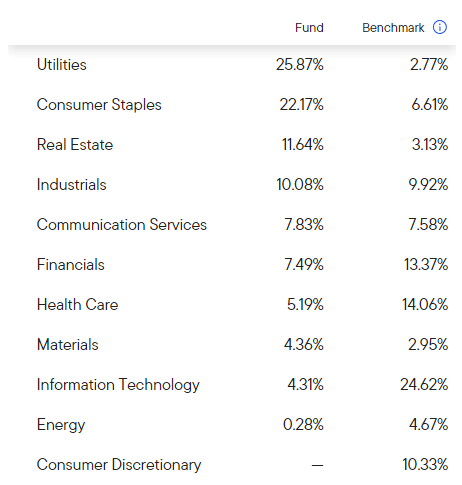
franklintempleton.com LVHD sectors
Top Holdings

franklintempleton.com
Despite holding nearly three times the number of stocks that SPHD holds, the Top 20 weights are close: here coming in at 47%. LVHD is not as well balanced as the bottom half are only 8% of the portfolio weight, making LVHD more concentrated even though it holds more stocks.
LVHD distribution review
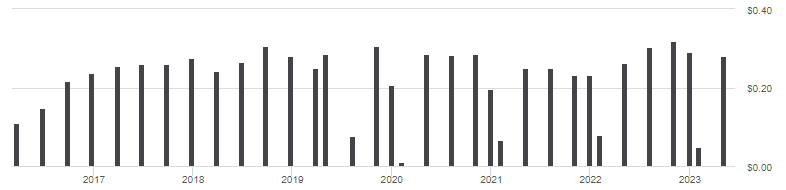
seekingalpha.com LVHD DVDs
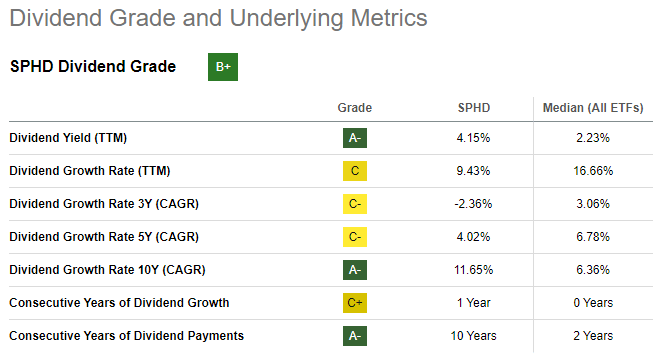
LVHD recently has been paying a special dividend early in the year which explains the very short bars in the above chart. Seeking Alpha give this pattern a "B" grade.
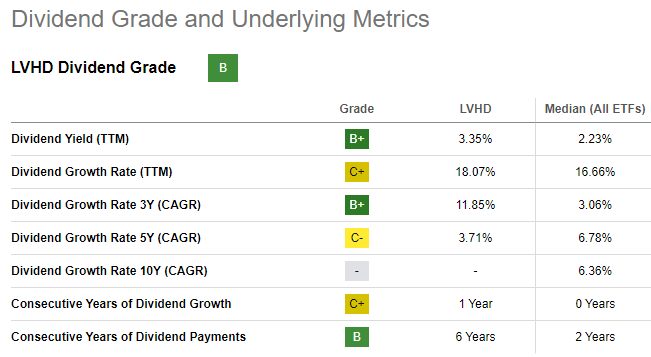
seekingalpha.com LVHD scorecard
Comparing ETFs
While both invest for the same two reasons, they allocations do differ for both market-cap and growth/value weightings.
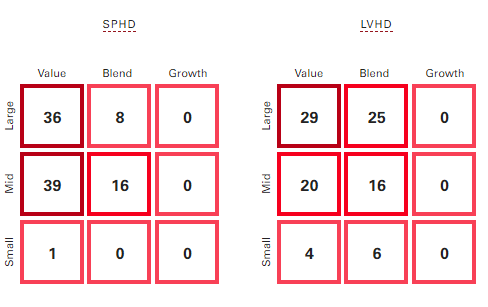
advisors.vanguard.com
SPHD is more top-weighted and Value weighted than LVHD. As one might expect, neither ETF hold stocks classified a Growth.
Both ETFs hold a very limited number of stocks, with little overlap. There are sector differences to consider though.
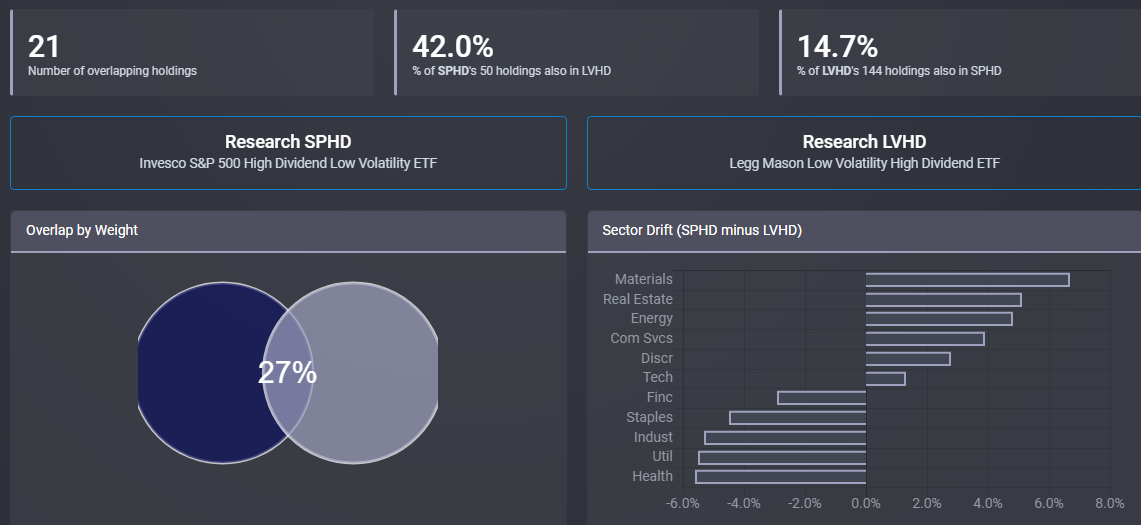
ETFRC.com
All but three sectors differ by 4-7%, which is the most I have seen when using this data source. Hopefully sectors the investor likes/dislikes all align within the same ETF.
None of the Top 10 stocks are the same. The next data set shows the largest over/under weights between the ETFs.
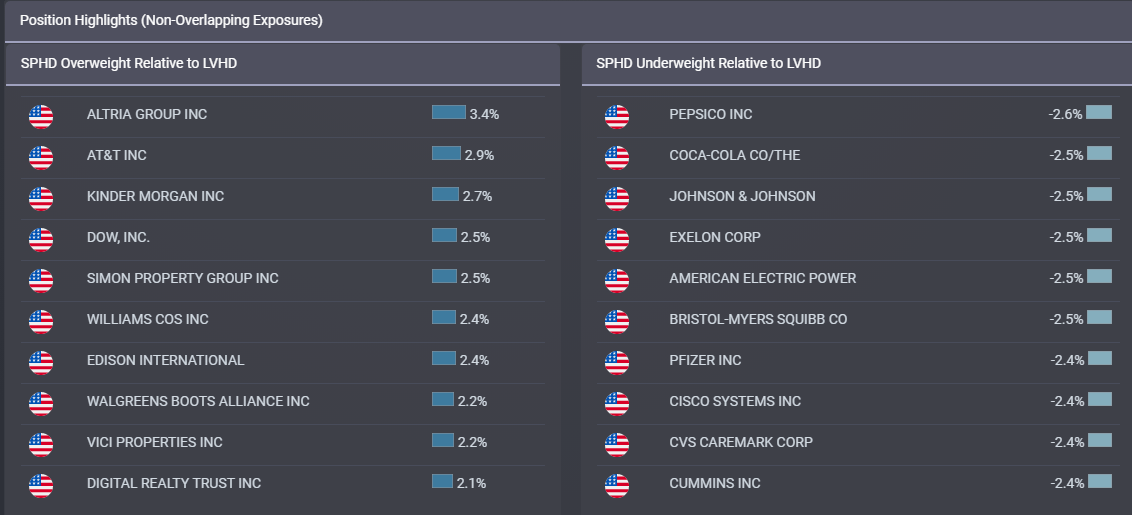
ETFRC.com
The above are all a point-in-time; let's see how their strategies have translated into risk taken and return generated.
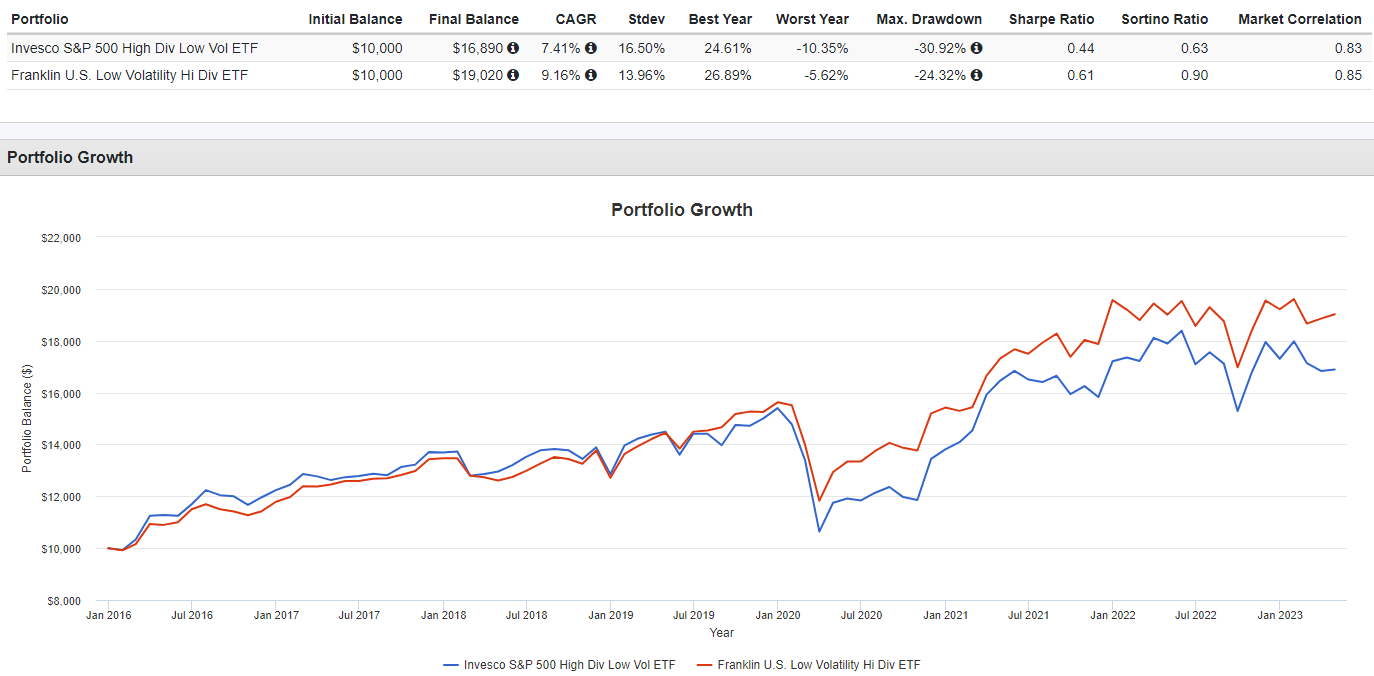
PortfolioVisualizer.com
Al the return and risk data points to LVHD being the better choice between this two. Looking at annual returns, LVHD was on top six out of eight years, including being ahead so far in 2023. Th next section looks at these ETFs from a different angle and yet seems to come to the same conclusion.
Portfolio strategy
To see if combining low volatility and high dividend in the same ETF works, I compared SPHD against two separate ETFs that use the same universe of S&P stocks, but only targets one of those goals each. They are:
I also included the SPDR® S&P 500 ETF (SPY) as an investor might be thinking of replacing SPY with one of these factored versions of the S&P 500 Index. Data here goes back to late 2015.
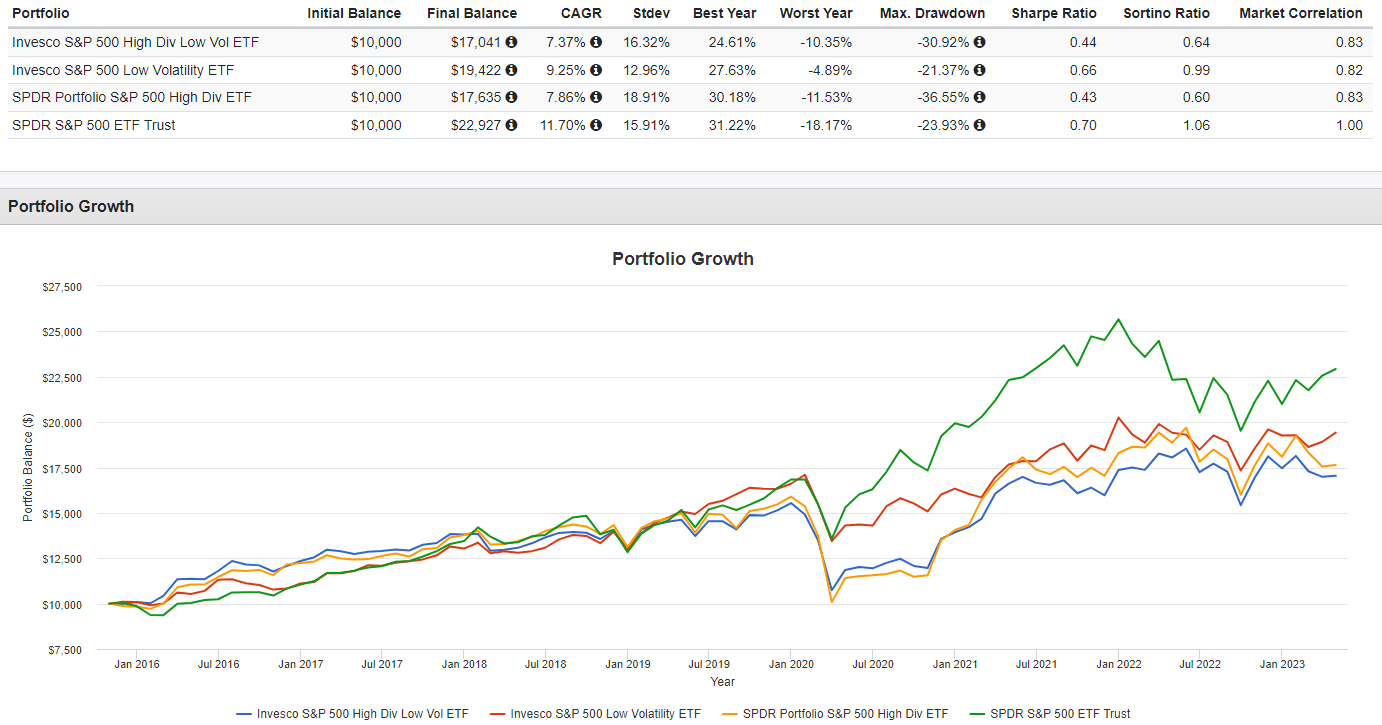
PortfolioVisualizer.com
The findings are:
- None of the factored ETFs matched SPY in the return generated. Two of the three other ETFs also had more StdDev than SPY.
- When comparing SPHD to the single-factor ETFs, its return trails both. For risk, it falls between the two, with SPLV achieving its goal of having the lowest StdDev.
- SPYD generates more income than SPHD, showing that adding a volatility screen can affect the dividends earned.
Final thoughts
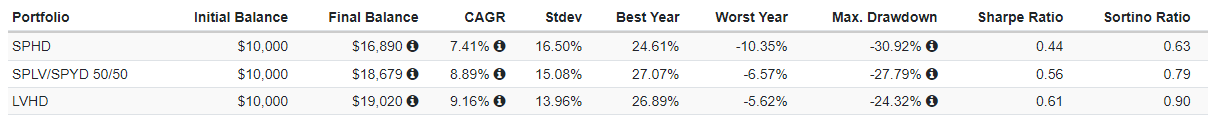
I ran one more test: comparing SPHD with a portfolio consisting of SPLV and SPYD at two allocation; which each investor can set for themselves.
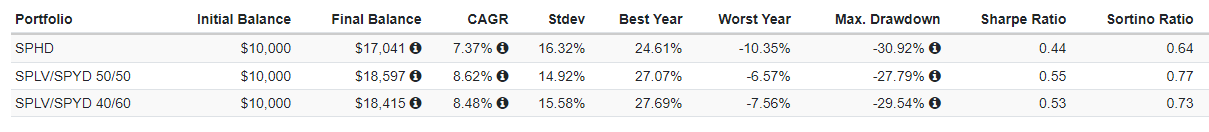
PortfolioVisualizer.com
With little loss of income, either combination portfolio had a higher return and lower StdDev than SPHD managed to achieve. I then added LVHD as a choice, though the data now starts in 2016. The results here show a properly designed dual strategy ETF can work!
PortfolioVisualizer.com
My conclusion becomes for investors willing to let the manager decide between risk and income, the ETF to own is the Franklin U.S. Low Volatility High Dividend Index ETF.

I ‘m proud to have asked to be one of the original Seeking Alpha Contributors to the 11/21 launch of the Hoya Capital Income Builder Market Place.
This is how HCIB sees its place in the investment universe:
Whether your focus is high yield or dividend growth, we’ve got you covered with high-quality, actionable investment research and an all-encompassing suite of tools and models to help build portfolios that fit your unique investment objectives. Subscribers receive complete access to our investment research - including reports that are never published elsewhere - across our areas of expertise including Equity REITs, Mortgage REITs, Homebuilders, ETFs, Closed-End-Funds, and Preferreds.
This article was written by

I have both a BS and MBA in Finance. I have been individual investor since the early 1980s and have a seven-figure portfolio. I was a data analyst for a pension manager for thirty years until I retired July of 2019. My initial articles related to my experience in prepping for and being in retirement. Now I will comment on our holdings in our various accounts. Most holdings are in CEFs, ETFs, some BDCs and a few REITs. I write Put options for income generation. Contributing author for Hoya Capital Income Builder.
Analyst’s Disclosure: I/we have no stock, option or similar derivative position in any of the companies mentioned, and no plans to initiate any such positions within the next 72 hours. I wrote this article myself, and it expresses my own opinions. I am not receiving compensation for it (other than from Seeking Alpha). I have no business relationship with any company whose stock is mentioned in this article.
Seeking Alpha's Disclosure: Past performance is no guarantee of future results. No recommendation or advice is being given as to whether any investment is suitable for a particular investor. Any views or opinions expressed above may not reflect those of Seeking Alpha as a whole. Seeking Alpha is not a licensed securities dealer, broker or US investment adviser or investment bank. Our analysts are third party authors that include both professional investors and individual investors who may not be licensed or certified by any institute or regulatory body.