IQDG: Global Dividend ETF Outperforming Competitors In The Last 12 Months

Summary
- WisdomTree International Quality Dividend Growth Fund holds global dividend stocks with quality and growth characteristics.
- It is well-diversified across countries and sectors, but it is quite concentrated in the top holdings.
- Historical performance is average, but it has outperformed competitors in the last 12 months.
- It is not focused on dividend-growth stocks, albeit it has an excellent dividend growth rate.
- Quantitative Risk & Value members get exclusive access to our real-world portfolio. See all our investments here »
RomoloTavani
This article series aims at evaluating ETFs (exchange-traded funds) regarding the relative past performance of their strategies and metrics of their current portfolios. Reviews with updated data are posted when necessary.
IQDG strategy and portfolio
WisdomTree International Quality Dividend Growth Fund (BATS:IQDG) started investing operations on 04/07/2016 and tracks the WisdomTree International Quality Dividend Growth Index. It has a portfolio of 249 stocks, a 12-month distribution yield of 2.13% and a total expense ratio of 0.42%. Distributions are paid quarterly.
As described in the prospectus by WisdomTree, the underlying index...
...is comprised of the top 300 companies from the WisdomTree International Equity Index with the best combined rank of growth and quality factors. The growth factor ranking is based on long-term earnings growth expectations, while the quality factor ranking is based on three year historical averages for return on equity and return on assets. Companies are weighted in the Index based on annual cash dividends paid.
The index excludes Canada and the U.S.
It appears in this description that the fund’s name may be misleading for investors seeking a portfolio of dividend-growth stocks. The strategy selects dividend stocks with growth characteristics, not necessarily with growing dividends.
The fund invests mostly in Europe (about 80% of asset value) and in large companies (84%). The top three countries are Switzerland (18.4%), the U.K. and France (14.4%). Other countries are below 8%. Hong Kong weighs 3.2%, so direct exposure to geopolitical and regulatory risks related to China is low. The next chart lists the countries weighting more than 1% of asset value, representing an aggregate weight of 97.6%.
Geographical allocation (Chart: author; data: WisdomTree)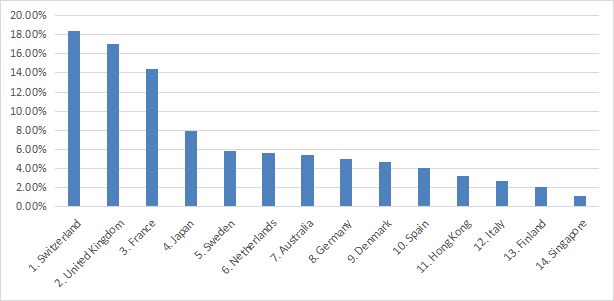
The top three sectors are well-balanced: consumer discretionary (20.9%), healthcare (19.5%) and consumer staples (19.1%). Then, come industrials (14.5%) and technology (11.5%). Other sectors are below 5% individually and 15% in aggregate. The fund almost ignores communication services (0.18%).
Sector breakdown (Chart: author; data: WisdomTree)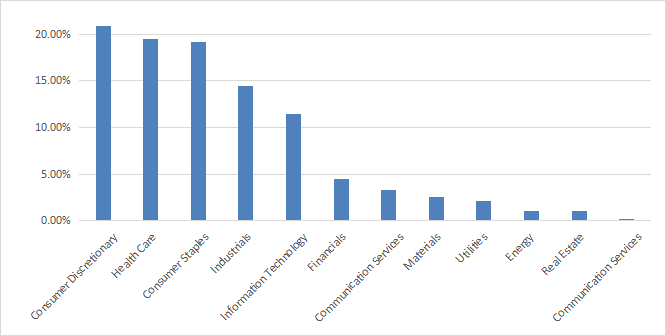
The fund has over 200 holdings, but it is quite concentrated in the top names. The top 10 holdings, listed below with some fundamental ratios, represent over 39% of asset value. The heaviest one is Bernard Arnault’s luxury group LVMH, with a weight over 6%.
US Ticker | Held Ticker | Name | Weight | EPS growth %TTM | P/E TTM | P/E fwd | Yield% |
MC FP | LVMH Moet Hennessy Louis Vuitton SE | 6.38% | 4.47 | 32.64 | 26.36 | 1.35 | |
ULVR LN | Unilever PLC | 4.54% | 12.32 | 17.53 | 19.26 | 3.29 | |
NOVN SW | Novartis AG | 4.39% | -69.76 | 31.54 | 15.35 | 3.39 | |
NESN SW | Nestle S.A. | 4.13% | -46.04 | 35.70 | 23.05 | 2.49 | |
GSK LN | GSK Plc | 3.88% | 138.28 | 4.40 | 9.93 | 3.82 | |
ITX SM | Industria de Diseno Textil | 3.88% | 13.05 | 24.75 | N/A | 3.27 | |
NOVOB DC | Novo Nordisk A/S | 3.33% | 12.82 | 45.09 | 33.45 | 1.03 | |
OR FP | L'Oreal S.A. | 3.00% | 15.36 | 40.64 | 34.64 | 1.44 | |
SAP GY | SAP SE | 2.94% | -63.51 | 73.43 | 23.04 | 1.66 | |
ROG SW | Roche Holding AG | 2.73% | -9.05 | 19.46 | 14.64 | 3.22 |
Past performance compared to competitors
The next chart plots the total return of IQDG and four non-hedged international dividend growth ETFs:
- Invesco International Dividend Achievers ETF (PID), reviewed here,
- Vanguard International Dividend Appreciation ETF (VIGI), reviewed here,
- WisdomTree Global ex-U.S. Quality Dividend Growth (DNL), reviewed here,
- iShares International Dividend Growth ETF (IGRO), reviewed here.
The chart starts on 6/1/2016 to match all inception dates.
IQDG vs competitors since June 2016 (Seeking Alpha)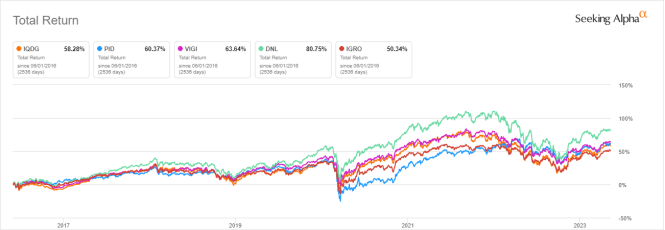
IQDG is in the middle of the pack and lags DNL by a significant margin. However, it has been the best performer in the last 12 months:
IQDG vs competitors, last 12 months (Seeking Alpha)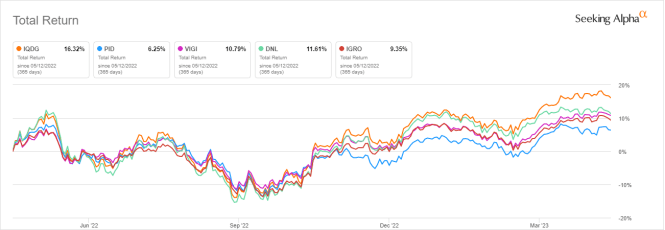
The annual sum of distributions has increased from $0.52 to $1.28 per share between 2017 and 2022 (source: Seeking Alpha). It is a 146% growth in 5 years, while the cumulative inflation has been about 20% (based on CPI). IQDG has been excellent regarding distribution growth, even if the strategy doesn’t look for dividend-growth stocks.
Takeaway
WisdomTree International Quality Dividend Growth Fund holds 249 global dividend stocks with quality and growth characteristics. The strategy is not focused on “dividend growth” stocks, albeit distribution history shows it has been an excellent dividend grower. The fund is well-diversified across countries and sectors, but it is quite concentrated in its top 10 holdings (39% of asset value). Europe represents 80% of assets. The top 3 countries are Switzerland, the U.K. and France. Historical performance is average among competitors, but it has outperformed in the last 12 months.
Editor's Note: This article discusses one or more securities that do not trade on a major U.S. exchange. Please be aware of the risks associated with these stocks.
Quantitative Risk & Value (QRV) features data-driven strategies in stocks and closed-end funds outperforming their benchmarks since inception. Get started with a two-week free trial now.

This article was written by

Step up your investing experience: try Quantitative Risk & Value for free now (limited offer).
I am an individual investor and an IT professional, not a finance professional. My writings are data analysis and opinions, not investment advice. They may contain inaccurate information, despite all the effort I put in them. Readers are responsible for all consequences of using information included in my work, and are encouraged to do their own research from various sources.
Analyst’s Disclosure: I/we have no stock, option or similar derivative position in any of the companies mentioned, and no plans to initiate any such positions within the next 72 hours. I wrote this article myself, and it expresses my own opinions. I am not receiving compensation for it (other than from Seeking Alpha). I have no business relationship with any company whose stock is mentioned in this article.
Seeking Alpha's Disclosure: Past performance is no guarantee of future results. No recommendation or advice is being given as to whether any investment is suitable for a particular investor. Any views or opinions expressed above may not reflect those of Seeking Alpha as a whole. Seeking Alpha is not a licensed securities dealer, broker or US investment adviser or investment bank. Our analysts are third party authors that include both professional investors and individual investors who may not be licensed or certified by any institute or regulatory body.