TORM Plc: A Near-Term Energy Transportation Capital Gains Prospect

Summary
- Coming share prices are the primary interest of all investors, driven by the biggest, best-informed, and most insistent of them, institutions, as revealed by their market actions.
- Evaluating how attractive each stock’s coming upside and downside price change prospects maybe requires a sense of its likely future compared to its past – and to the pasts.
- Records kept of coming price expectations and market outcomes daily over decades suggest – not promise – what TORM plc has offered under conditions viewed like today’s.
Pgiam/iStock via Getty Images
The primary focus of this article is Torm plc. (NASDAQ:TRMD).
Investment Thesis
When your investment portfolio is "duck hunting" for better holdings, if "birds of a feather"... you better line up a duck flyway for targets. Fortunately, world equity markets have ample places to monitor, including dozens of well-populated target havens.
That makes knowing what may provide portfolio satisfaction target-wise a first step even before getting to the descriptive articles stage. In the energy investing arena, significant competencies exist between upstream and downstream, services and equipment.
21st Century paces of change in technology and rational behavior (not of emotional reactions) seriously disrupt the commonly accepted productive investment strategy of the 20th century.
One required change is the shortening of forecast horizons, with a shift from the multi-year passive approach of buy & hold to the active strategy of specific price-change target achievement or time-limit actions, with reinvestment set to new nearer-term targets.
That change avoids the irretrievable loss of invested time spent destructively by failure to recognize shifting evolutions like the cases of IBM, Kodak, GM, Xerox, GE, and many others.
It recognizes the progress in medical, communication, and information technologies and enjoys its operational benefits already present in extended lifetimes, trade-commission-free investments, and coming benefits in transportation utilization and energy usage.
But it requires the ability to make valid direct comparisons of value between investment reward prospects and risk exposures in the uncertain future. Since uncertainty expands as the future dimension increases, shorter forecast horizons are a means of improving the reward-to-risk comparison.
That shortening is now best attended at the investment entry point by knowing Market-Maker expectations for coming prices. When reached, their updates are then reintroduced at the exit/reinvestment point and the term of expectations for the required coming comparisons are recognized as the decision entry point to move forward.
We employ arbitrage science to determine the MM community's near-term price expectations limits as a continuing measure of the balance between market-price prospective risk and reward. Then monitor subsequent actual market performance to identify opportunities.
For investments guided by this article or by others, target sell prices will always be found here as the high price in the MM forecast range.
Description of Equity Subject Company
TORM plc, a product tanker company, engages in the transportation of refined oil products and crude oil worldwide. It operates in two operating segments, Tanker and Marine Exhaust. The company transports gasoline, jet fuel, naphtha, and gas oil, as well as dirty petroleum products, such as fuel oil. It also engages in developing and producing advanced and green marine equipment. The company was founded in 1889 and is based in London, the United Kingdom."
Source: Yahoo Finance
Yahoo Finance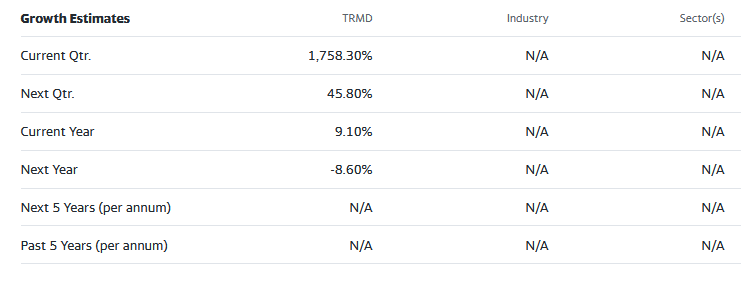
These growth estimates have been made by and are collected from Wall Street analysts to suggest what conventional methodology currently produces. The typical variations across forecast horizons of different time periods illustrate the difficulty of making value comparisons when the forecast horizon is not clearly defined.
Risk and Reward Balances Among Energy Developer Competitors
Figure 1
blockdesk.com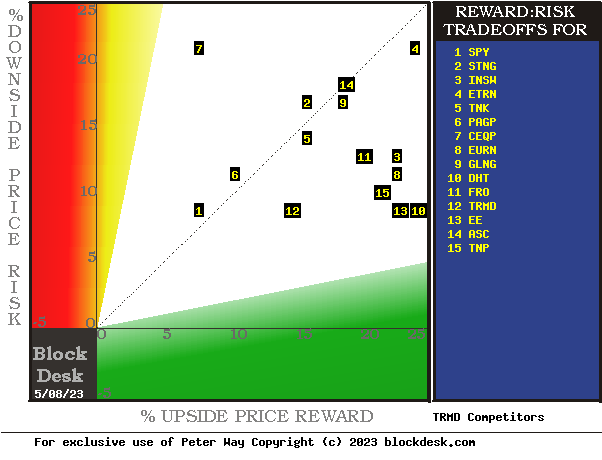
All of the forecasts in Figure 1 are dependent upon are based on coming price expectations of the companies involved in each one's circumstances like those previously in a balance like those seen today.
The risk dimension is of actual price drawdowns at their most extreme point while being held in previous pursuit of upside rewards similar to the ones currently being seen. They are measured on the red vertical scale. Reward expectations are measured on the green horizontal scale.
Both scales are of percent change from zero to 25%. Any stock or ETF whose present risk exposure exceeds its reward prospect will be above the dotted diagonal line. Capital-gain-attractive to-buy issues are in the directions down and to the right.
Our principal interest is in TRMD at location [12], central to the lowest risk exposures and middle of the reward horizontal scale. A "market index" norm of reward~risk tradeoffs is offered by SPY at [1], just above dotted diagonal at the same vertical Risk scale as TRMD but with shrimp Reward prospect. Most appealing by this Figure 1 view for wealth-building investors may be DHT at [10].
Comparable features of Energy Provider Competitors
The Figure 1 map provides a good visual comparison of the two most important aspects of every equity investment in the short term. There are other aspects of comparison that this map sometimes does not communicate well, particularly when general market perspectives like those of SPY are involved. Where questions of "how likely' are present other comparative tables, like Figure 2, may be useful.
Yellow highlighting of the table's cells emphasizes factors important to securities valuations and the security TRMD, the most promising of near capital gain as ranked in column [R].
Figure 2
blockdesk.com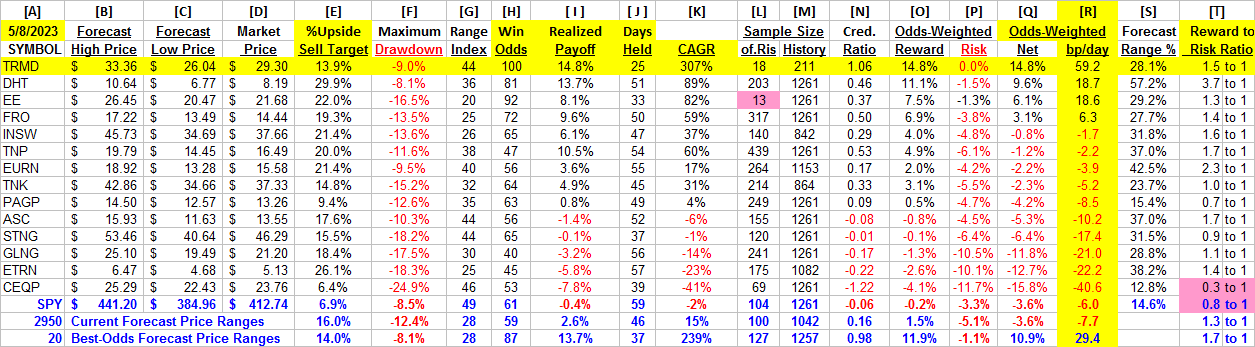
Why do All This Math?
Figure 2's purpose is to attempt universally comparable answers, stock by stock, of a) How BIG the prospective price gain payoff may be, b) how LIKELY the payoff will be a profitable experience, c) how SOON it may happen, and d) what price drawdown RISK may be encountered during its active holding period.
Readers familiar with our analysis methods after a quick examination of Figure 2 may wish to skip to the next section viewing price range forecast trends for TRMD.
Column headers for Figure 2 define investment-choice preference elements for each row stock whose symbol appears at the left in column [A]. The elements are derived or calculated separately for each stock, based on the specifics of its situation and current-day MM price-range forecasts. Data in red numerals are negative, usually undesirable to "long" holding positions. Table cells with yellow fills are of data for the stocks of principal interest and of all issues at the ranking column, [R]. Pink fills suggest abnormal or undesirable statistics.
The price-range forecast limits of columns [B] and [C] get defined by MM hedging actions to protect firm capital required to be put at risk of price changes from volume trade orders placed by big-$ "institutional" clients.
[E] measures potential upside risks for MM short positions created to fill such orders, and reward potentials for the buy-side positions so created. Prior forecasts like the present provide a history of relevant price draw-down risks for buyers. The most severe ones actually encountered are in [F], during holding periods in effort to reach [E] gains. Those are where buyers are emotionally most likely to accept losses.
The Range Index [G] tells where today's price lies relative to the MM community's forecast of upper and lower limits of coming prices. Its numeric is the percentage proportion of the full low to high forecast seen below the current market price.
[H] tells what proportion of the [L] sample of prior like-balance forecasts have earned gains by either having the price reach its [B] target or be above its [D] entry cost at the end of a 3-month max-patience holding period limit. [ I ] gives the net gains-losses of those [L] experiences.
What makes TRMD most attractive in the group at this point in time is its ability to produce capital gains most consistently at its present operating balance between share price risk and reward at the Range Index [G]. At a RI of 44, today's price is near the middle of its forecast range, with price expectations to the upside about equal to the downside. Not our expectations, but those of Market-Makers acting in support of Institutional Investment organization clients building the values of their typical multi-billion-$ portfolios.
Further Reward~Risk tradeoffs involve using the [H] odds for gains with the 100 - H loss odds as weights for N-conditioned [E] and for [F], for a combined-return score [Q]. The typical position holding period [J] on [Q] provides a figure of merit [fom] ranking measure [R] useful in portfolio position preferencing. Figure 2 is row-ranked on [R] among alternative candidate securities, with TRMD in top rank.
Along with the candidate-specific stocks these selection considerations are provided for the averages of some 3,000 stocks for which MM price-range forecasts are available today, and 20 of the best-ranked (by fom) of those forecasts, as well as the forecast for S&P 500 Index ETF (SPY) as an equity-market proxy.
Current-market index SPY is moderately non-competitive as an investment alternative. Its Range Index of 49 indicates half of its forecast range is to the upside, while about five-eighths of previous SPY forecasts at this range, index produced profitable outcomes.
As shown in column [T] of figure 2, the levels vary significantly between stocks. What matters is the net gain between investment gains and losses actually achieved following the forecasts, shown in column [I]. The Win Odds of [H] tell what proportion of the Sample RIs of each stock were profitable. Odds below 80% often have proven to lack reliability. All of TRMD's 18 RIs at 44 in the past year have been profitable under our standard risk-management discipline.
Recent Forecast Trends of the Primary Subject
Figure 3
blockdesk.com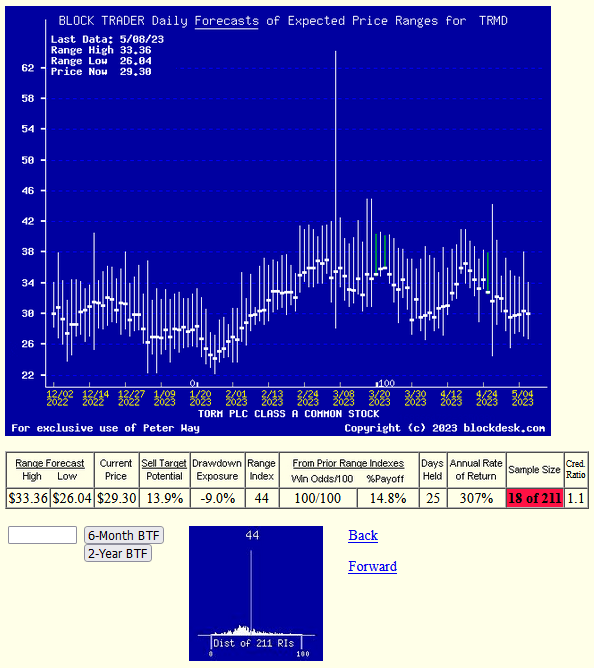
Many investors confuse any time-repeating picture of stock prices with typical "technical analysis charts" of past stock price history. These are quite different in their content. Instead, here Figure 3's vertical lines are a daily-updated visual record of price range forecast limits expected in the coming few weeks and months. The heavy dot in each vertical is the stock's closing price on the day the forecast was made.
That market price point makes an explicit definition of the price reward and risk exposure, expectations that were held by market participants at the time. This is a visual display of their vertical balance between risk and reward.
The measure of that balance is the Range Index (RI).
With today's RI of 44, TRMD has a 14% upside price change in prospect. Of the prior 18 forecasts like today's RI, all have been profitable. The market's actions of TRMD prior forecasts became accomplishments of +14.8% gains in 25 market days., or 5 weeks. So history's advantage could be repeated ten times or more in a 252 market-day year, which compounds into a CAGR of +307%.
Also please note the smaller low picture in Figure 3. It shows the past year's distribution of Range Indexes with the current level visually marked. For TRMD the most recent past forecasts have been of higher prices and Range Indexes.
Conclusion
Based on direct comparisons with TRMD and other Energy transporter competitors, there are strong wealth-building reasons to prefer a capital-gain-seeking buy in Torm plc. over other examined alternatives.
This article was written by

Analyst’s Disclosure: I/we have no stock, option or similar derivative position in any of the companies mentioned, but may initiate a beneficial Long position through a purchase of the stock, or the purchase of call options or similar derivatives in TRMD over the next 72 hours. I wrote this article myself, and it expresses my own opinions. I am not receiving compensation for it (other than from Seeking Alpha). I have no business relationship with any company whose stock is mentioned in this article.
Additional disclosure: Peter Way and generations of the Way Family are long-term providers of perspective information, earlier helping professional investors and now individual investors, discriminate between wealth-building opportunities in individual stocks and ETFs. We do not manage money for others outside of the family but do provide pro bono consulting for a limited number of not-for-profit organizations. We firmly believe investors need to maintain skin in their game by actively initiating commitment choices of capital and time investments in their personal portfolios. So our information presents for D-I-Y investor guidance what the arguably best-informed professional investors are thinking. Their insights, revealed through their own self-protective hedging actions, tell what they believe is most likely to happen to the prices of specific issues in coming weeks and months. Evidences of how such prior forecasts have worked out are routinely provided, both on blockdesk.com and on our Seeking Alpha Contributor website. . Pls see SA articles numbered 1495621 and 1936131.
Seeking Alpha's Disclosure: Past performance is no guarantee of future results. No recommendation or advice is being given as to whether any investment is suitable for a particular investor. Any views or opinions expressed above may not reflect those of Seeking Alpha as a whole. Seeking Alpha is not a licensed securities dealer, broker or US investment adviser or investment bank. Our analysts are third party authors that include both professional investors and individual investors who may not be licensed or certified by any institute or regulatory body.