SDS: Added To Our Model Portfolio (Technical Analysis)

Summary
- This is a technical analysis article. As the debt ceiling game plays out, we think the market goes down, so we have used excess cash in our Model Portfolio to swing trade using the SDS.
- As you know, the SDS goes up when the SPY goes down. We think the sell signal on the Point & Figure chart below means the SPY is going down.
- Besides the debt ceiling, we see the banking crisis and the Fed holding rates high, for longer, as additional forces depressing an already depressed market.
- We think the good news is over on the earnings front, at least for the mega caps that move the SPY.
- It is also “sell in May and go away” time. The market is ignoring the Fed, high-interest rates, Ukraine, and Taiwan. That will change.
- This idea was discussed in more depth with members of my private investing community, Daily Index Beaters. Learn More »
Tim Robberts
As the SPDR S&P 500 ETF (SPY) goes down, the ProShares UltraShort S&P 500 (NYSEARCA:SDS) goes up. We use excess cash in the Model Portfolio to swing trade a falling market by adding the SDS. As you can see on the chart below, we expect the market to fall because there is a Sell Signal on the SPY chart and a Buy Signal on the SDS chart.
The negative factors pounding the market down:
1) Continued high interest rates by the Fed. This policy lacks traction short term, but longer term it will bring the economy down and increase unemployment. It will bring on a recession.
2) End of the earnings season, with the good news over for the mega caps that rule the SPY. The technology stocks have had a nice technical bounce off the bottom, but a recession will force many to revisit that bottom. No growth means lower prices for stocks and lower PEs. Overvalued stocks go down in a recession.
3) Inflation continues to drop slightly, while the inflation rate remains very high, forcing the Fed to keep interest rates high for longer. Compared to former Fed Chairman Volcker, 5% interest rates are nowhere near the top of the range. But Powell will not do a Volcker.
4) The banking crisis continues. There will be more failing banks and each one will make headlines. I worked for a bank and they are not the smartest people in the room. They really do need to be supervised by regulators and somehow that supervision just failed.
5) The debt ceiling crisis results in default. The market thinks that it is possible that the government will default. I don't think even politicians would be that dumb. No matter, I still think the threat takes the market down short term. So we are using excess cash in our Model Portfolio for a swing trade using the SDS. We will close the position before the debt ceiling is raised.
6) It is "Sell in May and go away" time the market as we start the worst six months in the market according to the "Stock Trader's Almanac" which I use every day. Portfolio managers are set for this year, except for selling stocks when earnings blowup or the market crashes and there are redemptions. A hard landing recession will do the same.
The positive factors keeping the market up:
1) The economy is still good. The MEME attitude for the October bounce is to enjoy the great economy until you see the end coming. The market is still using rose colored glasses, enjoying the good economy, consumer spending and the lack of traction by high interest rates. The high interest rates are not working because of the hot jobs market. This October bounce in a bear market still does not see a recession coming. When it does, it will drop to the bottom again.
2) Consumers spending and traveling despite increases in prices. When the consumer has a job and plenty of money to spend, it can overlook the higher prices.
3) The hot jobs market is creating low unemployment. The hallmark of a recession is increasing unemployment. Instead we have a hot jobs market and pay increases making the consumer "fat and happy." The politicians want to keep it that way to get re-elected.
4) The market does not see a recession coming, yet. When it does, it will drop like a building being demolished. The market will not drop until it has a reality check like increased unemployment, falling corporate earnings or an exogenous factor like an expanding war or new war. Failure to increase the debt ceiling would do the same.
Here is our Point & Figure chart for the SPY. On the far right is a column of dropping "Os" created by the recent drop in prices. This is the Sell Signal that is driving our decision to add SDS to the Model Portfolio using excess cash for swing trades. Notice the bearish double top created by the two columns of "Xs" at $416. (The 4 and 5 stand for April and May but are really Xs.)
SPY Sell Signal Column of "Os" Falling Because Price Dropped. (StockCharts.com)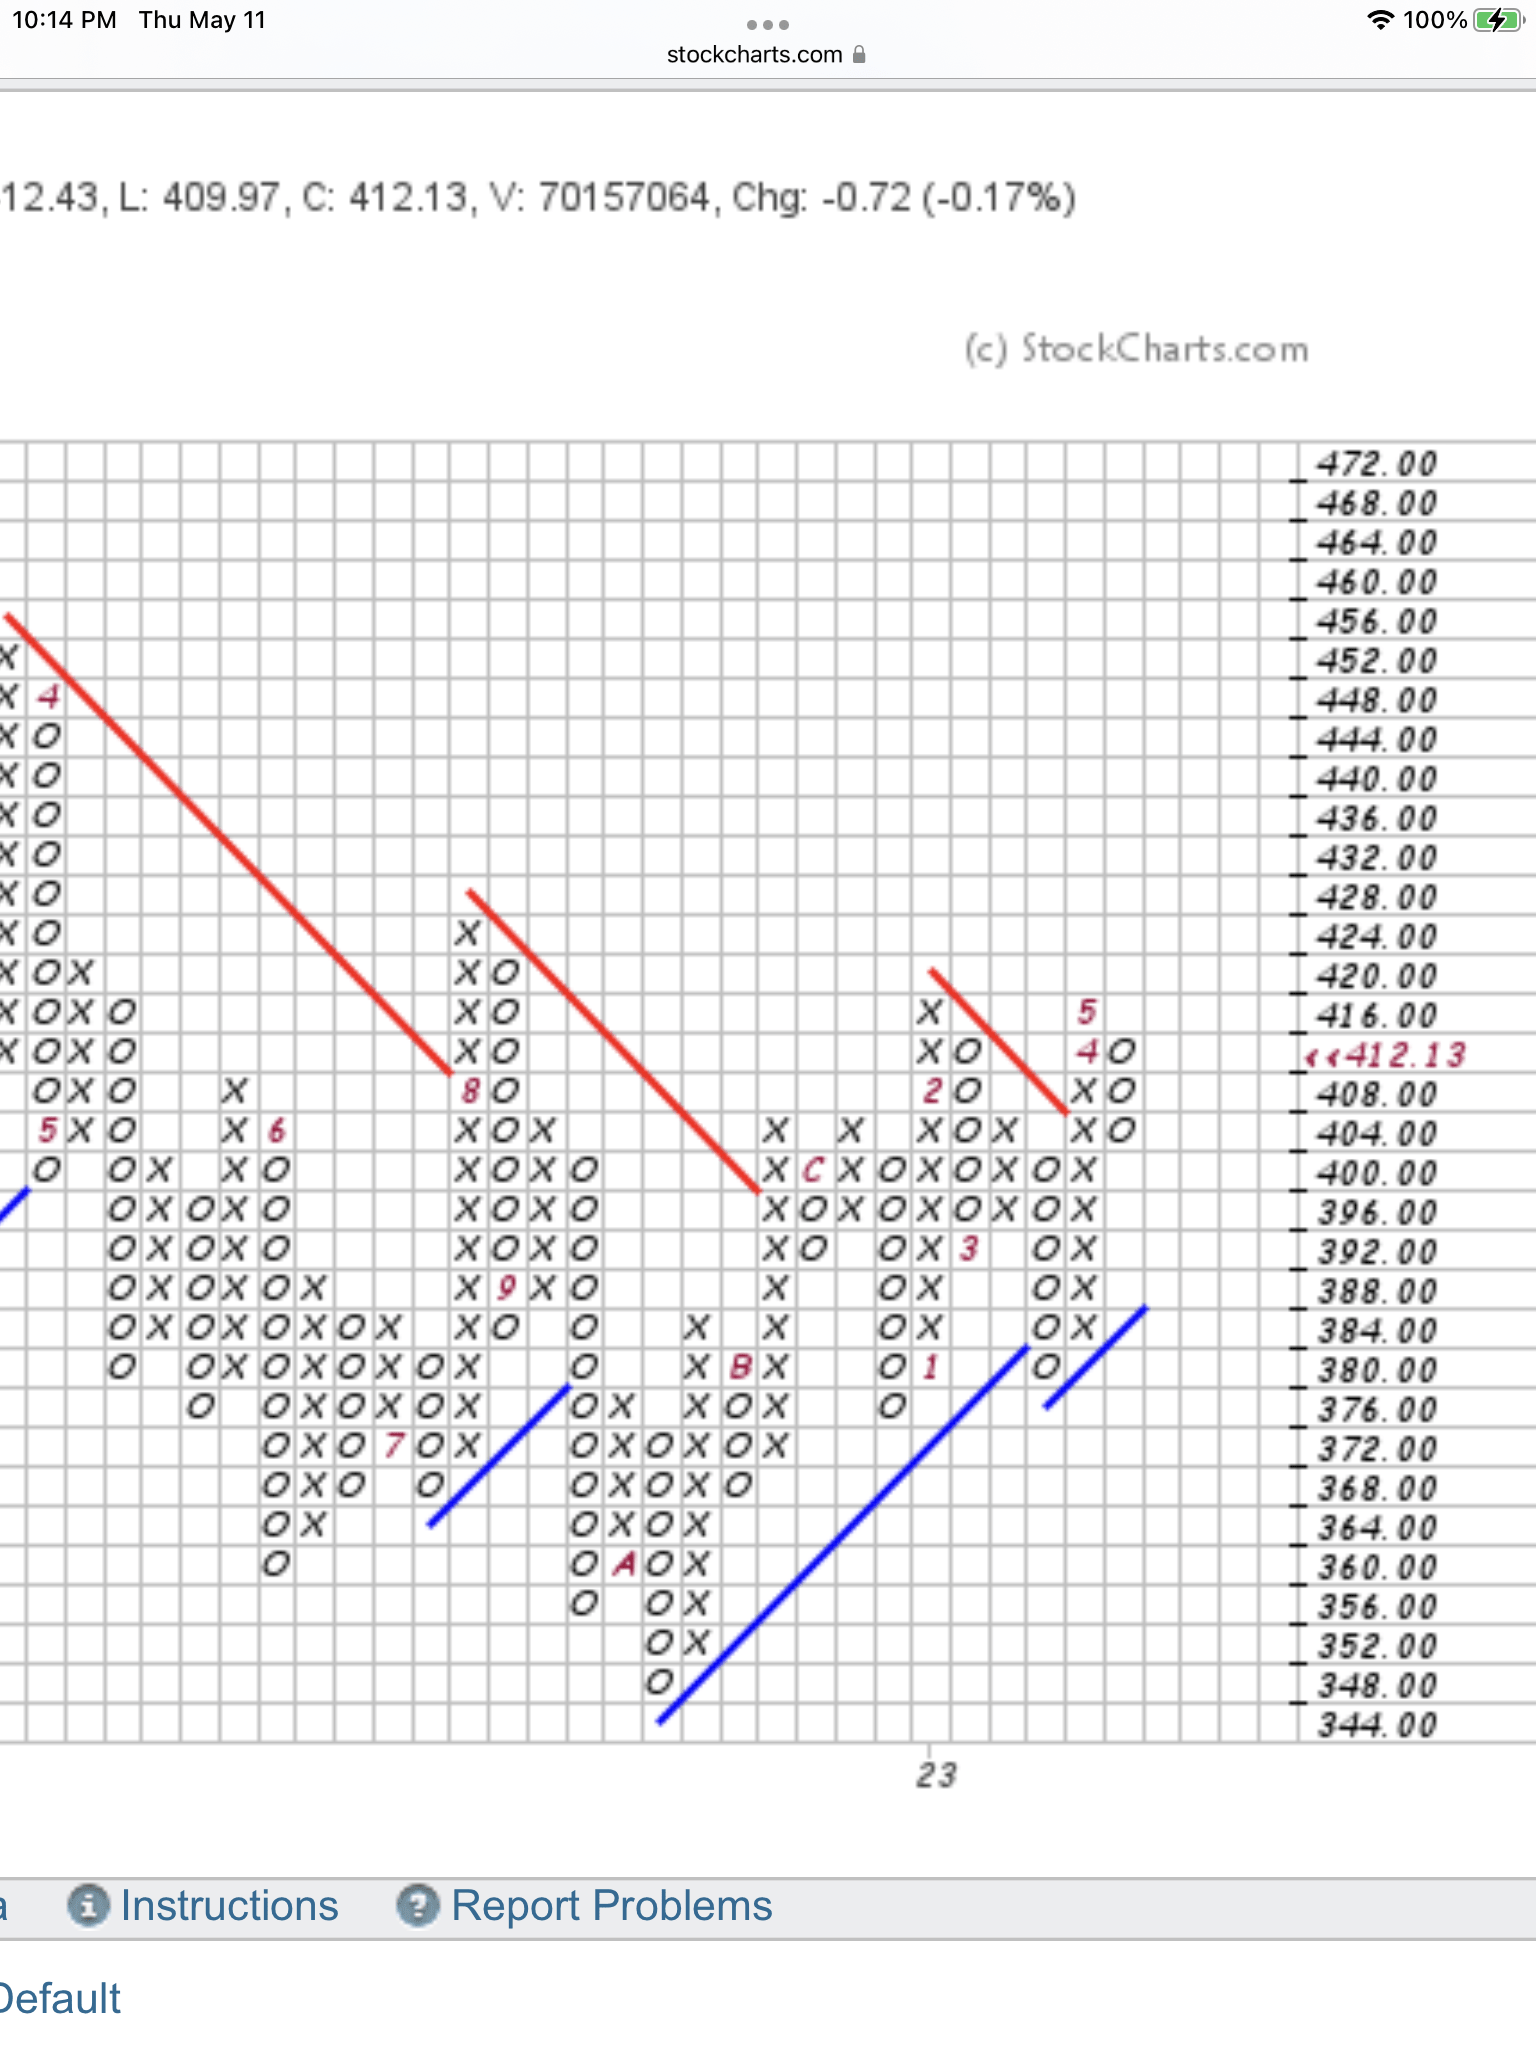
As a result in the SPY dropping, we expect the SDS to go up. Price has started rising and we have drawn a blue, vertical line, Buy Signal on the chart. Here is our daily SDS chart:
SDS Starts Its Bounce (StockCharts.com)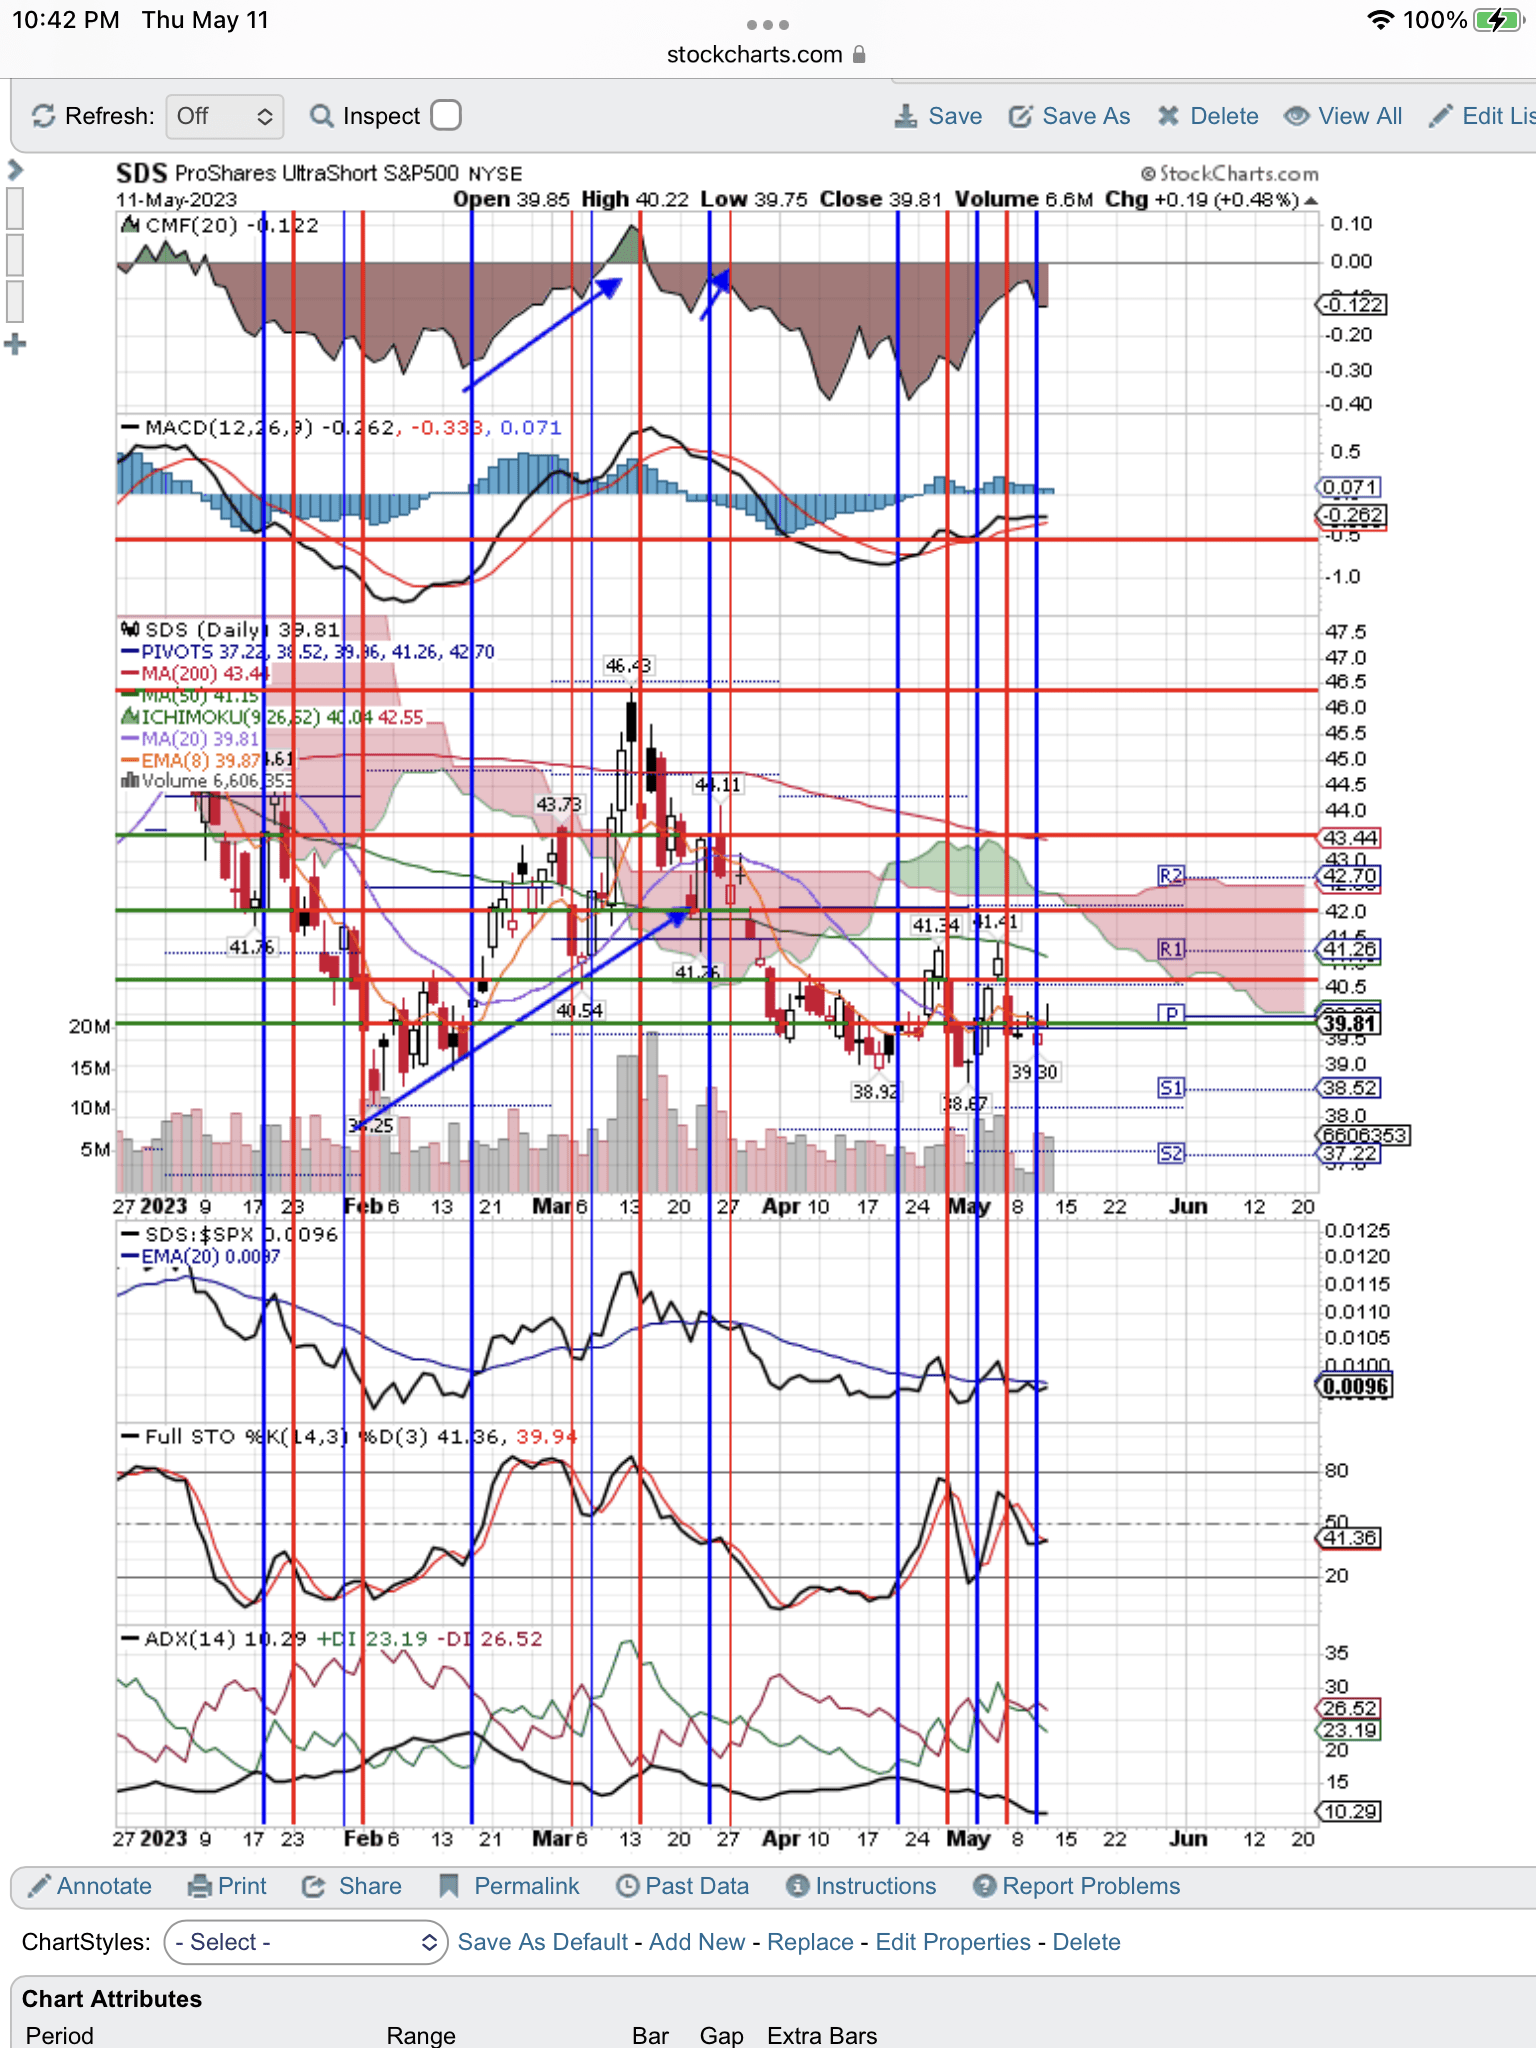

Use our free, 30-day training program to become a successful trader or investor. Join us on Zoom to discuss your questions.
This article was written by

Tom’s book "Successful Stock Signals for Traders and Portfolio Managers" is available on StockCharts.com and Amazon. The StocksInDemand.com system is designed to make money using a combined fundamental and technical grade for each stock. Tom received his MBA in Accounting from St. John's University, where he taught courses on the stock market. He marketed fundamental research, technical research and quantitative research to professional portfolio managers during his Wall St. career.
Analyst’s Disclosure: I/we have a beneficial short position in the shares of SPY either through stock ownership, options, or other derivatives. I wrote this article myself, and it expresses my own opinions. I am not receiving compensation for it (other than from Seeking Alpha). I have no business relationship with any company whose stock is mentioned in this article.
Disclaimer: We are not investment advisers and we never recommend stocks or securities. Nothing on this website, in our reports and emails or in our meetings is a recommendation to buy or sell any security. Options are especially risky and most options expire worthless. You need to do your own due diligence and consult with a professional financial advisor before acting on any information provided on this website or at our meetings. Our meetings and website are for educational purposes only. Any content sent to you is sent out as any newspaper or newsletter, is for educational purposes and never should be taken as a recommendation to buy or sell any security. The use of terms buy, sell or hold are not recommendations to buy sell or hold any security. They are used here strictly for educational purposes. Analysts price targets are educated guesses and can be wrong. Computer systems like ours, using analyst targets therefore can be wrong. Chart buy and sell signals can be wrong and are used by our system which can then be wrong. Therefore you must always do your own due diligence before buying or selling any stock discussed here. Past results may never be repeated again and are no indication of how well our SID score Buy signal will do in the future. We assume no liability for erroneous data or opinions you hear at our meetings and see on this website or its emails and reports. You use this website and our meetings at your own risk.
Seeking Alpha's Disclosure: Past performance is no guarantee of future results. No recommendation or advice is being given as to whether any investment is suitable for a particular investor. Any views or opinions expressed above may not reflect those of Seeking Alpha as a whole. Seeking Alpha is not a licensed securities dealer, broker or US investment adviser or investment bank. Our analysts are third party authors that include both professional investors and individual investors who may not be licensed or certified by any institute or regulatory body.