FTQI: 11.8% Yield With A Caveat

Summary
- First Trust Nasdaq BuyWrite Income ETF holds 150 stocks of the Nasdaq Composite and sells calls on the Nasdaq 100 to generate income.
- The fund has lagged its competitors since inception.
- It has fulfilled its primary objective of providing income, but the current yield is an outlier.
- The share price has been unable to keep pace with inflation.
- Quantitative Risk & Value members get exclusive access to our real-world portfolio. See all our investments here »
AlessandroPhoto
FTQI strategy and portfolio
First Trust Nasdaq BuyWrite Income ETF (NASDAQ:FTQI) is an actively managed fund launched on 1/6/2014. It currently holds a portfolio of 150 stocks and shorts 5 call options on the Nasdaq 100 index. It has a very attractive 12-month distribution yield of 11.78% and an expense ratio of 0.85%. Distributions are paid monthly.
As described by First Trust, "The Fund's investment objective is to provide current income. The Fund will pursue its investment objective by investing primarily in equity securities listed on U.S. exchanges and by utilizing an "option strategy" consisting of writing (selling) U.S. exchange-traded covered call options on the Nasdaq-100 Index." FTQI invests at least 80% of its net assets in the components of the Nasdaq Composite Index. The call options generally have a notional value of 50% to 100% of the fund's assets. The collected option premiums are distributed to shareholders. In certain market conditions, the fund may sell a call and buy calls with a higher strike price in order to retain some upside performance. As of writing, options expire in May and June with strike prices between NQ 12750 and 13250.
FTQI invests almost exclusively in U.S.-based companies (about 97% of asset value). Compared to the Nasdaq 100 Index (QQQ), the fund underweights technology, which remains the heaviest sector (52.4% of asset value). It is also lighter in consumer discretionary and industrials. It overweights mostly communication, consumer staples, health care, financials and real estate. It ignores energy.
Sector breakdown (Chart: author; data: First Trust, Invesco)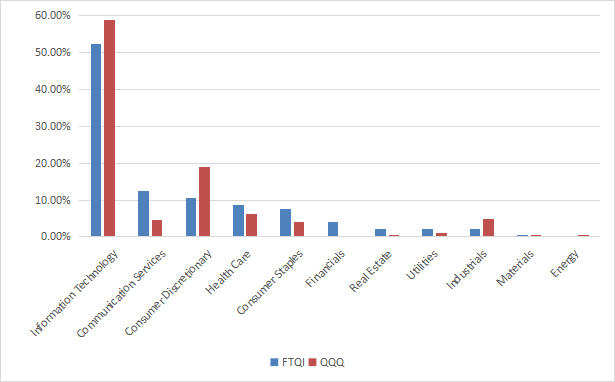
FTQI and QQQ are very close regarding valuation ratios, as reported in the next table.
FTQI | QQQ | |
Price/earnings TTM | 27.95 | 28.15 |
Price/book | 6.22 | 6.49 |
Price/sales | 3.78 | 4.16 |
Price/cash flow | 19.69 | 19.24 |
Data: Fidelity
The top 10 companies, listed below with fundamental metrics, represent 48.8% of asset value. For convenience, the two stock series of Alphabet are grouped in the same line of the table. The top two holdings, Apple and Microsoft, weigh about 24.5% together. Risks related to other individual companies are moderate.
Ticker | Name | Weight | EPS growth %TTM | P/E TTM | P/E fwd | Yield% |
Apple, Inc. | 13.29% | -4.33 | 29.49 | 29.10 | 0.55 | |
Microsoft Corp. | 11.20% | -3.75 | 33.85 | 32.48 | 0.87 | |
NVIDIA Corp. | 4.49% | -54.71 | 165.87 | 63.46 | 0.06 | |
Alphabet, Inc. | 4.11% | -19.87 | 25.23 | 20.81 | 0 | |
PepsiCo, Inc. | 3.48% | -35.10 | 40.93 | 26.54 | 2.60 | |
Amazon.com, Inc. | 3.27% | -80.11 | 267.26 | 70.50 | 0 | |
Meta Platforms, Inc. | 2.70% | -39.04 | 28.91 | 19.97 | 0 | |
Broadcom Inc. | 2.22% | 67.70 | 21.29 | 15.13 | 2.94 | |
Tesla, Inc. | 2.07% | 38.35 | 49.59 | 50.10 | 0 | |
Costco Wholesale Corp. | 1.96% | 9.73 | 36.72 | 34.66 | 0.82 |
Historical performance
The next chart plots total returns since February 2014 of FTQI and four other ETFs implementing buy-write strategies (buying stocks and selling call options):
- Global X NASDAQ 100 Covered Call ETF (QYLD),
- Global X S&P 500 Covered Call ETF (XYLD),
- Invesco S&P 500 BuyWrite ETF (PBP),
- First Trust BuyWrite Income ETF (FTHI).
FTQI vs competitors since Feb. 2014 (Seeking Alpha)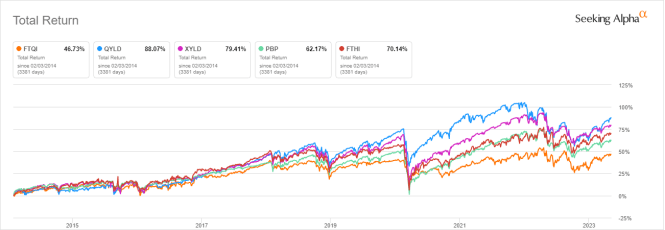
FTQI has underperformed its competitors by a significant margin. For the same period, the total return of the Nasdaq 100 is 6.7 times higher: 314.6% vs. 46.7%. However, in the last 12 months, FTQI has beaten XYLD and PBP (next chart).
FTQI vs competitors and SPY, last 12 months (Seeking Alpha)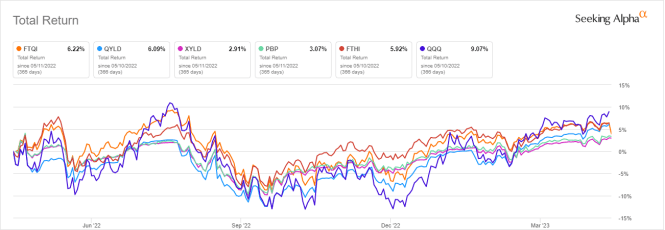
The chart below plots FTQI share price since inception: It is close to break-even (-3.35% in 9 years). At the same time, the cumulative inflation has been about 28%, based on CPI. Even without significant capital decay, it represents a significant loss in inflation-adjusted value.
FTQI share price without dividends ( Seeking Alpha)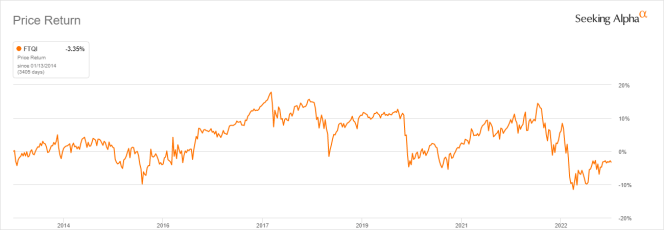
Collected option premiums may vary depending on market conditions. It seems the management tries to keep distributions as constant as possible: Their annual sum has been quite stable between $0.63 and $0.70 per share between 2015 and 2021. Then, they jumped to $1.78 in 2022. Based on historical data, last year looks like an outlier: This 11%+ yield is unlikely to be sustainable in the long run. If the management decides to maintain this rate, distributions may come with some return of capital.
FTQI distribution history ( Seeking Alpha)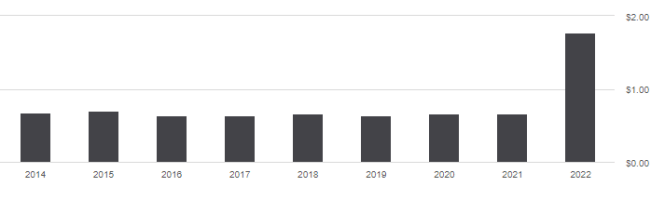
Takeaway
First Trust Nasdaq BuyWrite Income ETF holds 150 stocks of the Nasdaq Composite and sells short-term call options on the Nasdaq 100 index to generate income. It has lagged its competitors since inception and even more the Nasdaq 100. It did a bit better in the last 12 months. FTQI has fulfilled its primary objective of providing income, but the current trailing yield of almost 12% is an outlier in the fund's distribution history. It is unlikely to be sustained in the future. As for the secondary objective of capital appreciation, the fund has not suffered significant capital decay since inception, but it has been unable to keep pace with inflation.
Bonus: How to keep pace with inflation
Many high-yield ETFs and closed-end funds suffer from capital and income decay in inflation-adjusted value. However, it may be avoided or mitigated by rotational strategies. I designed a 5-factor ranking system in 2016 and monitored its performance during several years. I started publishing the eight best-ranked CEFs in Quantitative Risk & Value (QRV) after the March 2020 meltdown. The list is updated every week. It isn't a model portfolio: Trading the list every week is too costly in spreads and slippage. Its purpose is helping investors find funds with a good entry point. In the table below, I give the hypothetical example of starting a portfolio on 3/25/2020 with my initial "Best 8 Ranked CEFs" list and updating it every 3 months, ignoring intermediate updates. Return is calculated with holdings in equal weight and reinvesting dividends at the beginning of every 3-month period (as of 5/5/2023).
Since 3/25/2020 | Total Return | Annual Return | Drawdown | Sharpe ratio | Volatility |
Best 8 CEFs quarterly | 124.06% | 29.73% | -20.60% | 1.27 | 20.14% |
YYY | 12.86% | 3.98% | -22.87% | 0.24 | 11.91% |
SPY | 76.43% | 20.11% | -24.50% | 0.93 | 18.95% |
This simulation is not a real portfolio and not a guarantee of future return
Of course, past performance (real or simulated) is not representative of future return. However, I think a time-tested rotational strategy in CEFs has a much better chance to protect both capital and income stream against erosion and inflation than a high-yield ETF.
Quantitative Risk & Value (QRV) features data-driven strategies in stocks and closed-end funds outperforming their benchmarks since inception. Get started with a two-week free trial now.

This article was written by

Step up your investing experience: try Quantitative Risk & Value for free now (limited offer).
I am an individual investor and an IT professional, not a finance professional. My writings are data analysis and opinions, not investment advice. They may contain inaccurate information, despite all the effort I put in them. Readers are responsible for all consequences of using information included in my work, and are encouraged to do their own research from various sources.
Analyst’s Disclosure: I/we have a beneficial long position in the shares of AMZN, GOOGL, META either through stock ownership, options, or other derivatives. I wrote this article myself, and it expresses my own opinions. I am not receiving compensation for it (other than from Seeking Alpha). I have no business relationship with any company whose stock is mentioned in this article.
Seeking Alpha's Disclosure: Past performance is no guarantee of future results. No recommendation or advice is being given as to whether any investment is suitable for a particular investor. Any views or opinions expressed above may not reflect those of Seeking Alpha as a whole. Seeking Alpha is not a licensed securities dealer, broker or US investment adviser or investment bank. Our analysts are third party authors that include both professional investors and individual investors who may not be licensed or certified by any institute or regulatory body.