XHB: A Solid Valuation After The Rally, Eyeing Key Moves On The Chart

Summary
- Domestic homebuilder equities have outperformed the S&P 500 over the last year.
- With a modest forward earnings multiple and encouraging price action, I have a buy on XHB.
- Volatility can sometimes hit during the latter half of Q2, and I spot one key price zone to monitor on the chart.
JackF/iStock via Getty Images
Homebuilder stocks have surged in the last year. Both the SPDR S&P Homebuilders ETF (NYSEARCA:XHB) and the iShares US Home Construction ETF (ITB) are up sharply on an absolute basis and relative to the S&P 500. This alpha comes as demand for new single-family and multi-family homes continues to run strong. What's more, high interest rates make the need for more supply all the more crucial to level out the supply/demand dynamic.
Overall, I have a buy rating on XHB given its valuation and price action trends.
ITB > XHB Due To Weighting Schemes
Stockcharts.com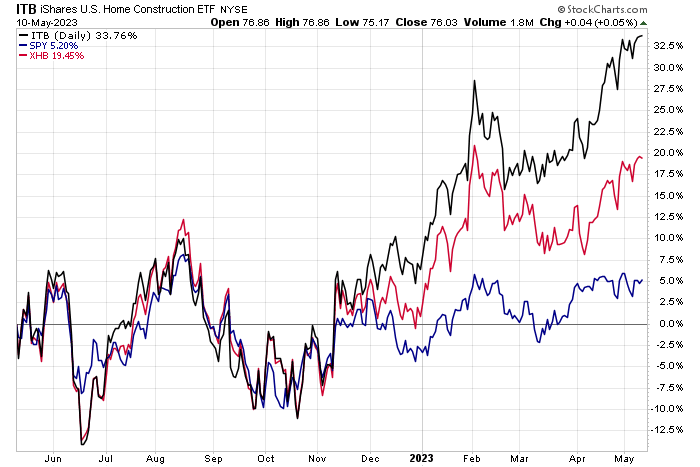
As it stands, US Housing Affordability hovers near the lowest levels since the middle of the 1980s.
US Housing Affordability Remains Poor
Yardeni Research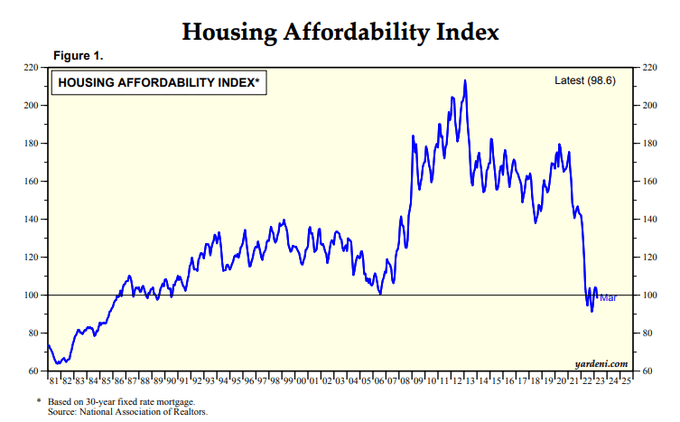
XHB differs from ITB in that it's constructed using a modified equal-weight approach. XHB offers investors exposure to the Building Products, Home Furnishings, Home Improvement Retail, Home furnishing Retail, and Household Appliances sub-industries. The fund launched in January 2006 and features high tradeability given its somewhat modest 0.35% annual expense ratio and 30-day median bid/ask spread of just a single basis point. XHB is a large ETF with just shy of $1 billion in AUM and it holds 35 equities, according to SSGA Funds.
The portfolio's 3-5 year EPS growth rate is listed at 8.7% while the issuer notes the forward price-to-earnings ratio is just 12.6 despite the share price appreciation in the last 52 weeks. The weighted average market cap is about $30 billion - lower than that of ITB. And you can see in the image below from Morningstar that there is ample mid-cap exposure through XHB. The ETF's yield is barely above 1%, however.
According to Morningstar, XHB is indeed more of a homebuilder mid-cap play whereas ITB is large cap focused. The portfolio also leans to the value side on the value-growth spectrum and features solid momentum and quality in its factor profile.
XHB: Portfolio and Factor Profiles
Morningstar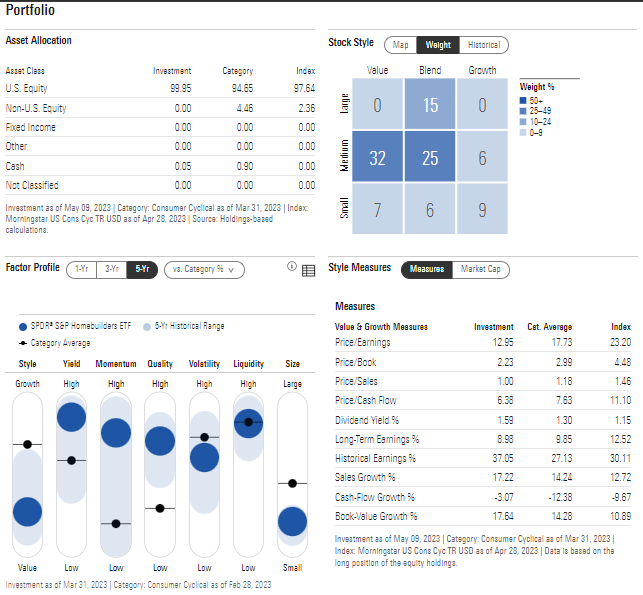
Digging into the portfolio more deeply, you'll see that it's not a precisely equal-weight fund. The components drift based on their performances. Also consider that the portfolio is comprised of equities from both the Consumer Discretionary sector as well as the Industrials sector, so it's a very cyclical fund that should benefit from better economic growth prospects, but a possible H2 recession is an important risk to recognize. Recent price action, however, illustrates that it's more about the unique circumstances within the homebuilding industry.
XHB Top 10 Holdings
SSGA Funds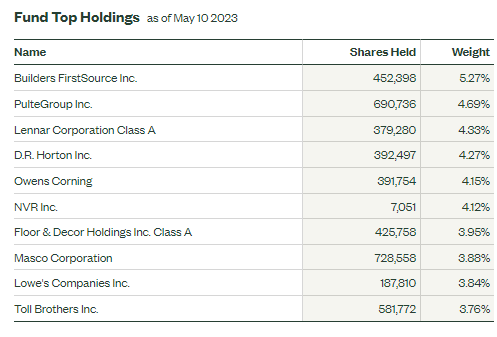
Seasonally, XHB tends to perform poorly now through late June before seeing buyers return to jump start the second half, according to seasonal data from Equity Clock. The back half of the year is often rather strong aside from volatility that has tended to hit from mid-September through early October.
XHB: Some Late Q2 Volatility Sometimes Seen
Equity Clock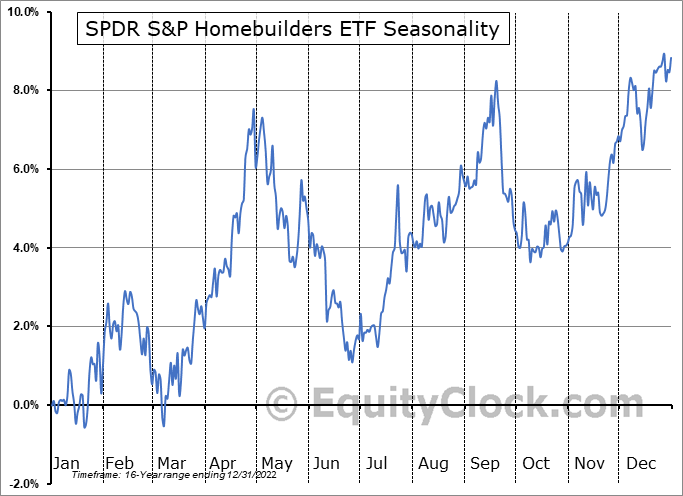
The Technical Take
While XHB has produced negative alpha against ITB over the last year, the former's chart is encouraging. I notice an ongoing bearish to bullish reversal pattern. There was initial resistance in the mid to high $60s, but now I see the $72 to $73 range as being important to break out above. If the chart does make that upside move, then there would be a measured move price objective to near $94 based on the low $50s to low $70s range.
What I like here is that the long-term 200-day moving average is upward sloping, indicating the bulls are in charge. But the recent peak in the RSI momentum index is not all that impressive as the ETF challenges the early 2023 spike high near $73. Overall, I like the technical situation.
XHB: Bullish Rounded Bottom, Some Negative RSI Divergence Potential
Stockcharts.com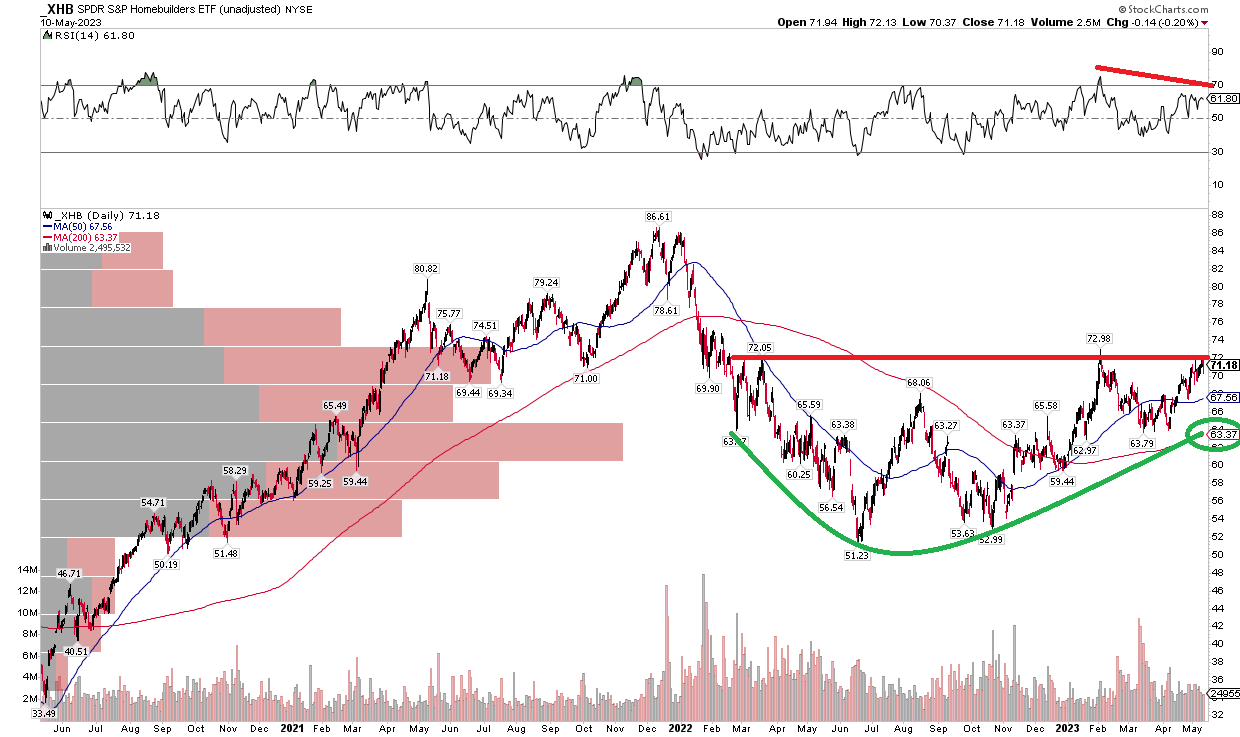
The Bottom Line
With a favorable valuation, reasonable cost, and improved technical picture, I'm a buy on XHB. I'll be watching how the $72 to $73 range plays out in the near term.
This article was written by

Analyst’s Disclosure: I/we have no stock, option or similar derivative position in any of the companies mentioned, and no plans to initiate any such positions within the next 72 hours. I wrote this article myself, and it expresses my own opinions. I am not receiving compensation for it (other than from Seeking Alpha). I have no business relationship with any company whose stock is mentioned in this article.
Seeking Alpha's Disclosure: Past performance is no guarantee of future results. No recommendation or advice is being given as to whether any investment is suitable for a particular investor. Any views or opinions expressed above may not reflect those of Seeking Alpha as a whole. Seeking Alpha is not a licensed securities dealer, broker or US investment adviser or investment bank. Our analysts are third party authors that include both professional investors and individual investors who may not be licensed or certified by any institute or regulatory body.