Hold On To H.B. Fuller As The Economy Improves

Summary
- H.B. Fuller makes and sells industrial and commercial adhesives, sealants, tapes, and labels for packaging goods that are inextricably tied to the nation's economic growth.
- The stock is volatile but reflects the larger market and economic forecasts presenting investors an opportunity to hold until things improve and buy shares on dips and dives.
- The are some risks including more government regulation and downturns in the economic sectors into which Fuller sells: home improvement, construction, specialty chemicals, and building materials.
7postman/E+ via Getty Images
Weakened Company
H.B. Fuller Co (NYSE:FUL) makes and sells industrial supplies; its niche is adhesives, sealants, tapes, and labels for packaging goods. Fuller’s traditional target market industries are home improvement, commercial construction and renovations, specialty chemicals, and building materials.
They are the backbone of America’s growth and prosperity but face strong headwinds over the next year, according to economists. In our opinion, FUL stock is worth holding through times of economic stress that will give way to stronger global and national economies.
Extrinsic conditions lead us to assess the stock with a Hold rating at this time. We suggest it is worth a Buy rating if the shares drop back into the $50s. It happened not long ago and is susceptible to pressures bandied by pessimistic economists.
Quant & Factor Grades (seekingalpha.com/symbol/FUL/ratings/quant-ratings)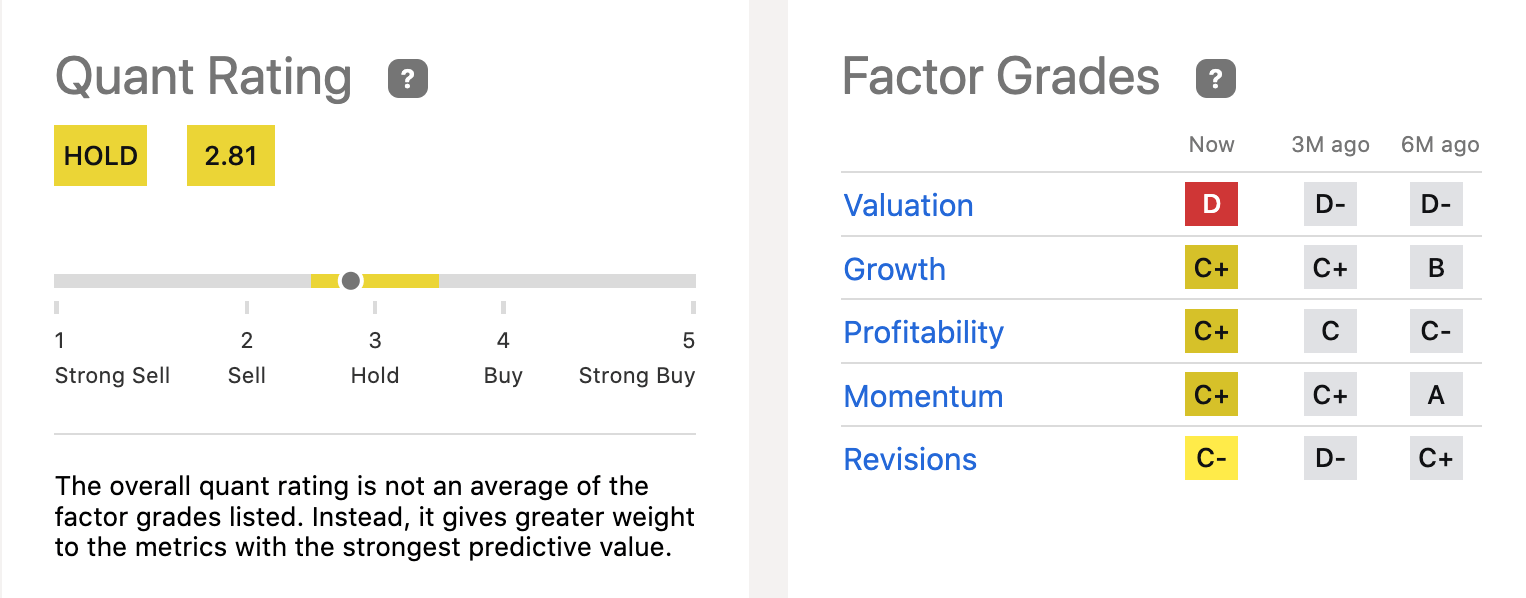
It's the Economy and More
Company numbers are not bad. But
- Pessimistic talk about a weak global and national economic outlook,
- Average Factor Grades from Seeking Alpha including a D grade for valuation holding since April 2022,
- A Hold Quant Rating of the stock in effect since September 2022, plus
- A poor dividend yield of 1.24%,
leaves us no choice but to consider H.B. Fuller Co worth its Hold rating and nothing more, at the present time. If the stock market tumbles, as some predict, and Fuller dips into the high $50s like last July, the shares will potentially be a worthwhile consideration for a long-term investment opportunity. The stock’s 1.18 Beta volatility rating suggests price stumbles and tumbles are a possibility.
Despite a ~16% gain this year for the S&P 500 sector, materials and tech were down significantly as of May 9, ’23. Liz Ann Sonders points it out in 2 charts:
S&P 500 Sector Performance (LizAnnSonders/status/1656039241942482981)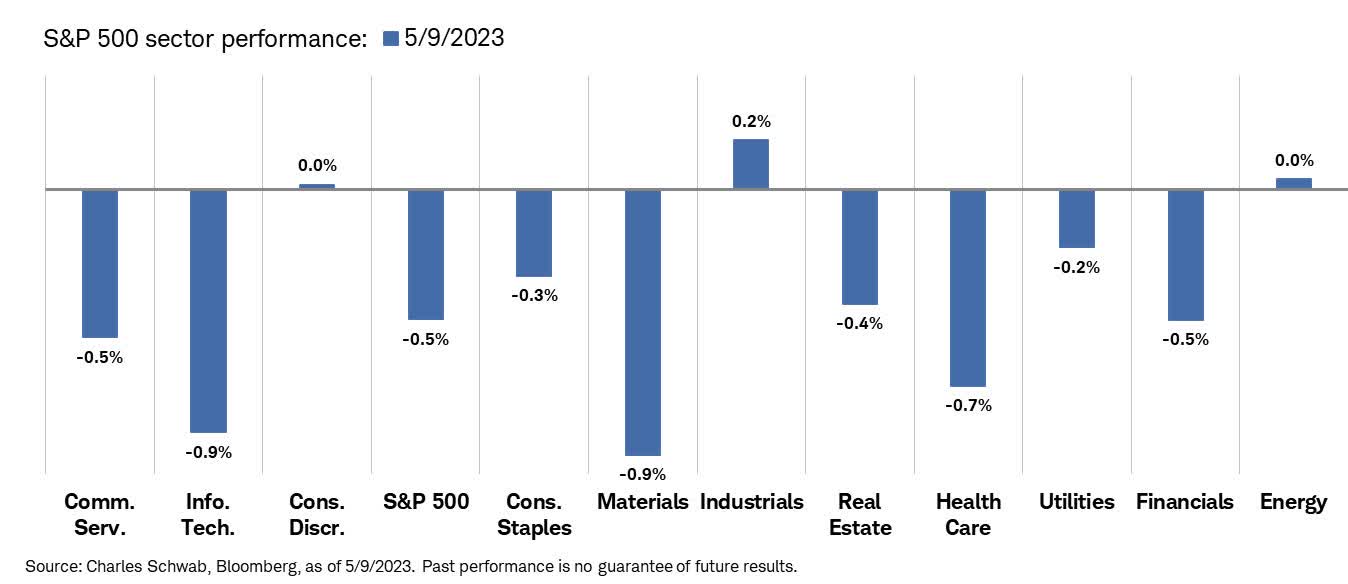
Materials and Tech 2023 (LizAnnSonders/status/1656039241942482981)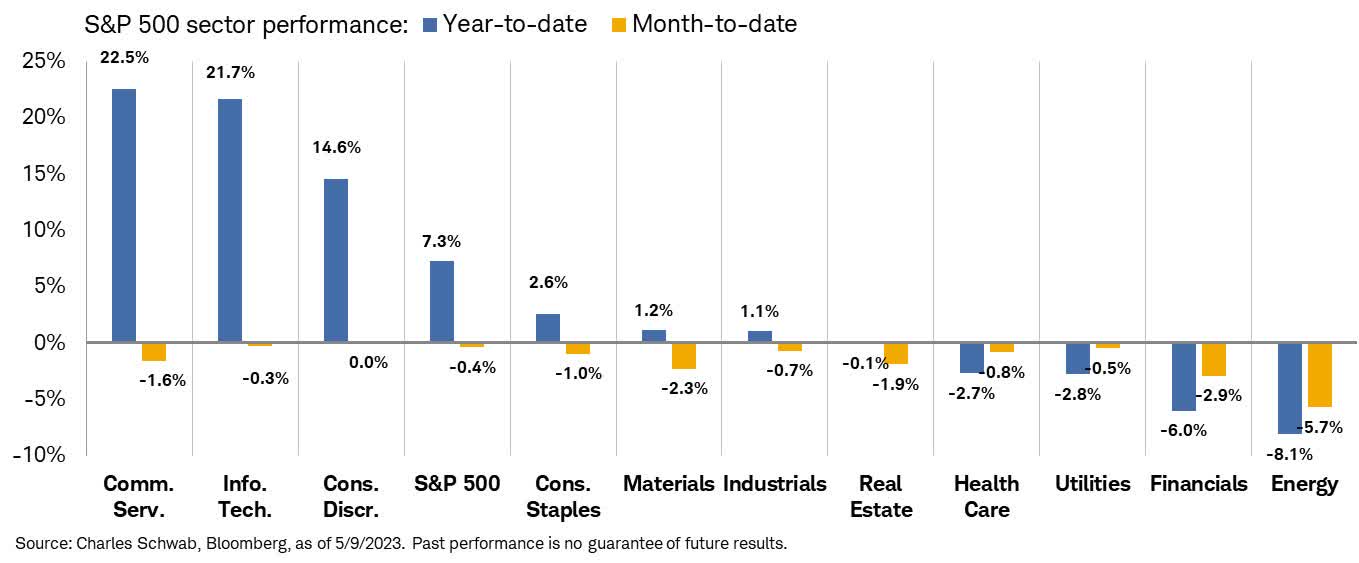
The stock price strolled along the past 12 months barely changing course (-0.42%). YTD, though, Fuller stock drifted -9.42%. Short interest stands at a mere 1.86%. The P/E is rather average at 15.81 compared to the chemical industry at 11, industrial distribution over 19, and building materials at 21.3.
The shares flourish in better economic times. The shares are +62% over the last 10 years. The 52-week high was +$81, as the nation emerged from the pandemic. 2023 worries the adhesives and sealants industry faces are logistics, labor, securing raw materials challenges, and new regulations.
Home improvement market analysts expect 6% to 9% growth in 2023. Only 3% growth in commercial construction and renovations. The outlook for specialty chemicals is to brace yourselves for a worsening economy, at least through most of 2023, according to the U.S. Conference Board. It is incumbent on investors to monitor industry trends to gauge the direction of Fuller’s shares.
The Company
Fuller is an American legacy company that grew along with the American economy. Fuller grew exponentially by M&As in more recent times. It acquired 17 companies in the last 5 years. 90% are in chemicals and 6% in building materials. 5 in the U.S. and 11 of the companies are overseas.
Fuller added new products and markets to its portfolios including aerospace, automotive, beauty, electronics, filtration, hygiene and nonwovens, medical, energy, telecommunications, textiles, and wood composites.
Management released Q1 '23 results on March 29. The tone set in the transcript was the company's emphasis on restructuring to reduce manufacturing costs and SG&A. "When completed, we expect these actions to deliver annualized cost savings of between $30 million and $35 million, including approximately $10 million this year."
Among the most noteworthy items are net revenue ($809M) that was down in Q1 by 5.5% Y/Y; organic revenue -2.5% Y/Y, from less volume. Adjusted gross margin hit 26.9%, an increase of 190 basis points Y/Y that was driven by pricing and raw material cost developments.
Net Income was $22M and adjusted EBITDA was $110 million. Adjusted EPS (diluted) was $0.55, down from the prior year. Lower volume, higher interest expense, and unfavorable foreign currency exchange took their toll.
Sales of hygiene, packaging, tissue and towel, graphic arts, and health and beauty markets were strong, while construction and engineering adhesives sales declined in concert with the struggles of the American economy.
Income Statement Evolution (marketscreener.com/quote/stock/H-B-FULLER-COMPANY-12696/)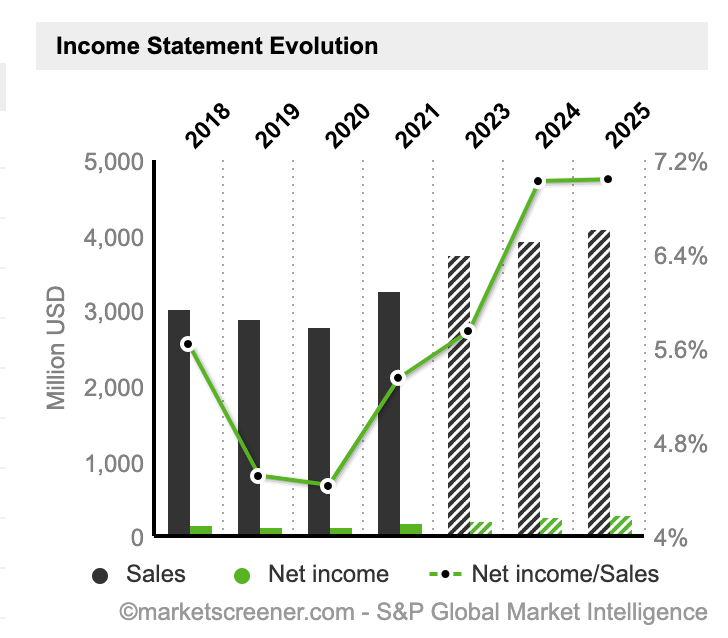
Revenue fell under $3B in FY ‘20 because of the pandemic. It hit $3.28B in FY ‘21 and $3.75B in FY ’22. EPS rose from $2.84 to $3.47, to $4.00, respectively. Q1 cash flow is seldom as strong as the rest of the year, but Q1 '23 cash flow was +$23M Y/Y. The next earnings report is set to be announced on June 28, 2023.
Management announced in April '23 the lay-off of 300 of its more than 7,000 workers as part of their announced restructuring. The Minnesota-based company is closing one plant in North America and another facility in Argentina. Management attributes soft quarter results to slow macroeconomic growth, weak business lasting longer in China, and challenges to end-market demand in construction hurting sales in North America. Much of that is behind the industry and we expect to see improvements in the next few quarterly reports.
Earnings Estimates (seekingalpha.com/symbol/FUL)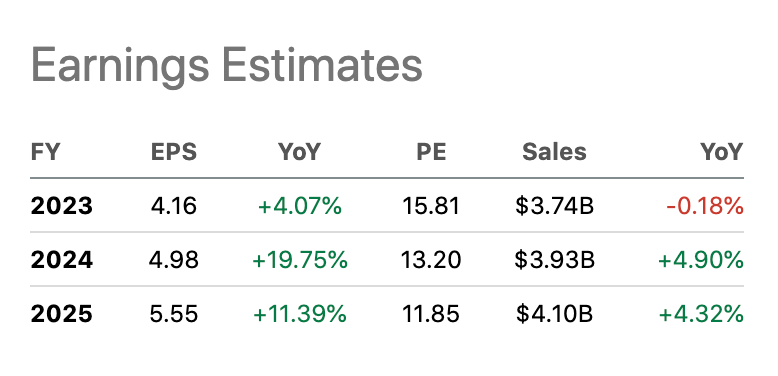
We expect the EPS for the second quarter of 2023 will be reported around $1.05 compared to $1.11 in Q2 ’22. The company beat EPS estimates 6 out of the 8 last quarters.
We do not discern any strong trends regarding insider and hedge fund trading. SA’s D valuation primarily hangs on the low dividend yield and P/E GAAP (TTM). SA rates other metrics in its valuation with Cs and Bs.
Most insider sales happened when the shares topped $70. In 2023, more shares were sold than purchased by these two groups on upturns in the share price. The number of funds owning shares doubled from Q4 ’21 to Q4 ’22 when the share price was climbing to $72 each. We forecast an average price target over the next 7 months at about $70 if the global and national economic news improves but does not worsen.
Takeaway
Downward pressures from global and national economic headwinds are keeping H.B. Fuller Co stock from outperforming. Revenue and earnings took a hit last quarter. The low dividend yield is not attracting investors and it is far lower than other companies provide in the basic materials industry (4.9%).
Analysis (infrontanalytics.com/fe-EN/34590NU/H-B-Fuller-Company/Beta)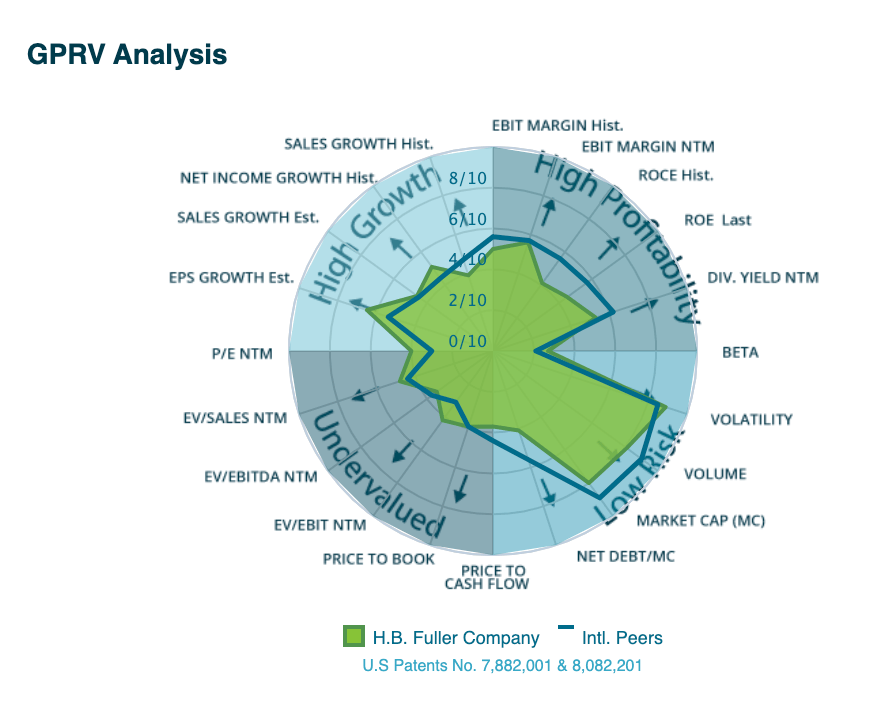
On a positive note, the debt of $1.92B is high but covered by earnings, $125.4M in cash, and cash flow from operations that was up $23M Y/Y. Risks for any major share price retreat are minimal, in our opinion. There is potential for growth and improved revenue and earnings after the last quarterly report. Investors owning H.B. Fuller Co need a strong will to hold their shares in the doom-loop era and we encourage them to follow the stock and the economic data closely.
This article was written by

Analyst’s Disclosure: I/we have no stock, option or similar derivative position in any of the companies mentioned, and no plans to initiate any such positions within the next 72 hours. I wrote this article myself, and it expresses my own opinions. I am not receiving compensation for it (other than from Seeking Alpha). I have no business relationship with any company whose stock is mentioned in this article.
Seeking Alpha's Disclosure: Past performance is no guarantee of future results. No recommendation or advice is being given as to whether any investment is suitable for a particular investor. Any views or opinions expressed above may not reflect those of Seeking Alpha as a whole. Seeking Alpha is not a licensed securities dealer, broker or US investment adviser or investment bank. Our analysts are third party authors that include both professional investors and individual investors who may not be licensed or certified by any institute or regulatory body.